Houses for sale & to rent in Silverdale, Carnforth
House Prices in Silverdale
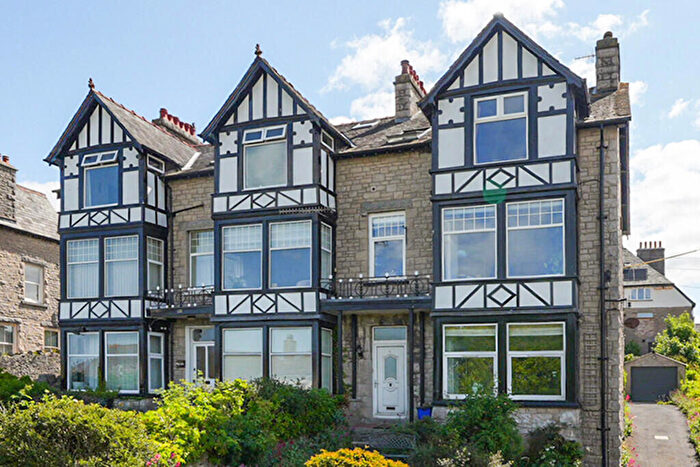
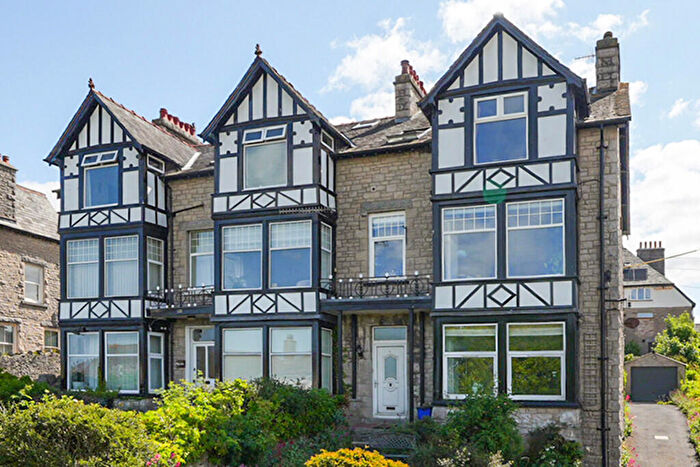
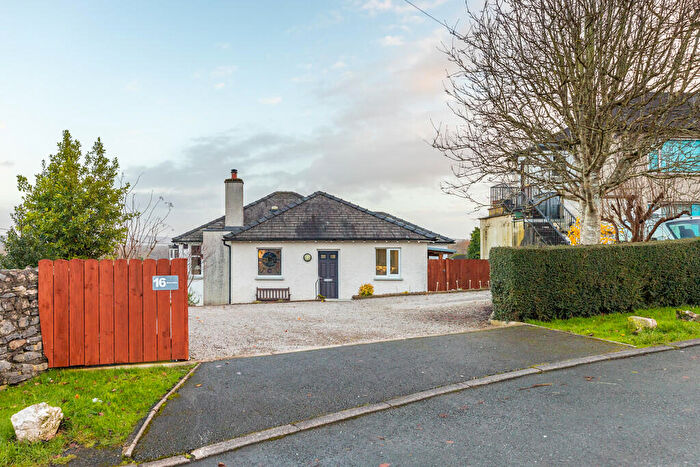
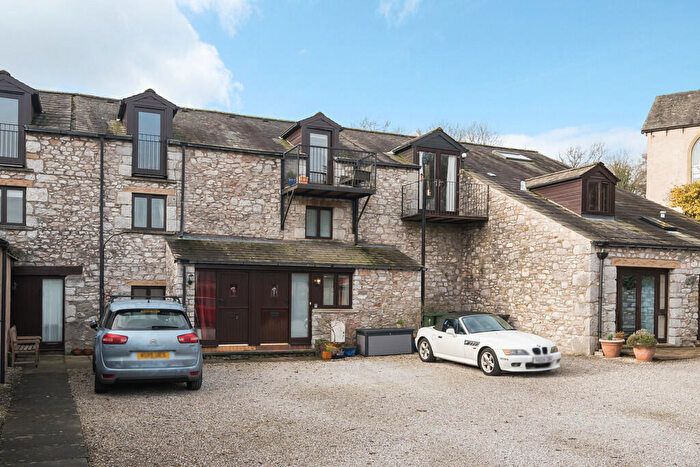
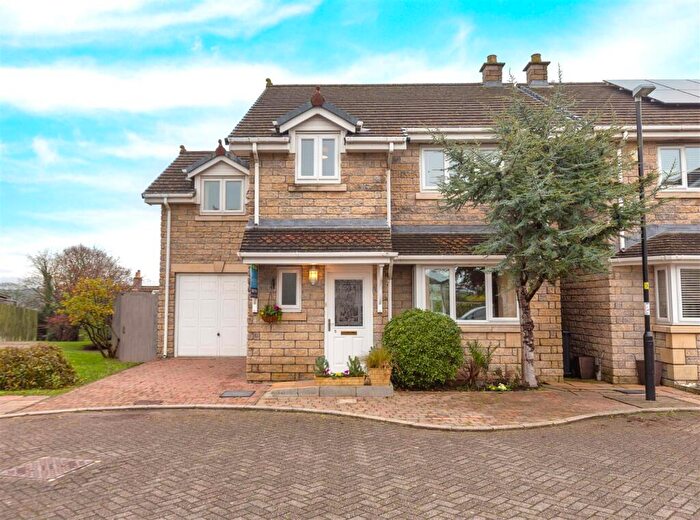
Properties in Silverdale have an average house price of £450,523.00 and had 89 Property Transactions within the last 3 years¹.
Silverdale is an area in Carnforth, Lancashire with 912 households², where the most expensive property was sold for £1,100,000.00.
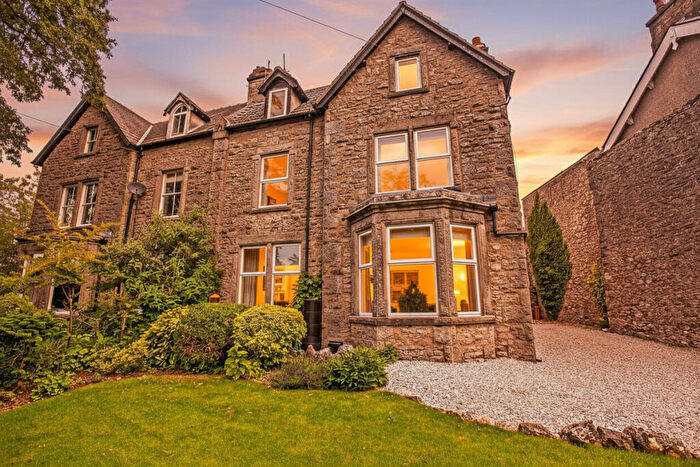
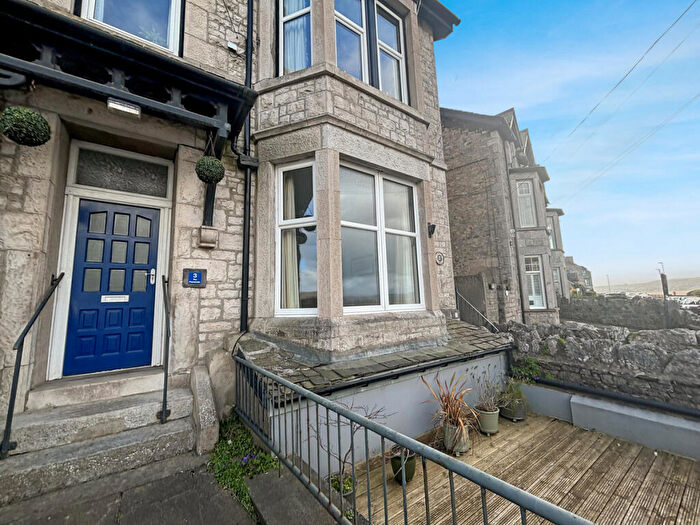
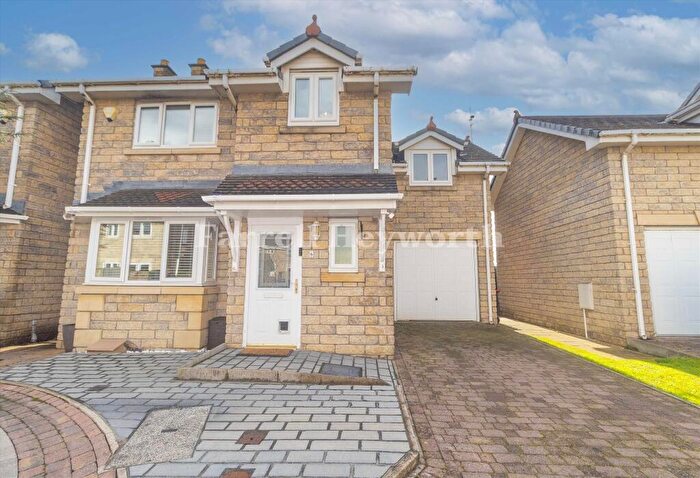
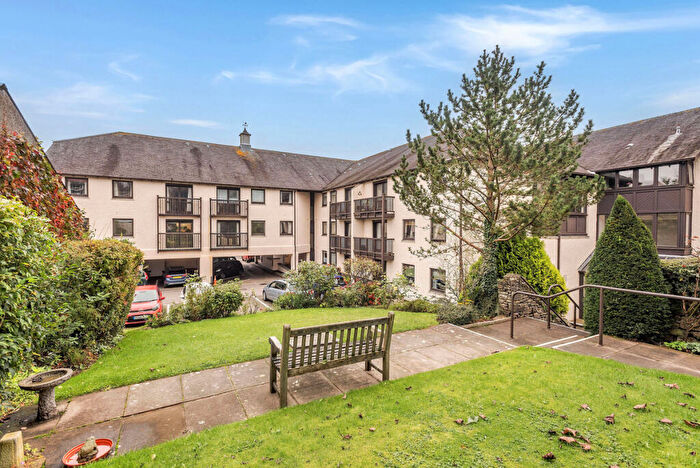
Properties for sale in Silverdale
Roads and Postcodes in Silverdale
Navigate through our locations to find the location of your next house in Silverdale, Carnforth for sale or to rent.
| Streets | Postcodes |
|---|---|
| A6 Road | LA5 9SW |
| Bank House Lane | LA5 0RE |
| Beech Court | LA5 0TB |
| Birch Drive | LA5 0SE |
| Bottoms Lane | LA5 0TN |
| Bradshawgate Drive | LA5 0SF |
| Castle Bank | LA5 0RY |
| Challan Hall Cottages | LA5 0UH |
| Challan Hall Mews | LA5 0JF |
| Churchfield | LA5 0RJ |
| Cinderbarrow Lane | LA5 9RL |
| Clevelands Avenue | LA5 0RP |
| Cove Drive | LA5 0SD |
| Cove Lane | LA5 0SZ |
| Cove Road | LA5 0BF LA5 0RR LA5 0RW LA5 0SB LA5 0SQ LA5 0SG |
| Dykes Lane | LA5 9SN LA5 9SP |
| Elmslack Court | LA5 0RT |
| Elmslack Lane | LA5 0RX |
| Emesgate Lane | LA5 0RA LA5 0RF LA5 0RN LA5 0RG LA5 0RQ |
| Footeran Lane | LA5 9SU |
| Gaskell Close | LA5 0RD |
| Hazelwood | LA5 0TQ |
| Hilderstone Lane | LA5 9RR |
| Hill Top Close | LA5 9TH |
| Hollins Lane | LA5 0UB LA5 0UD |
| Jack Scout Cottages | LA5 0UA |
| Levens Way | LA5 0TG |
| Lindeth Close | LA5 0TU |
| Lindeth Road | LA5 0TT LA5 0TX LA5 0TY |
| Maryland Close | LA5 0TL |
| Meadows Close | LA5 9SZ |
| Moss Lane | LA5 0SS |
| New Road | LA5 0UW |
| Northern Terrace | LA5 0ST |
| Orchard Close | LA5 0UN |
| Pye Hall Cottages | LA5 0UJ |
| Red Bridge Lane | LA5 0SP LA5 0SR |
| Roseacre Lane | LA5 9TY |
| Shore Close | LA5 0TR |
| Shore Cottages | LA5 0TS |
| Shore Green | LA5 0UL |
| Shore Road | LA5 0TP |
| Silverdale Road | LA5 9TA LA5 9TB LA5 9TD |
| Slackwood Lane | LA5 0UF |
| Spring Bank | LA5 0TD LA5 0TE |
| St Johns Avenue | LA5 0SU |
| St Johns Grove | LA5 0RH |
| Stankelt Road | LA5 0TA LA5 0TF LA5 0TH LA5 0TW LA5 0UE |
| Stoneleigh Court | LA5 0UR |
| Storrs Lane | LA5 0SW |
| Tarn Lane | LA5 9RX |
| Temple Court | LA5 9UD |
| The Chase | LA5 0UT |
| The Green | LA5 0TJ |
| The Meadows | LA5 9SY |
| The Row | LA5 0UG |
| Townsfield | LA5 0RS |
| Wallings Lane | LA5 0RZ LA5 0SA |
| Well Lane | LA5 9SX |
| Whinney Fold | LA5 0JG |
| Woodlands Drive | LA5 0RU |
| Woodwell Lane | LA5 0TZ |
| Yealand Road | LA5 9SF LA5 9SG LA5 9SJ LA5 9SQ |
| Yew Tree Gardens | LA5 0US |
| LA5 0UQ LA5 9RW LA5 9SL LA5 9TF LA5 9TG LA5 9RN LA5 9TE |
Transport near Silverdale
- FAQ
- Price Paid By Year
- Property Type Price
Frequently asked questions about Silverdale
What is the average price for a property for sale in Silverdale?
The average price for a property for sale in Silverdale is £450,523. This amount is 57% higher than the average price in Carnforth. There are 443 property listings for sale in Silverdale.
What streets have the most expensive properties for sale in Silverdale?
The streets with the most expensive properties for sale in Silverdale are Elmslack Lane at an average of £662,900, Lindeth Road at an average of £560,958 and The Row at an average of £542,500.
What streets have the most affordable properties for sale in Silverdale?
The streets with the most affordable properties for sale in Silverdale are Hollins Lane at an average of £212,500, Shore Close at an average of £310,000 and Cove Road at an average of £338,437.
Which train stations are available in or near Silverdale?
Some of the train stations available in or near Silverdale are Silverdale, Arnside and Carnforth.
Property Price Paid in Silverdale by Year
The average sold property price by year was:
| Year | Average Sold Price | Price Change |
Sold Properties
|
|---|---|---|---|
| 2025 | £451,952 | 1% |
21 Properties |
| 2024 | £448,516 | -1% |
31 Properties |
| 2023 | £451,394 | -10% |
37 Properties |
| 2022 | £496,560 | 30% |
25 Properties |
| 2021 | £349,485 | -4% |
41 Properties |
| 2020 | £363,364 | 2% |
37 Properties |
| 2019 | £357,278 | -3% |
41 Properties |
| 2018 | £368,510 | 21% |
27 Properties |
| 2017 | £291,082 | -17% |
39 Properties |
| 2016 | £341,229 | 1% |
47 Properties |
| 2015 | £336,553 | 13% |
46 Properties |
| 2014 | £292,059 | 5% |
42 Properties |
| 2013 | £278,630 | -20% |
38 Properties |
| 2012 | £335,502 | 17% |
23 Properties |
| 2011 | £279,307 | -16% |
20 Properties |
| 2010 | £325,169 | 7% |
31 Properties |
| 2009 | £301,041 | -2% |
36 Properties |
| 2008 | £307,412 | 6% |
27 Properties |
| 2007 | £289,615 | -4% |
45 Properties |
| 2006 | £301,068 | 5% |
51 Properties |
| 2005 | £285,647 | 5% |
38 Properties |
| 2004 | £270,648 | 19% |
43 Properties |
| 2003 | £219,060 | 18% |
33 Properties |
| 2002 | £180,575 | 12% |
61 Properties |
| 2001 | £159,611 | 18% |
50 Properties |
| 2000 | £131,366 | 19% |
64 Properties |
| 1999 | £106,848 | 6% |
53 Properties |
| 1998 | £99,988 | 2% |
57 Properties |
| 1997 | £97,788 | 3% |
42 Properties |
| 1996 | £94,742 | -6% |
30 Properties |
| 1995 | £100,567 | - |
37 Properties |
Property Price per Property Type in Silverdale
Here you can find historic sold price data in order to help with your property search.
The average Property Paid Price for specific property types in the last three years are:
| Property Type | Average Sold Price | Sold Properties |
|---|---|---|
| Semi Detached House | £415,506.00 | 15 Semi Detached Houses |
| Detached House | £527,585.00 | 47 Detached Houses |
| Terraced House | £391,843.00 | 16 Terraced Houses |
| Flat | £254,363.00 | 11 Flats |

