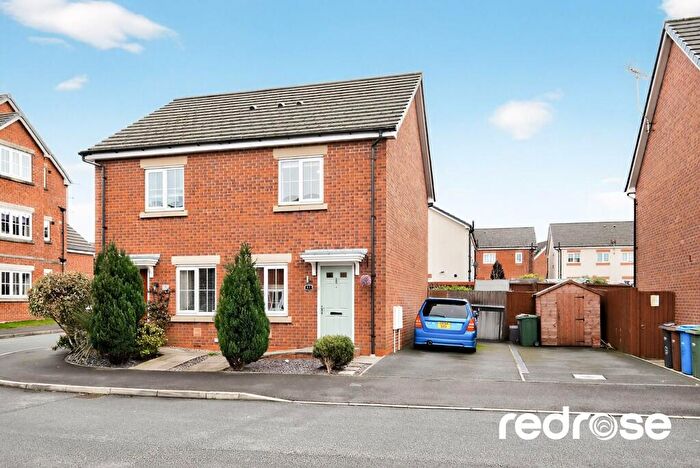
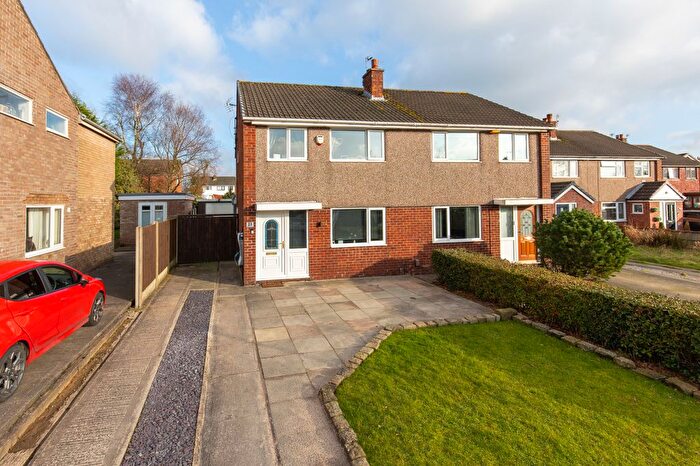
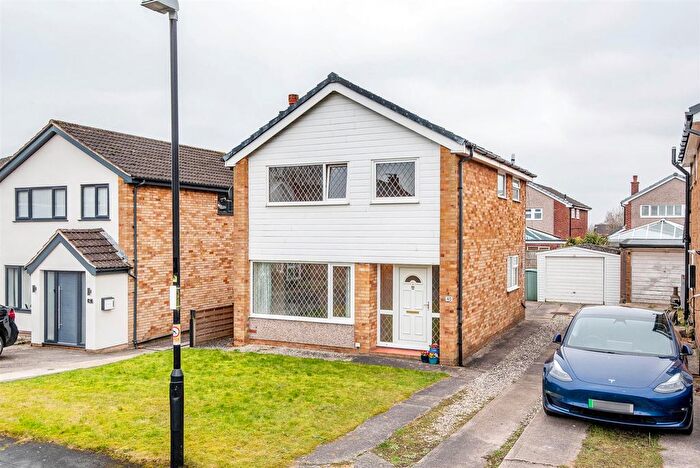
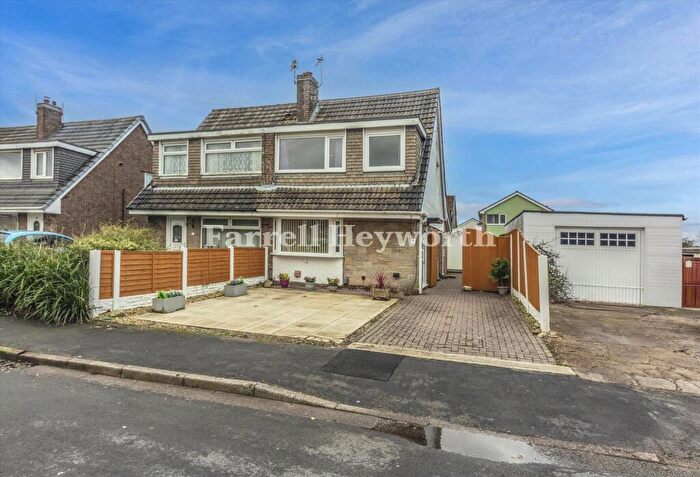
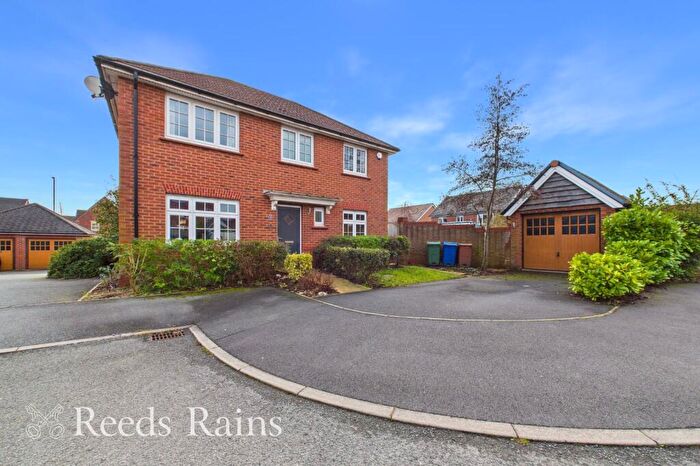
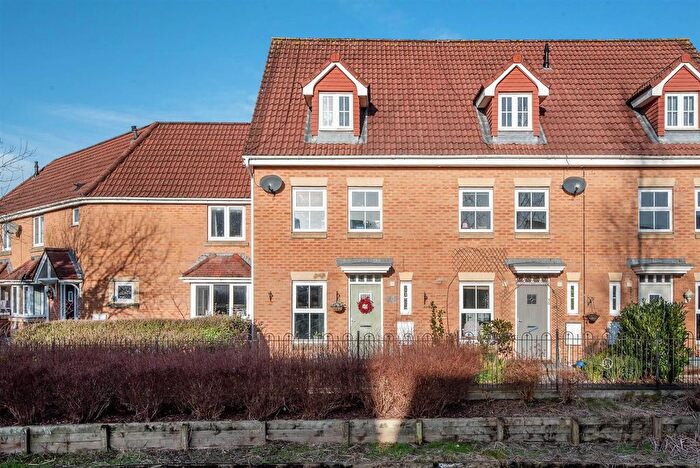
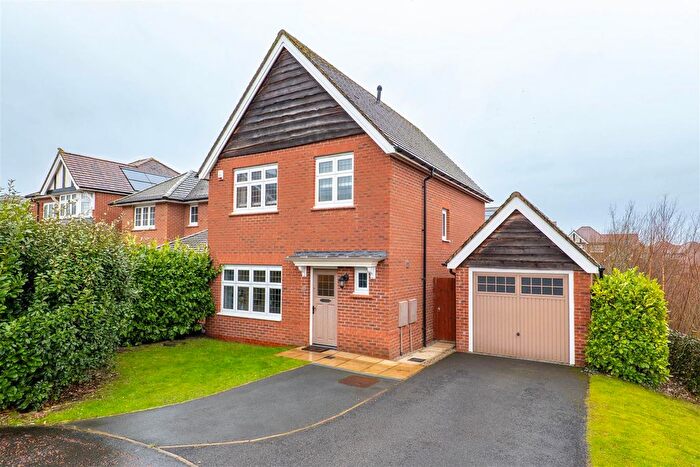
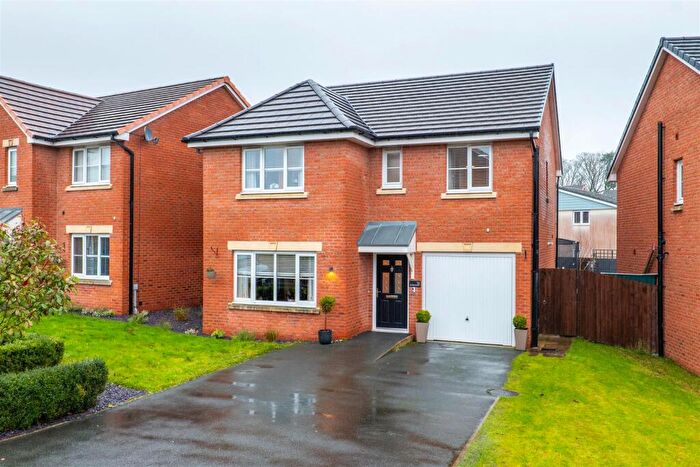
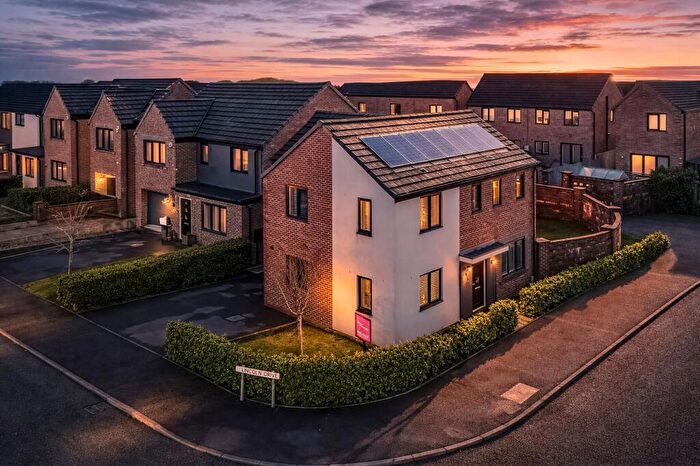
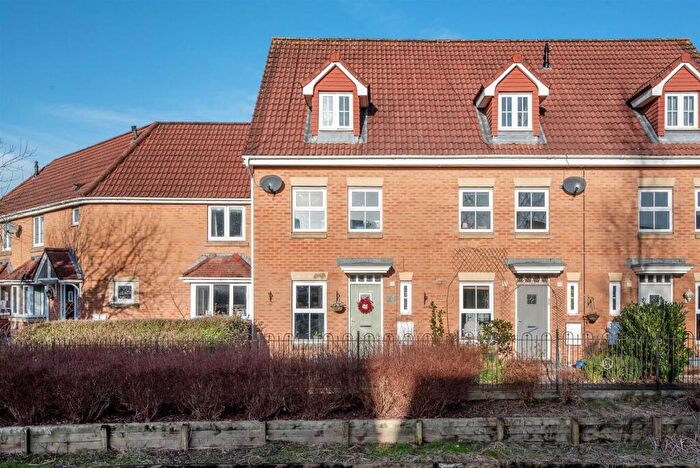
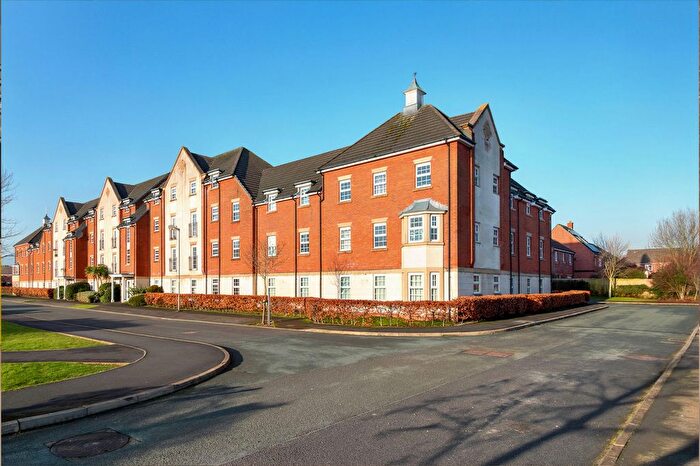
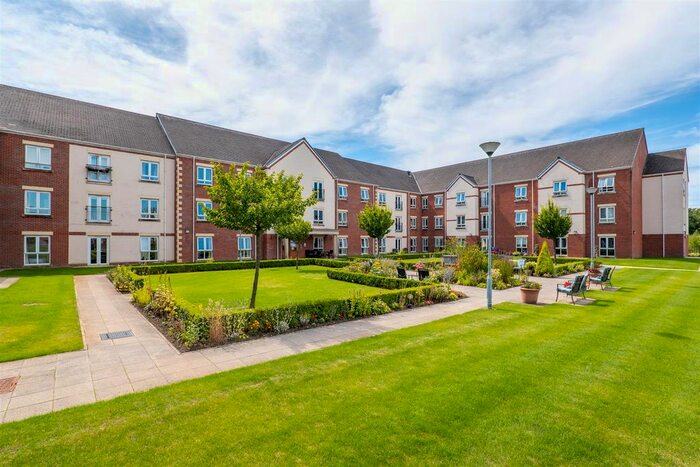
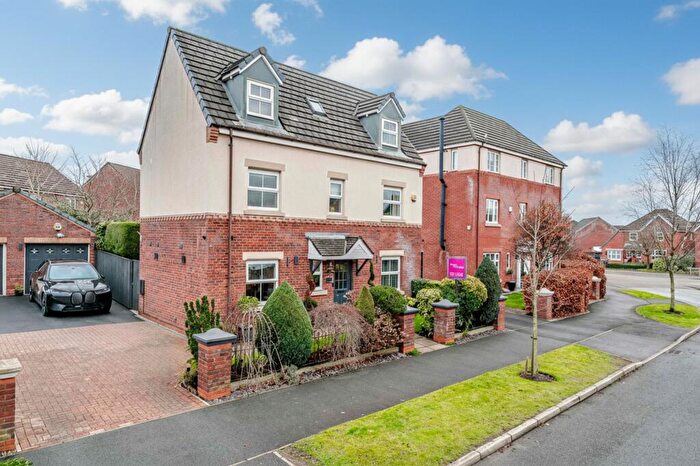
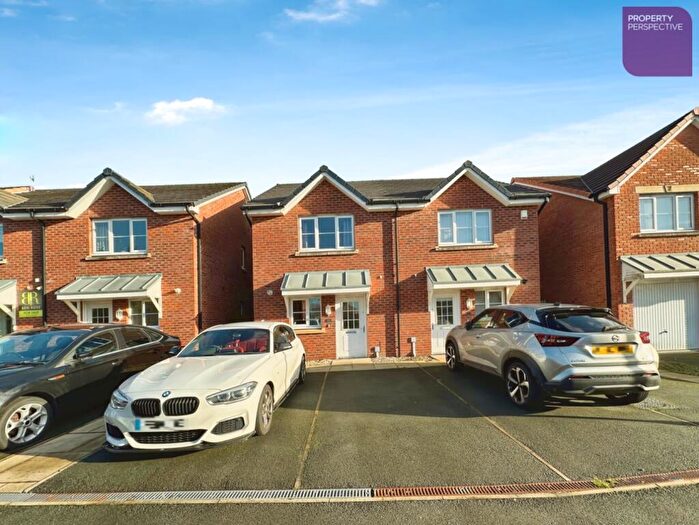
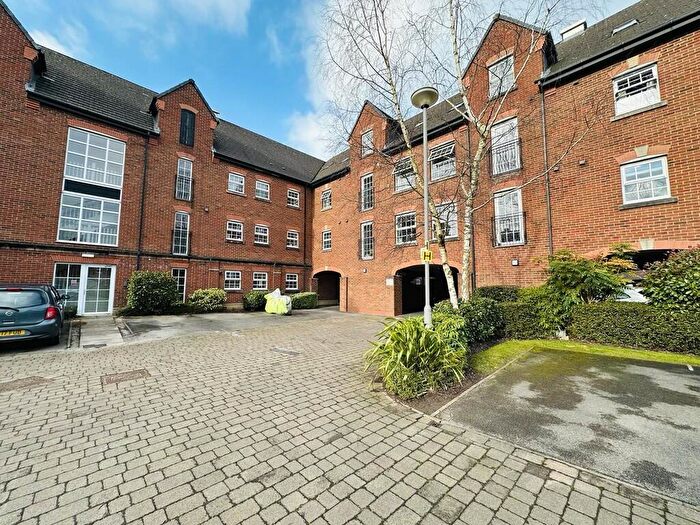
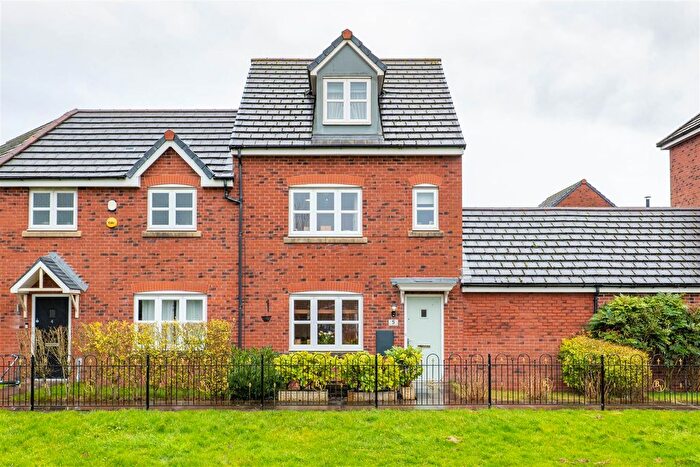
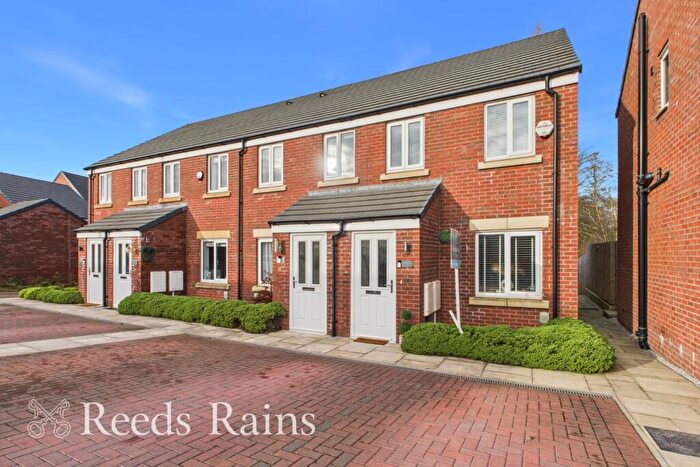
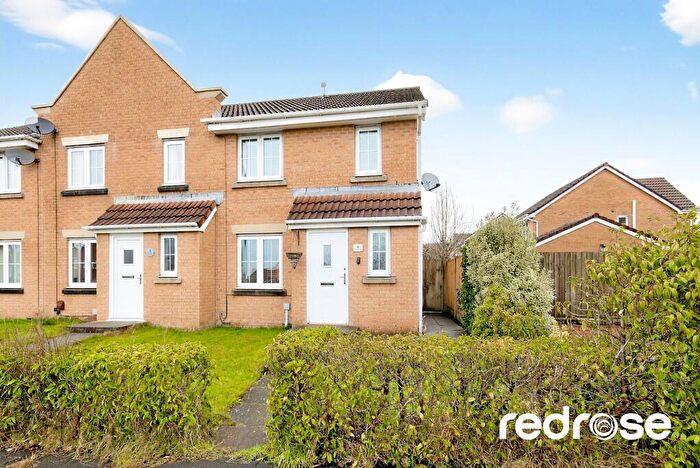
Houses for sale & to rent in Leyland St. Ambrose, Chorley
House Prices in Leyland St. Ambrose
Properties in Leyland St. Ambrose have an average house price of £189,024.00 and had 171 Property Transactions within the last 3 years¹.
Leyland St. Ambrose is an area in Chorley, Lancashire with 756 households², where the most expensive property was sold for £455,000.00.
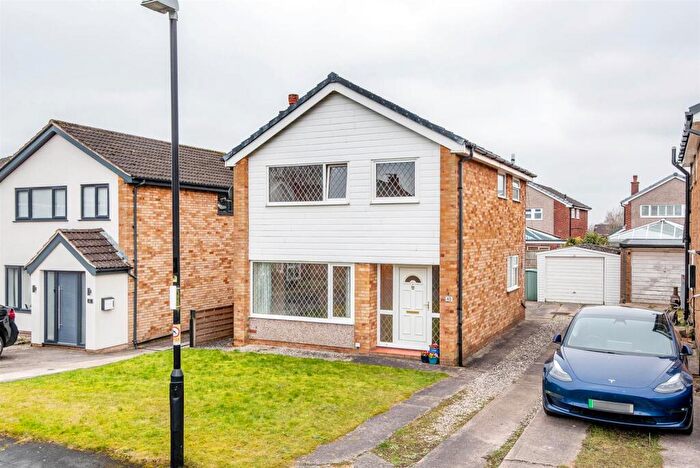
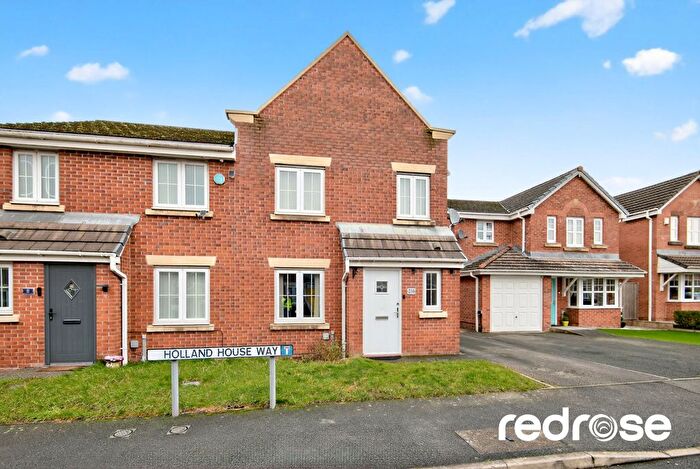
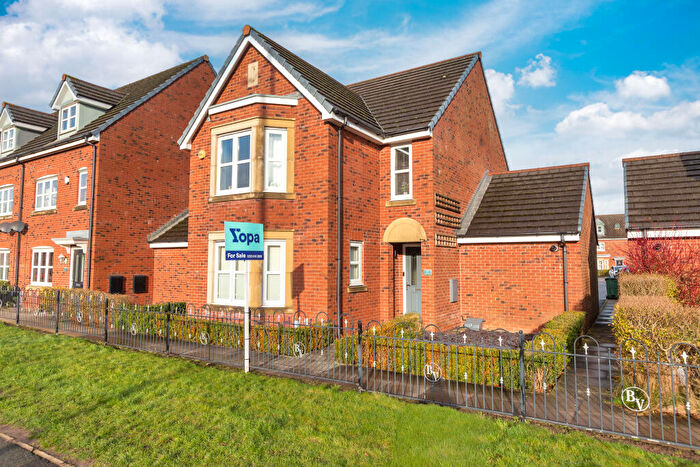
Properties for sale in Leyland St. Ambrose
Roads and Postcodes in Leyland St. Ambrose
Navigate through our locations to find the location of your next house in Leyland St. Ambrose, Chorley for sale or to rent.
| Streets | Postcodes |
|---|---|
| Anderton Crescent | PR7 7BA PR7 7BB |
| Baker Close | PR7 7BX |
| Bamber Avenue | PR7 7BD |
| Bamburgh Drive | PR7 7GX |
| Bracken Ghyll Close | PR7 7FE |
| Broadstone Drive | PR7 7BE |
| Brookwood Way | PR7 7GW PR7 7HH |
| Central Avenue | PR7 7DH |
| Cordwainers Court | PR7 7AT |
| Dukinfield Court | PR7 7FH |
| Dunnerholme Avenue | PR7 7HJ |
| Durham Drive | PR7 7AW PR7 7AY |
| Farleigh Court | PR7 7FJ |
| Ferndown Avenue | PR7 7GZ |
| Guernsey Avenue | PR7 7AG |
| Hazelmere Avenue | PR7 7FD |
| Hereford Grove | PR7 7AL |
| Highland Drive | PR7 7AB PR7 7AD |
| Home Park Drive | PR7 7EA |
| Jersey Fold | PR7 7AA |
| Main Square | PR7 7AR |
| Marine Crescent | PR7 7AN PR7 7AP |
| Marlborough Close | PR7 7HA |
| Mayflower Crescent | PR7 7BF |
| Old Thorns Crescent | PR7 7JP PR7 7JQ |
| Oxford Mews | PR7 7AJ |
| Perthshire Grove | PR7 7AE |
| Saunton Walk | PR7 7FG |
| Silverstone Street | PR7 7EB |
| Spinners Court | PR7 7AU |
| Springwater Close | PR7 7FF |
| Stockwood Park Court | PR7 7JJ |
| Sunningdale Drive | PR7 7DU PR7 7ED |
| Trethorne Avenue | PR7 7GY |
| Windlemere Close | PR7 7HE |
Transport near Leyland St. Ambrose
- FAQ
- Price Paid By Year
- Property Type Price
Frequently asked questions about Leyland St. Ambrose
What is the average price for a property for sale in Leyland St. Ambrose?
The average price for a property for sale in Leyland St. Ambrose is £189,024. This amount is 16% lower than the average price in Chorley. There are 1,187 property listings for sale in Leyland St. Ambrose.
What streets have the most expensive properties for sale in Leyland St. Ambrose?
The streets with the most expensive properties for sale in Leyland St. Ambrose are Stockwood Park Court at an average of £415,000, Jersey Fold at an average of £381,750 and Dunnerholme Avenue at an average of £363,000.
What streets have the most affordable properties for sale in Leyland St. Ambrose?
The streets with the most affordable properties for sale in Leyland St. Ambrose are Spinners Court at an average of £103,865, Cordwainers Court at an average of £105,750 and Oxford Mews at an average of £107,500.
Which train stations are available in or near Leyland St. Ambrose?
Some of the train stations available in or near Leyland St. Ambrose are Buckshaw Parkway, Leyland and Euxton Balshaw Lane.
Property Price Paid in Leyland St. Ambrose by Year
The average sold property price by year was:
| Year | Average Sold Price | Price Change |
Sold Properties
|
|---|---|---|---|
| 2025 | £203,890 | 10% |
55 Properties |
| 2024 | £183,526 | 2% |
58 Properties |
| 2023 | £180,424 | -5% |
58 Properties |
| 2022 | £188,673 | 1% |
69 Properties |
| 2021 | £187,150 | 6% |
97 Properties |
| 2020 | £176,295 | 11% |
61 Properties |
| 2019 | £157,619 | -5% |
78 Properties |
| 2018 | £165,694 | 2% |
75 Properties |
| 2017 | £162,379 | 4% |
92 Properties |
| 2016 | £156,409 | -9% |
83 Properties |
| 2015 | £170,960 | -5% |
97 Properties |
| 2014 | £179,404 | -2% |
147 Properties |
| 2013 | £182,831 | 25% |
125 Properties |
| 2012 | £137,031 | -24% |
65 Properties |
| 2011 | £169,760 | 19% |
77 Properties |
| 2010 | £137,487 | 7% |
79 Properties |
| 2009 | £127,189 | -18% |
84 Properties |
| 2008 | £150,691 | -18% |
110 Properties |
| 2007 | £178,374 | 6% |
90 Properties |
| 2006 | £168,412 | 6% |
103 Properties |
| 2005 | £158,903 | 4% |
176 Properties |
| 2004 | £152,225 | -31% |
155 Properties |
| 2003 | £198,688 | - |
52 Properties |
Property Price per Property Type in Leyland St. Ambrose
Here you can find historic sold price data in order to help with your property search.
The average Property Paid Price for specific property types in the last three years are:
| Property Type | Average Sold Price | Sold Properties |
|---|---|---|
| Semi Detached House | £206,811.00 | 34 Semi Detached Houses |
| Detached House | £292,202.00 | 37 Detached Houses |
| Terraced House | £186,169.00 | 44 Terraced Houses |
| Flat | £112,296.00 | 56 Flats |

