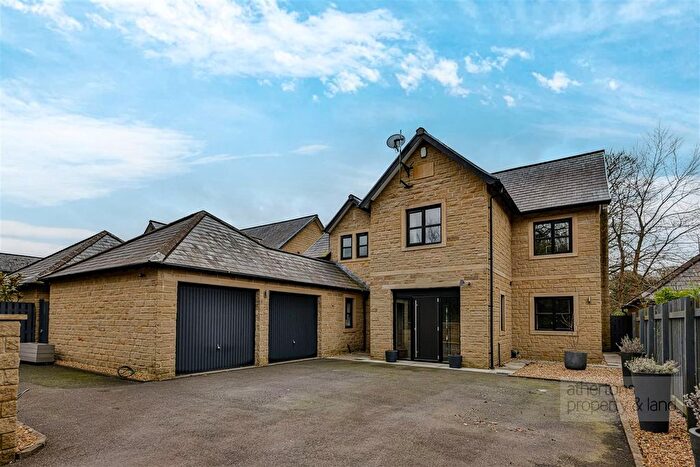
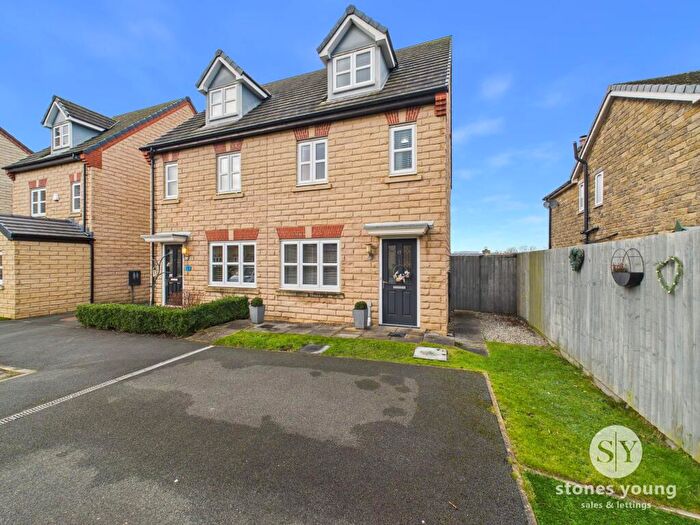
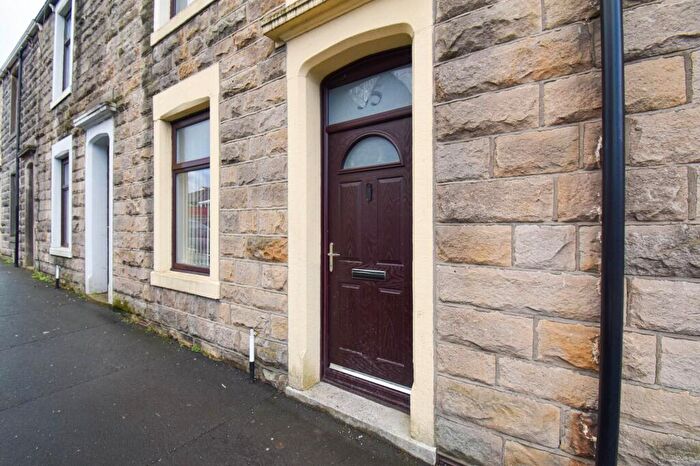
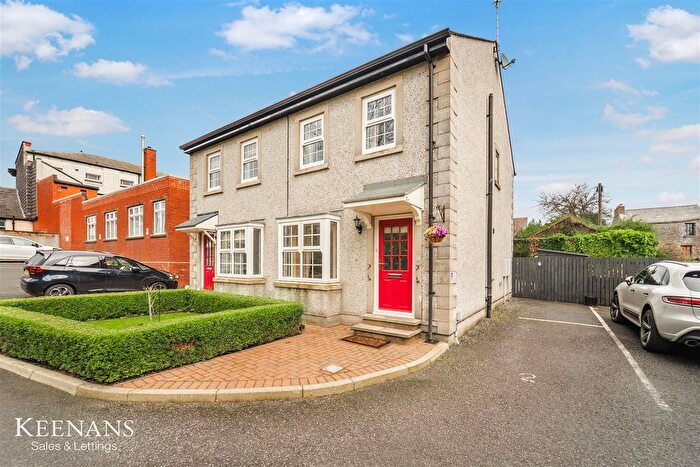
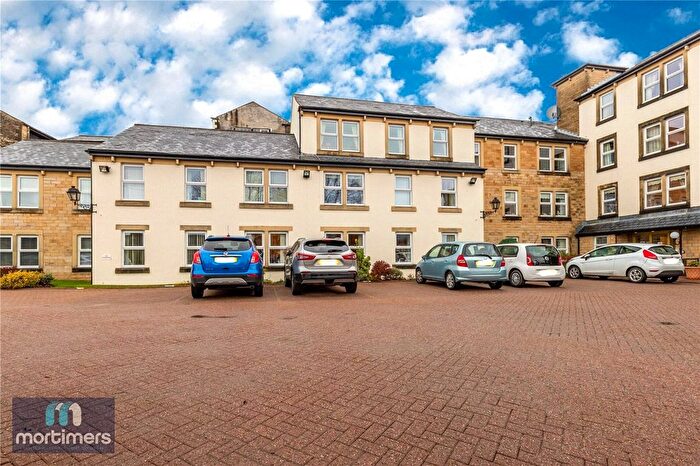
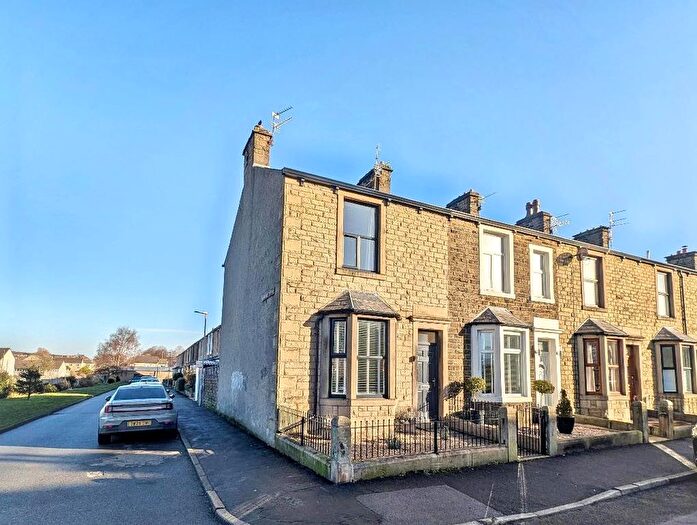
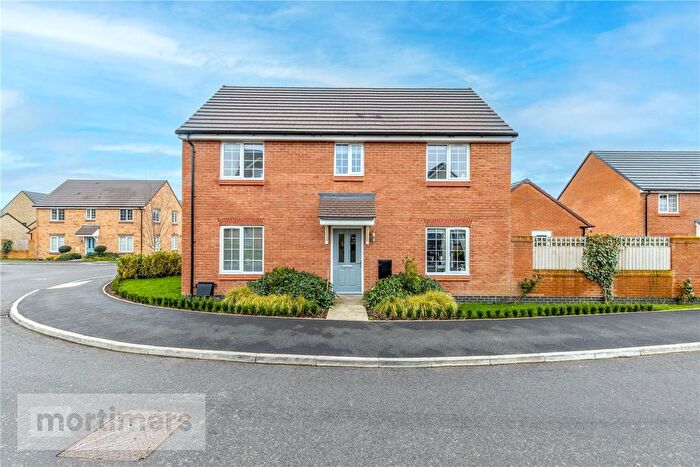
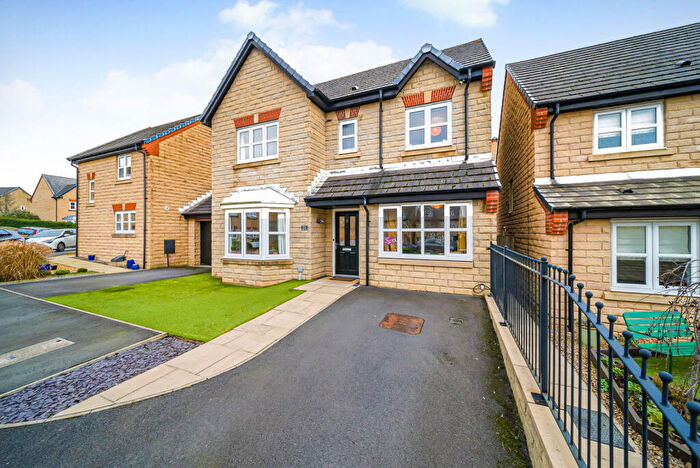
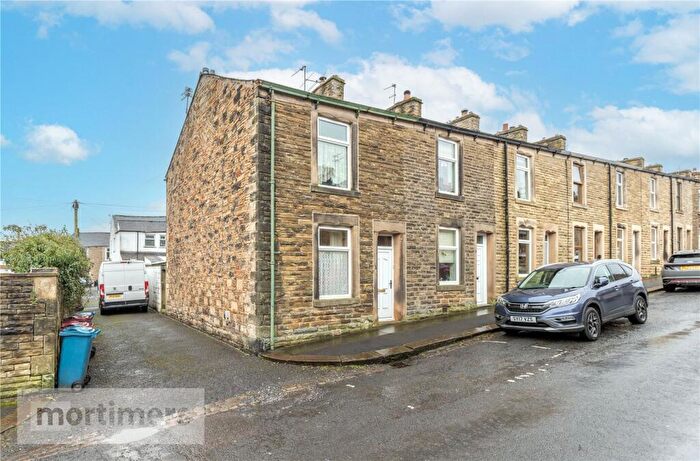
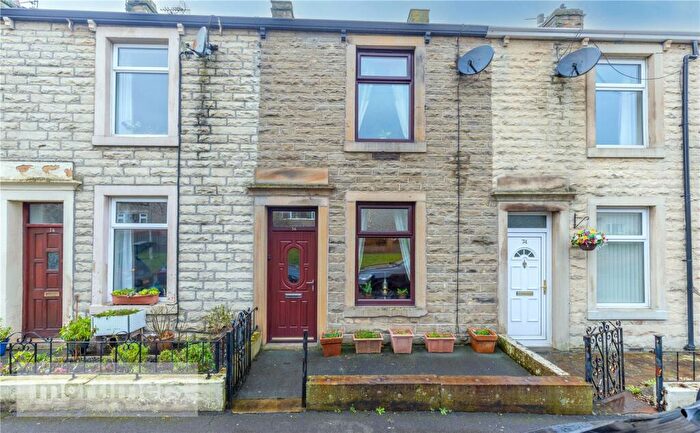
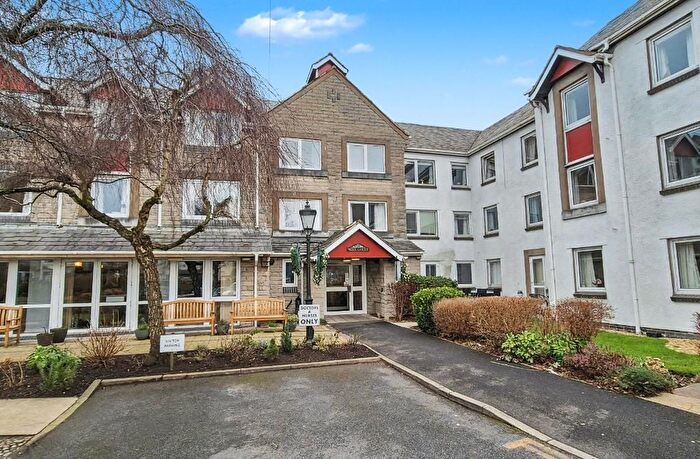
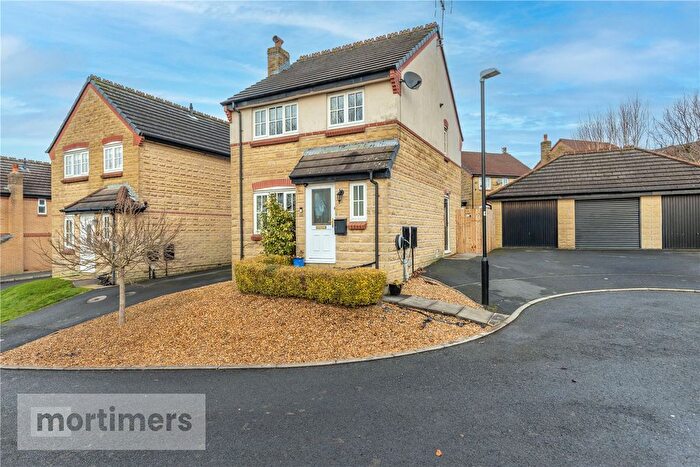
Houses for sale & to rent in Littlemoor, Clitheroe
House Prices in Littlemoor
Properties in Littlemoor have an average house price of £221,699.00 and had 190 Property Transactions within the last 3 years¹.
Littlemoor is an area in Clitheroe, Lancashire with 1,381 households², where the most expensive property was sold for £615,000.00.
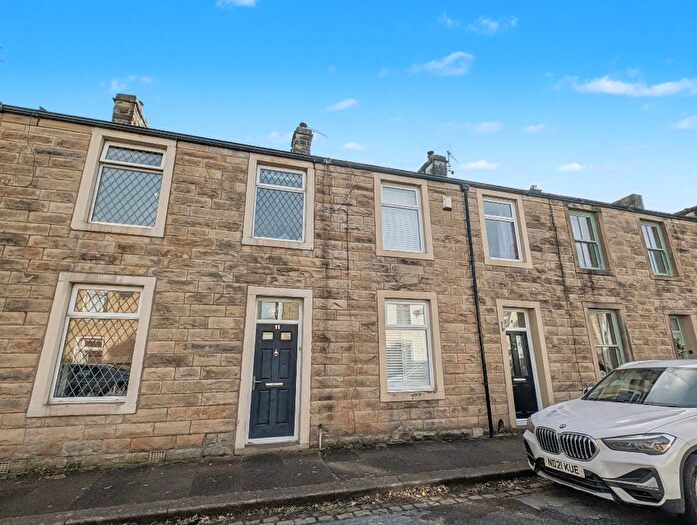
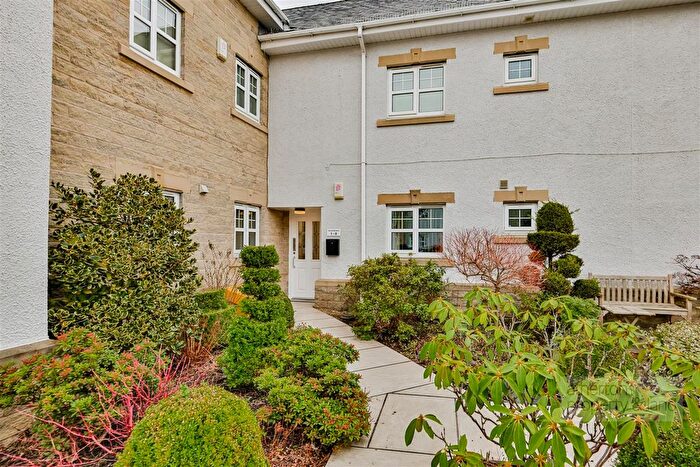
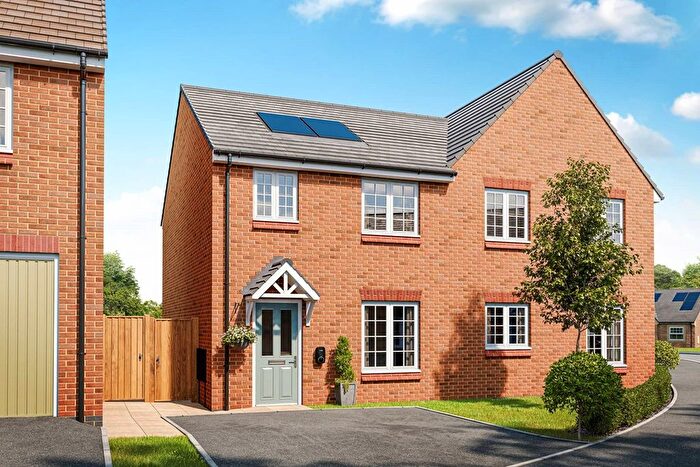
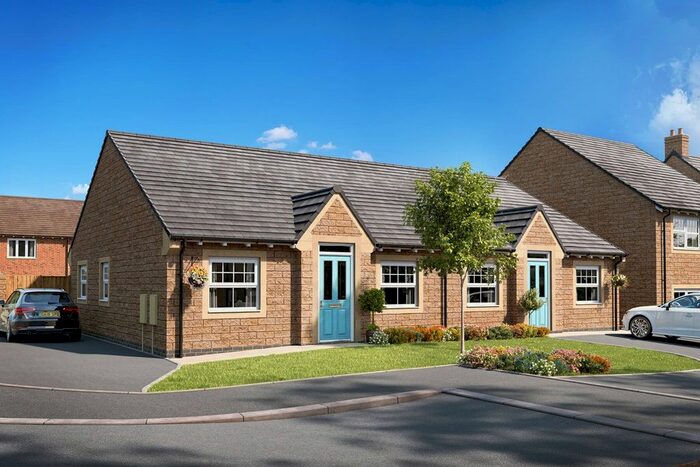
Properties for sale in Littlemoor
Roads and Postcodes in Littlemoor
Navigate through our locations to find the location of your next house in Littlemoor, Clitheroe for sale or to rent.
| Streets | Postcodes |
|---|---|
| Audley Clough | BB7 1FX |
| Beechwood Avenue | BB7 1EZ |
| Bolland Close | BB7 1JX |
| Bolland Prospect | BB7 1JU |
| Bowland Court | BB7 1AS |
| Brett Close | BB7 1LN |
| Brotherton Meadows | BB7 1RB |
| Brownhill Grove | BB7 1FY |
| Brownlow Street | BB7 1EG BB7 1HQ |
| Candlemakers Court | BB7 1AH |
| Candlemakers Croft | BB7 1AB |
| Carlton Place | BB7 1NG |
| Castle Street | BB7 2BX |
| Centurion Way | BB7 1FU |
| Claremont Avenue | BB7 1JN |
| Claremont Drive | BB7 1JW |
| Copperfield Close | BB7 1ER |
| Cottage Close | BB7 1GX |
| Croasdale Drive | BB7 1LQ |
| Croft Street | BB7 1HL |
| Dyke Nook | BB7 1JJ |
| Eastmoor Drive | BB7 1LG |
| Gills Croft | BB7 1LJ |
| Goosebutts Lane | BB7 1JT |
| Grafton Street | BB7 1NQ |
| Greenacre Street | BB7 1ED |
| Hall Street | BB7 1HJ |
| Hayhurst Farm Terrace | BB7 1PJ |
| Hayhurst Street | BB7 1ND |
| Hereford Drive | BB7 1JP |
| Higher Standen Drive | BB7 1FT |
| Highfield Road | BB7 1AQ BB7 1LD BB7 1NE |
| Hill Road | BB7 1RE |
| Hillside Close | BB7 1HB |
| Hillside View | BB7 1GT |
| Langshaw Drive | BB7 1EY |
| Linden Drive | BB7 1JL |
| Lingfield Avenue | BB7 1HA |
| Littlemoor | BB7 1HF |
| Littlemoor Road | BB7 1ES BB7 1EW |
| Littlemoor View | BB7 1HS |
| Lowergate | BB7 1AD BB7 1AG |
| Mayfield Avenue | BB7 1LB BB7 1LE |
| Mearley Brook Fold | BB7 1NZ |
| Moor End | BB7 1JZ |
| North Gate | BB7 1FS |
| Pagefield Crescent | BB7 1LH |
| Park Street | BB7 1HR BB7 1HD |
| Peel Park Avenue | BB7 1ET BB7 1EU BB7 1JR |
| Peel Park Close | BB7 1EX |
| Peel Street | BB7 1NF |
| Pendle Court | BB7 1PH |
| Pendle Road | BB7 1JQ |
| Pendlebrook | BB7 1GY |
| Pendleton Avenue | BB7 1FW |
| Primula Crescent | BB7 1FG |
| Queens Close | BB7 1AP BB7 1EH |
| Queens Road | BB7 1AR BB7 1EJ BB7 1EL |
| Roman Road Crescent | BB7 1FZ |
| Saddlers Mews | BB7 1AF |
| Shays Drive | BB7 1LL |
| Springbrook | BB7 1GZ |
| St James Street | BB7 1HH |
| Standen Edge | BB7 1RD |
| Standen Road | BB7 1JY |
| Standen Road Bungalows | BB7 1LA |
| Sundrop Close | BB7 1FH |
| Sycamore Walk | BB7 1FJ |
| Talbot Close | BB7 1LF |
| Turner Street | BB7 1EN BB7 1EQ |
| Upbrooks Street | BB7 1RQ |
| Valley Lane | BB7 1HE |
| Whalley Road | BB7 1EE BB7 1HU BB7 1PW |
| Worston Road | BB7 1PR |
| BB7 1GU BB7 1HG |
Transport near Littlemoor
- FAQ
- Price Paid By Year
- Property Type Price
Frequently asked questions about Littlemoor
What is the average price for a property for sale in Littlemoor?
The average price for a property for sale in Littlemoor is £221,699. This amount is 27% lower than the average price in Clitheroe. There are 550 property listings for sale in Littlemoor.
What streets have the most expensive properties for sale in Littlemoor?
The streets with the most expensive properties for sale in Littlemoor are Gills Croft at an average of £526,500, North Gate at an average of £465,000 and Sundrop Close at an average of £415,000.
What streets have the most affordable properties for sale in Littlemoor?
The streets with the most affordable properties for sale in Littlemoor are Littlemoor View at an average of £108,000, Whalley Road at an average of £112,500 and Candlemakers Court at an average of £114,255.
Which train stations are available in or near Littlemoor?
Some of the train stations available in or near Littlemoor are Clitheroe, Whalley and Langho.
Property Price Paid in Littlemoor by Year
The average sold property price by year was:
| Year | Average Sold Price | Price Change |
Sold Properties
|
|---|---|---|---|
| 2025 | £246,708 | 20% |
58 Properties |
| 2024 | £196,972 | -14% |
67 Properties |
| 2023 | £224,871 | -5% |
65 Properties |
| 2022 | £234,996 | 11% |
65 Properties |
| 2021 | £208,576 | -9% |
87 Properties |
| 2020 | £227,972 | 3% |
105 Properties |
| 2019 | £221,426 | -12% |
122 Properties |
| 2018 | £248,444 | 7% |
89 Properties |
| 2017 | £230,045 | 39% |
73 Properties |
| 2016 | £140,678 | -34% |
49 Properties |
| 2015 | £188,650 | 11% |
56 Properties |
| 2014 | £168,309 | 4% |
52 Properties |
| 2013 | £162,062 | 10% |
61 Properties |
| 2012 | £145,891 | -27% |
42 Properties |
| 2011 | £185,167 | 10% |
42 Properties |
| 2010 | £166,358 | 8% |
41 Properties |
| 2009 | £153,522 | 3% |
32 Properties |
| 2008 | £149,533 | -18% |
39 Properties |
| 2007 | £175,739 | 13% |
51 Properties |
| 2006 | £152,056 | 6% |
66 Properties |
| 2005 | £143,406 | -0,4% |
54 Properties |
| 2004 | £144,021 | 30% |
92 Properties |
| 2003 | £101,231 | 12% |
85 Properties |
| 2002 | £88,858 | 37% |
69 Properties |
| 2001 | £55,766 | -6% |
76 Properties |
| 2000 | £59,261 | -2% |
55 Properties |
| 1999 | £60,314 | -0,2% |
52 Properties |
| 1998 | £60,454 | 4% |
61 Properties |
| 1997 | £57,995 | 3% |
60 Properties |
| 1996 | £56,107 | 17% |
49 Properties |
| 1995 | £46,799 | - |
45 Properties |
Property Price per Property Type in Littlemoor
Here you can find historic sold price data in order to help with your property search.
The average Property Paid Price for specific property types in the last three years are:
| Property Type | Average Sold Price | Sold Properties |
|---|---|---|
| Semi Detached House | £265,867.00 | 55 Semi Detached Houses |
| Detached House | £383,209.00 | 32 Detached Houses |
| Terraced House | £150,977.00 | 79 Terraced Houses |
| Flat | £137,927.00 | 24 Flats |

