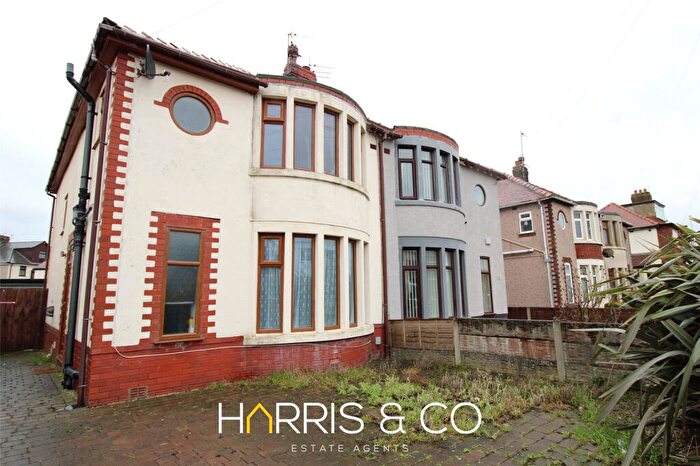
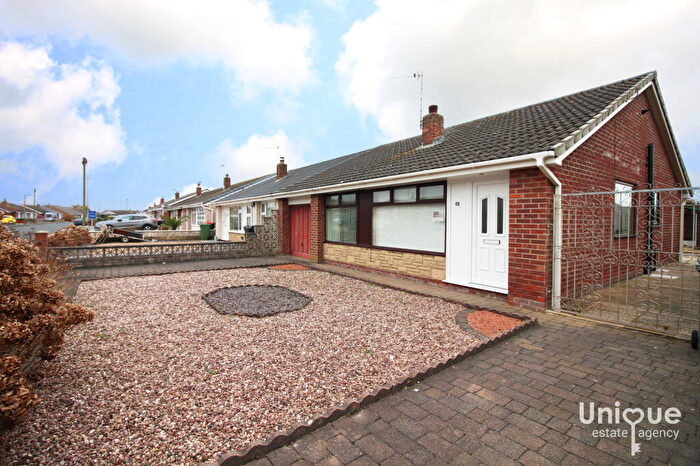
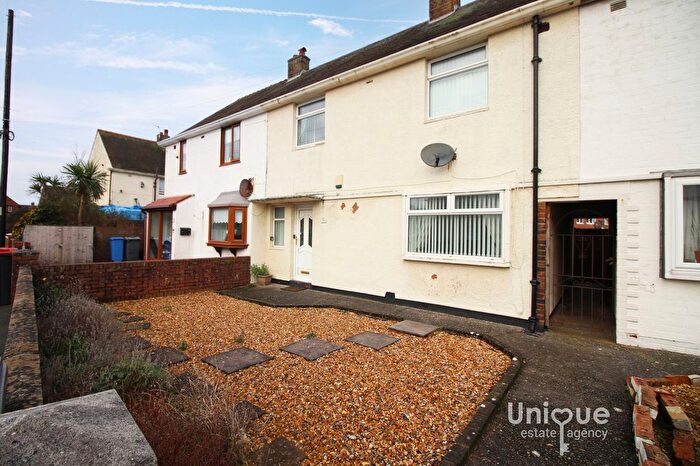
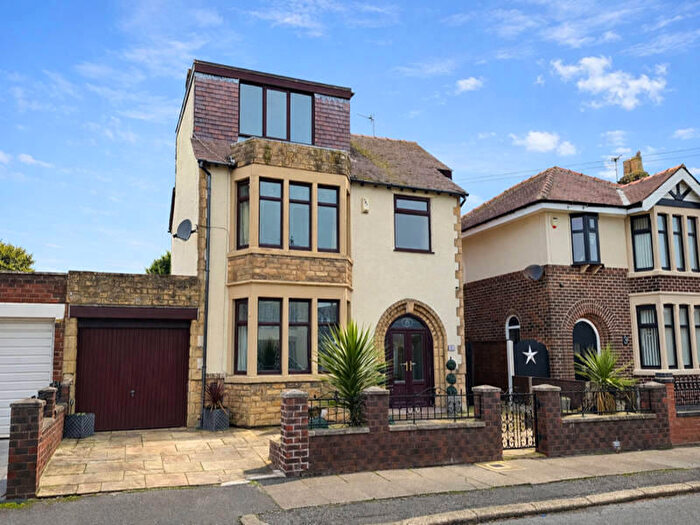
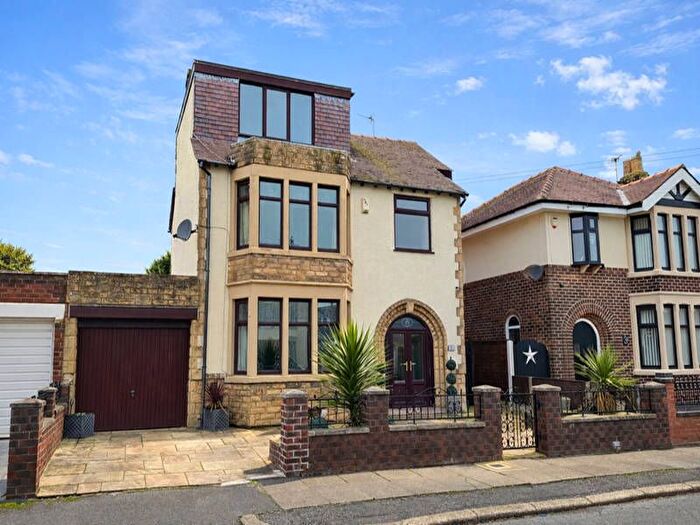
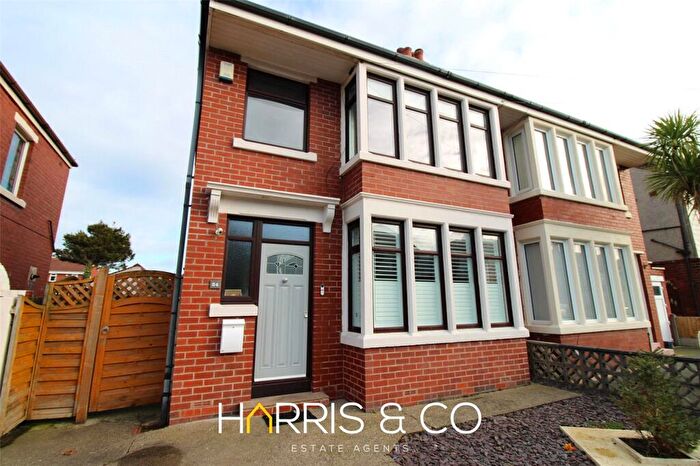
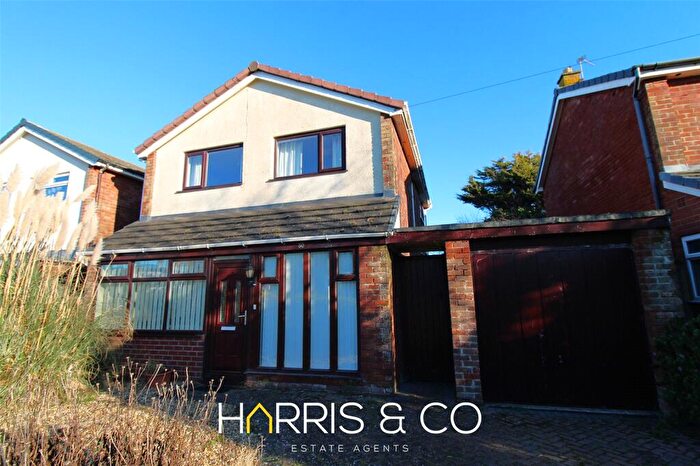
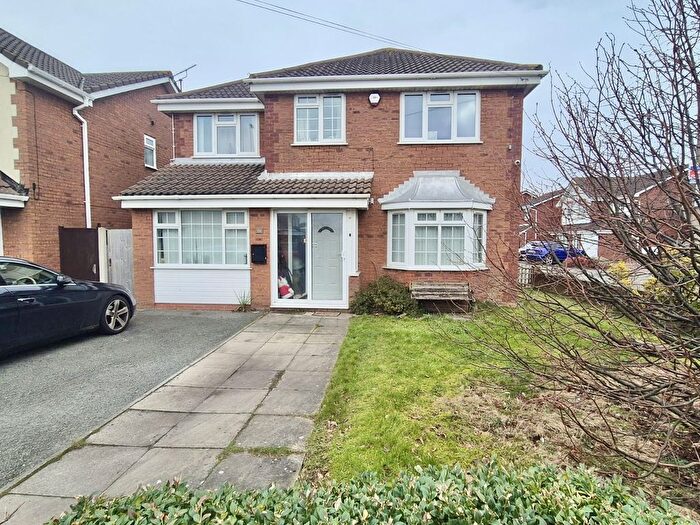
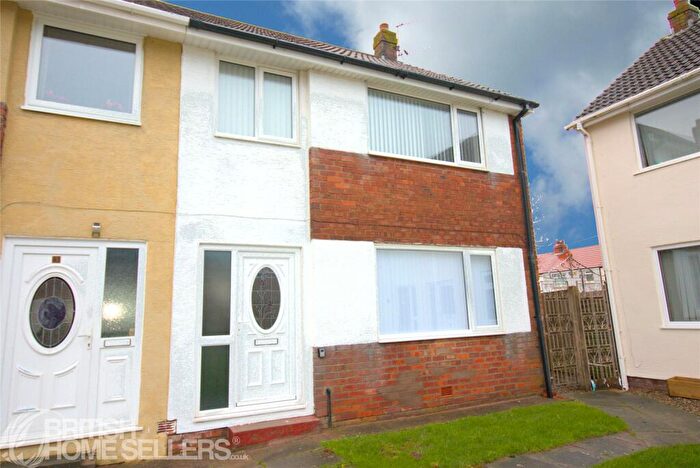
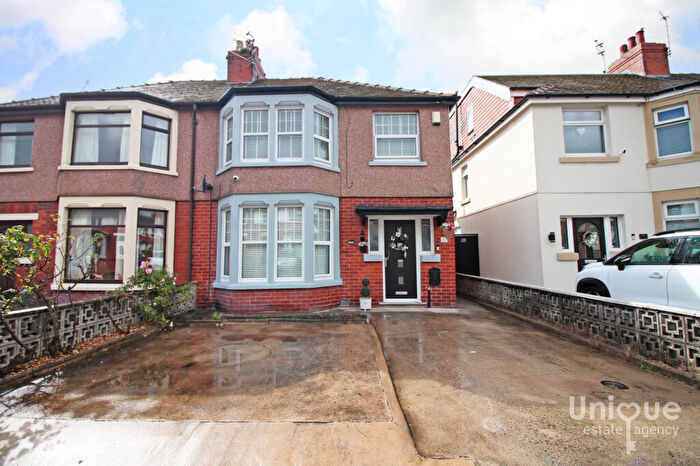
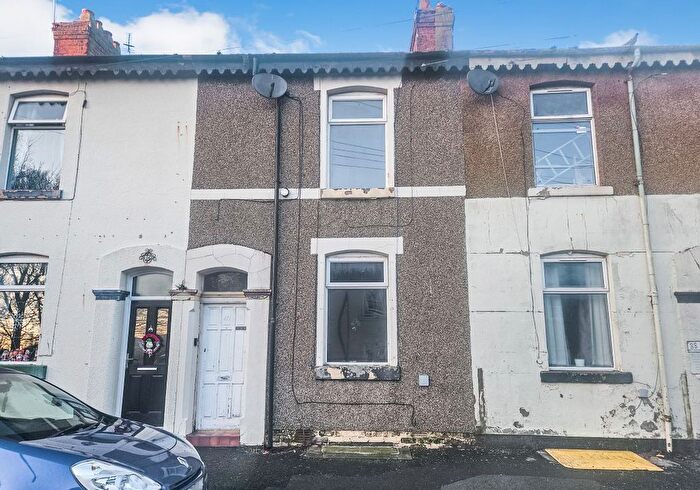
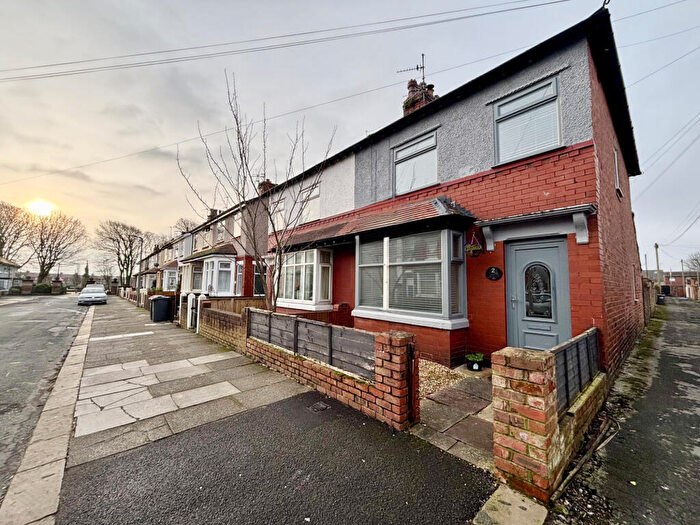
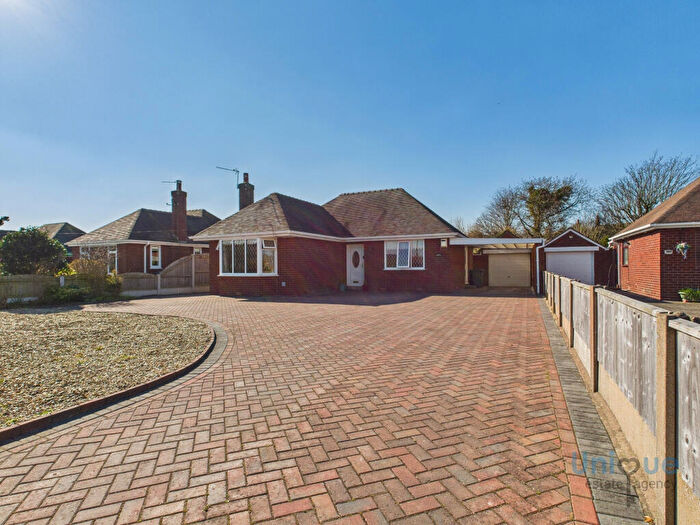
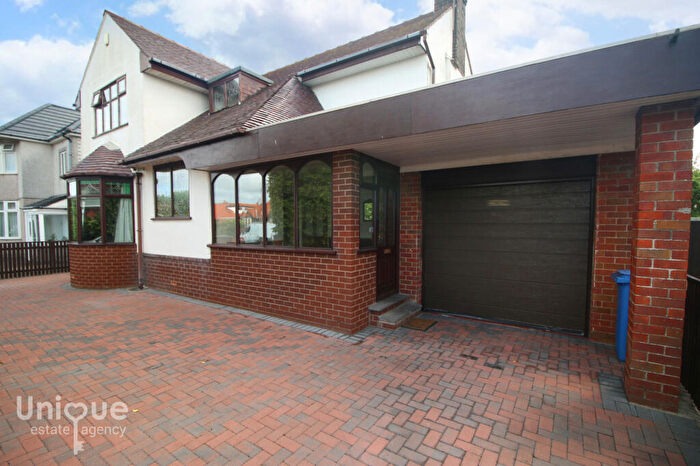
Houses for sale & to rent in Park, Fleetwood
House Prices in Park
Properties in Park have an average house price of £153,615.00 and had 139 Property Transactions within the last 3 years¹.
Park is an area in Fleetwood, Lancashire with 1,878 households², where the most expensive property was sold for £650,000.00.
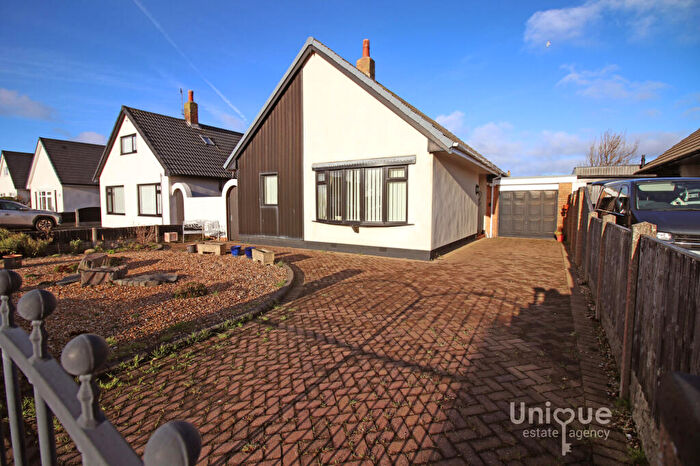
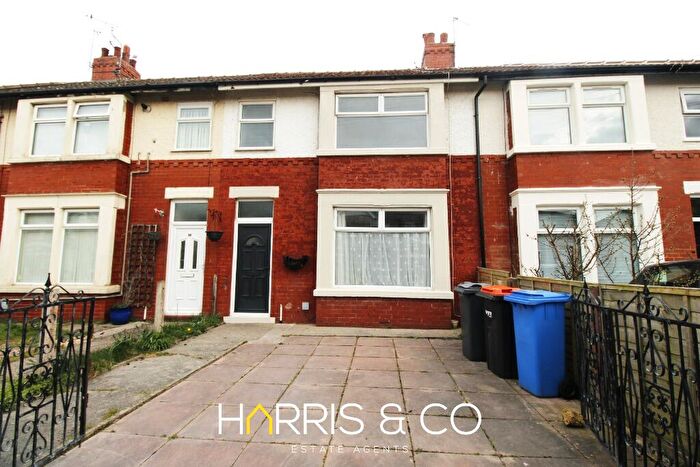
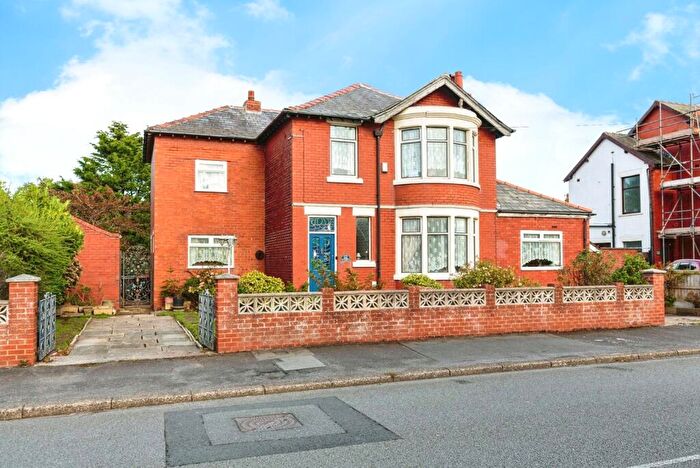
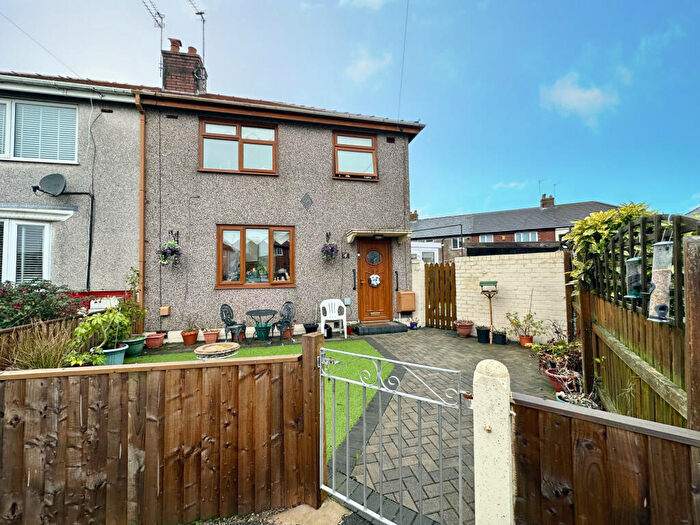
Properties for sale in Park
Roads and Postcodes in Park
Navigate through our locations to find the location of your next house in Park, Fleetwood for sale or to rent.
| Streets | Postcodes |
|---|---|
| Ainsdale Avenue | FY7 8HT |
| Armitstead Court | FY7 7FA |
| Armitstead Way | FY7 7GE |
| Ayr Court | FY7 8HU |
| Birkdale Avenue | FY7 8HX |
| Brentwood | FY7 8HP |
| Broadwater Avenue | FY7 7PP |
| Broadwater Gardens | FY7 7PD |
| Broadway | FY7 8AZ FY7 8HF FY7 8JN |
| Brook Street | FY7 7PZ |
| Broomfield Road | FY7 7LS |
| Cedar Avenue | FY7 7PU |
| Copse Road | FY7 7FY |
| Crookall Close | FY7 7FB |
| Edmondsen Place | FY7 7GD |
| Fairfield Court | FY7 7LR |
| Fairhaven Avenue | FY7 8HR |
| Flakefleet Avenue | FY7 7PH |
| Fleetwood Road | FY7 8AS FY7 8AT FY7 8BD FY7 8HL FY7 8HN FY7 8JZ FY7 8LA |
| Formby Avenue | FY7 8HZ |
| Forshaw Close | FY7 7FD |
| Greenfield Road | FY7 7LT |
| Gregson Drive | FY7 7GB |
| Hatfield Avenue | FY7 7DZ FY7 7DT |
| Hatfield Mews | FY7 7QE |
| Hatfield Walk | FY7 7QF |
| Hawthorne Avenue | FY7 7PY |
| Hazel Avenue | FY7 7PS |
| Hazeldene Road | FY7 7NN |
| Heathfield Road | FY7 7LY FY7 7NJ FY7 7NL |
| Homestead Drive | FY7 7NF |
| Homestead Way | FY7 7NG |
| Langwood | FY7 8HW |
| Langwood Mews | FY7 8GT FY7 8GX |
| Larkholme Avenue | FY7 7PN FY7 7PW |
| Larkholme Lane | FY7 7PJ FY7 8AU |
| Laurel Avenue | FY7 7PT |
| Leyburn Avenue | FY7 8HG |
| Lindel Road | FY7 7NU |
| Lingfield Road | FY7 7NP |
| Maple Avenue | FY7 7PR |
| Mariners Close | FY7 7BF FY7 7BR |
| Meadow Avenue | FY7 7PL |
| Melbourne Avenue | FY7 8AY |
| Noblett Court | FY7 7FE |
| Northfleet Avenue | FY7 7ND |
| Orchard Drive | FY7 7NQ |
| Penrhos Avenue | FY7 8AR |
| Radcliffe Road | FY7 7NH FY7 7NR FY7 7NX |
| Rossall Lane | FY7 8JP FY7 8JR |
| South Strand | FY7 8BB FY7 8RL |
| Southfleet Avenue | FY7 7PG |
| Southfleet Place | FY7 7PQ |
| Sunningdale Avenue | FY7 8HS |
| The Crescent | FY7 8AX |
| Wensley Avenue | FY7 8HQ |
| Wentworth Avenue | FY7 8HY |
| Westfield Avenue | FY7 7NA FY7 7NB |
| Westhead Walk | FY7 7GA |
| Whinfield Avenue | FY7 7LZ FY7 7NE |
| Wingrove Road | FY7 7NW |
| Witton Avenue | FY7 8HH |
| Witton Grove | FY7 8HJ |
| Wood Street | FY7 7PX |
| FY7 8GU |
Transport near Park
-
Poulton-Le-Fylde Station
-
Layton Station
-
Blackpool North Station
-
Blackpool South Station
-
Blackpool Pleasure Beach Station
-
Squires Gate Station
-
Heysham Port Station
- FAQ
- Price Paid By Year
- Property Type Price
Frequently asked questions about Park
What is the average price for a property for sale in Park?
The average price for a property for sale in Park is £153,615. This amount is 9% higher than the average price in Fleetwood. There are 1,250 property listings for sale in Park.
What streets have the most expensive properties for sale in Park?
The streets with the most expensive properties for sale in Park are South Strand at an average of £337,977, Ainsdale Avenue at an average of £315,000 and Fairhaven Avenue at an average of £290,000.
What streets have the most affordable properties for sale in Park?
The streets with the most affordable properties for sale in Park are Lingfield Road at an average of £66,000, Greenfield Road at an average of £70,000 and Hazeldene Road at an average of £77,000.
Which train stations are available in or near Park?
Some of the train stations available in or near Park are Poulton-Le-Fylde, Layton and Blackpool North.
Property Price Paid in Park by Year
The average sold property price by year was:
| Year | Average Sold Price | Price Change |
Sold Properties
|
|---|---|---|---|
| 2025 | £165,806 | 13% |
45 Properties |
| 2024 | £144,758 | -5% |
54 Properties |
| 2023 | £151,858 | -9% |
40 Properties |
| 2022 | £165,435 | 12% |
53 Properties |
| 2021 | £145,585 | 10% |
66 Properties |
| 2020 | £130,839 | 2% |
44 Properties |
| 2019 | £127,623 | 1% |
55 Properties |
| 2018 | £126,030 | 5% |
55 Properties |
| 2017 | £120,212 | -6% |
49 Properties |
| 2016 | £127,435 | 1% |
45 Properties |
| 2015 | £126,393 | 26% |
47 Properties |
| 2014 | £94,152 | -7% |
47 Properties |
| 2013 | £100,408 | 10% |
36 Properties |
| 2012 | £90,840 | -27% |
26 Properties |
| 2011 | £115,798 | -3% |
31 Properties |
| 2010 | £119,846 | 6% |
26 Properties |
| 2009 | £112,208 | -6% |
24 Properties |
| 2008 | £118,401 | -4% |
31 Properties |
| 2007 | £122,585 | 5% |
78 Properties |
| 2006 | £116,401 | -5% |
63 Properties |
| 2005 | £122,702 | 14% |
43 Properties |
| 2004 | £105,890 | 10% |
63 Properties |
| 2003 | £95,001 | 36% |
54 Properties |
| 2002 | £61,031 | 6% |
87 Properties |
| 2001 | £57,429 | 2% |
73 Properties |
| 2000 | £56,307 | -4% |
56 Properties |
| 1999 | £58,585 | 24% |
71 Properties |
| 1998 | £44,664 | -8% |
68 Properties |
| 1997 | £48,159 | -1% |
55 Properties |
| 1996 | £48,595 | 2% |
50 Properties |
| 1995 | £47,690 | - |
30 Properties |
Property Price per Property Type in Park
Here you can find historic sold price data in order to help with your property search.
The average Property Paid Price for specific property types in the last three years are:
| Property Type | Average Sold Price | Sold Properties |
|---|---|---|
| Semi Detached House | £155,218.00 | 28 Semi Detached Houses |
| Detached House | £294,671.00 | 26 Detached Houses |
| Terraced House | £110,417.00 | 84 Terraced Houses |
| Flat | £70,000.00 | 1 Flat |

