
Houses for sale in Marsh, Lancaster
House Prices in Marsh
Properties in Marsh have an average house price of £222k and had 59 Property Transactions within the last 3 years¹.
Marsh is an area in Lancaster, Lancashire with 427 households², where the most expensive property was sold for £435k.
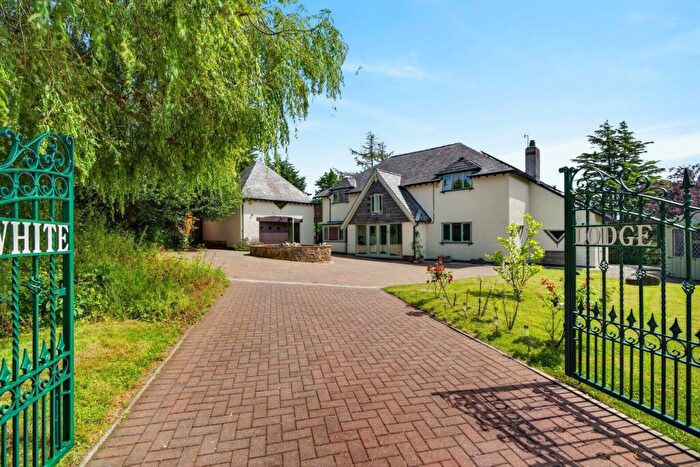
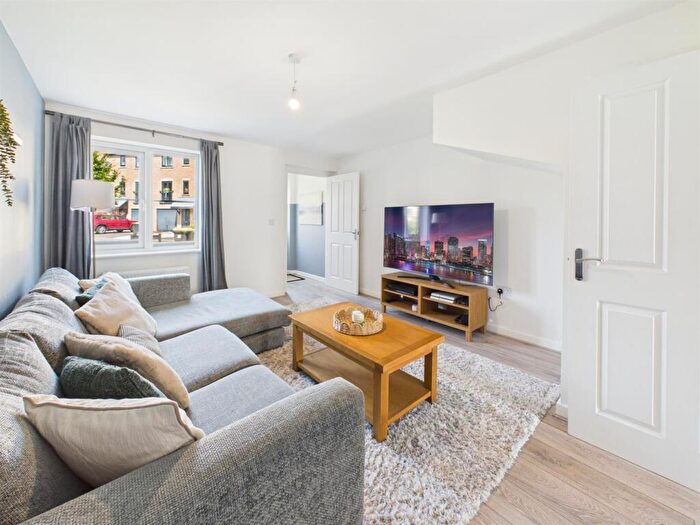
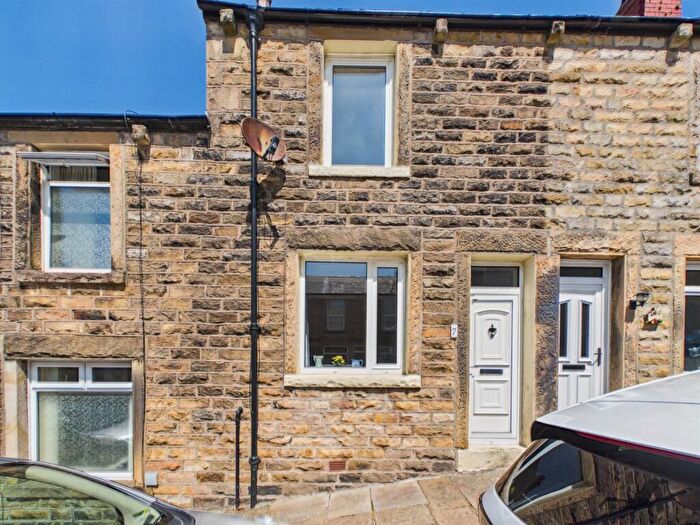
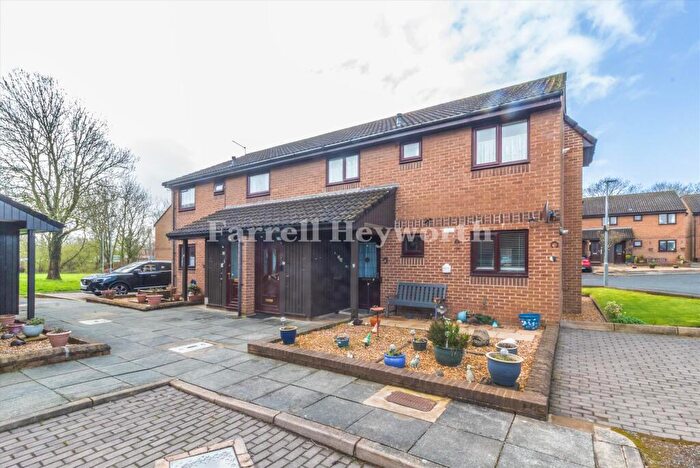
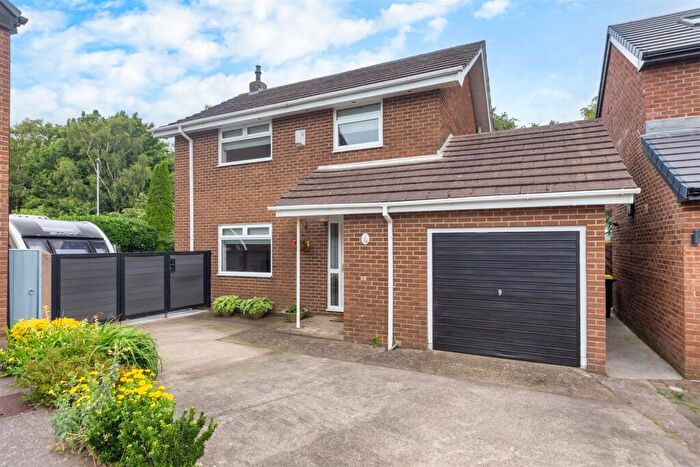
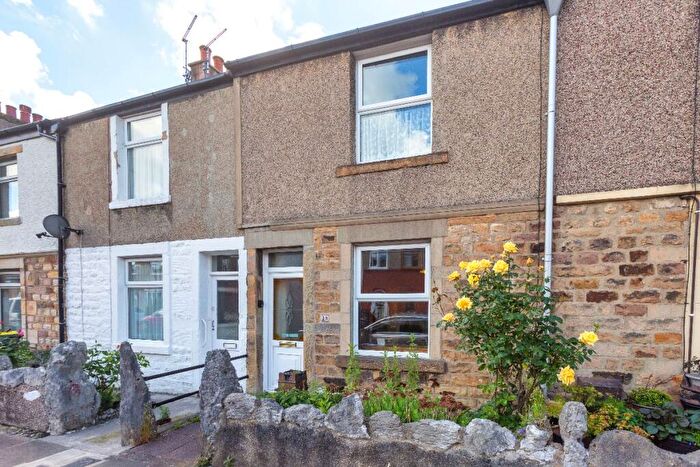
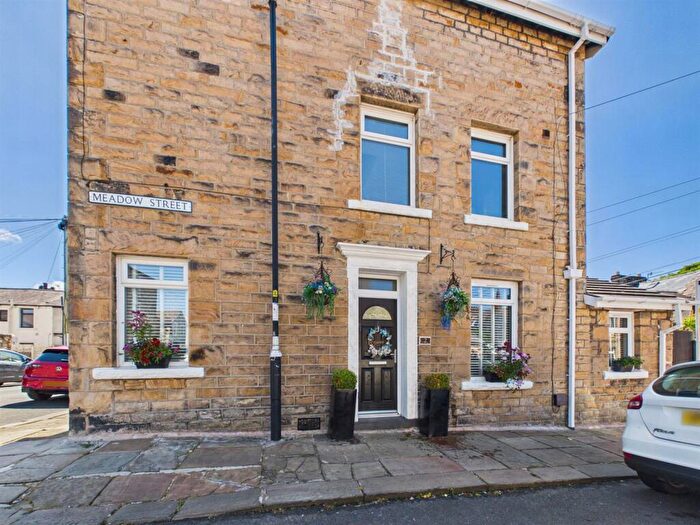
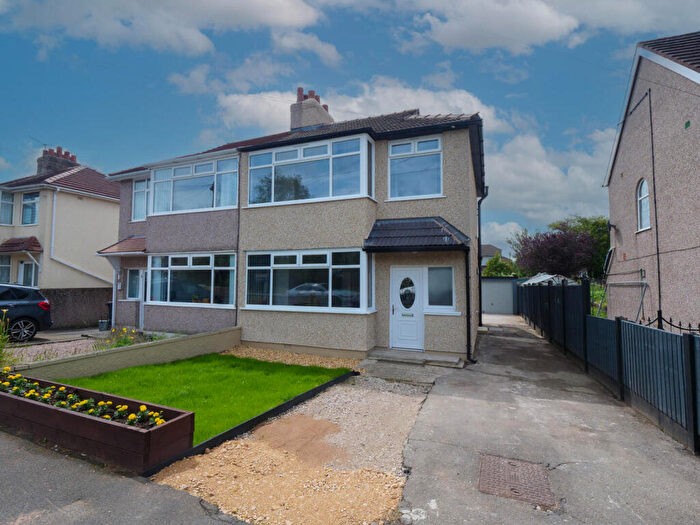
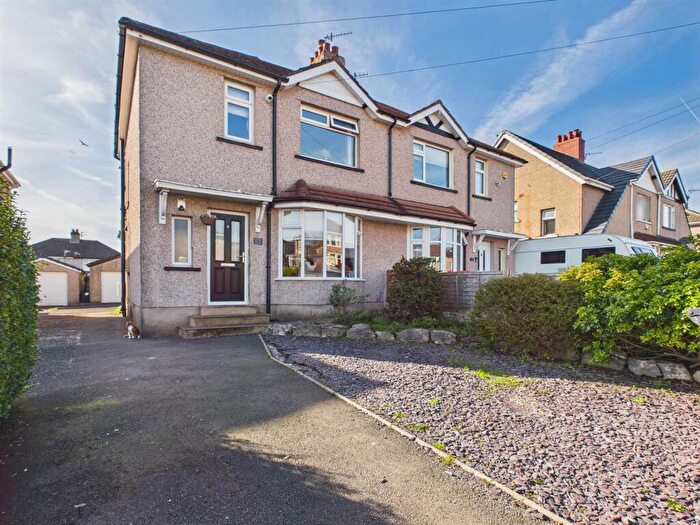
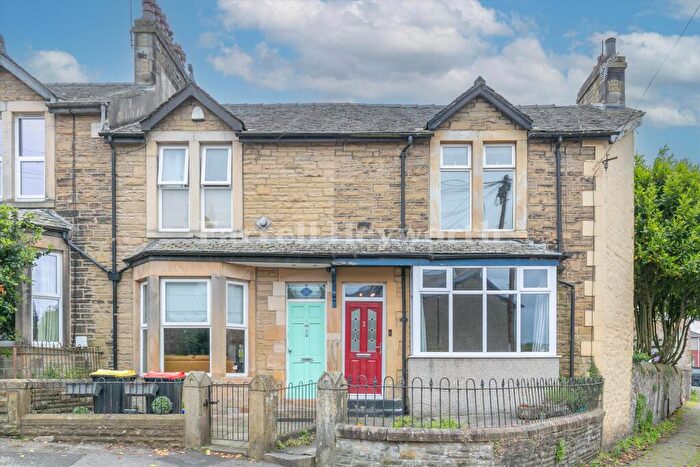
Properties for sale in Marsh

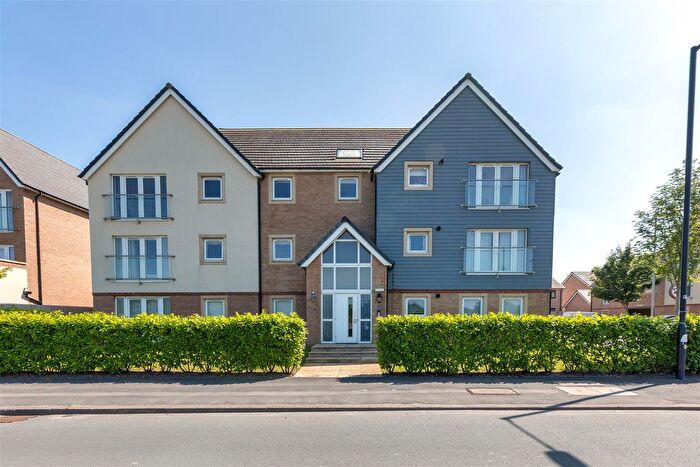
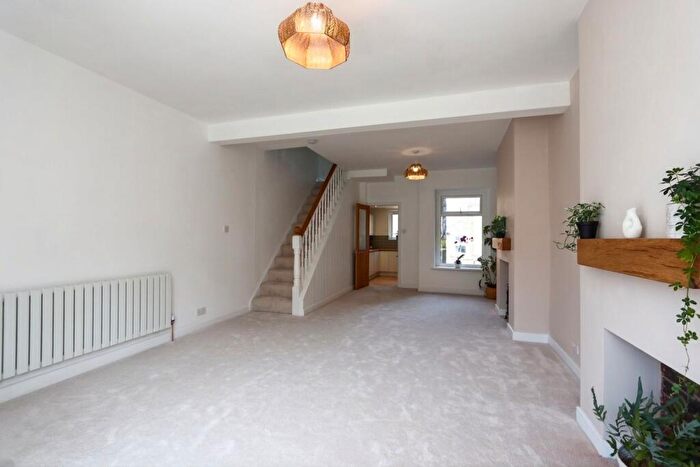
![]()
If you are looking to sell your house, let it out, or receive a property valuation, an expert can help you.
Click the button below to get started.

Roads and Postcodes in Marsh
Navigate through our locations to find the location of your next house in Marsh, Lancaster for sale or to rent.
| Streets | Postcodes |
|---|---|
| Abram Close | LA1 5WB |
| Alder Court | LA1 5SY |
| Alder Grove | LA1 5SD |
| Booth Gardens | LA1 5WE |
| Chestnut Grove | LA1 5RN |
| Cypress Close | LA1 5TR LA1 5TX |
| Dawson Court | LA1 5JZ |
| Farm Lane | LA1 5WL |
| Fife Street | LA1 5TT LA1 5TW |
| Ford Street | LA1 5RA |
| Gold Lane | LA1 5TY |
| Hasgill Court | LA1 5SE |
| Holly Walk | LA1 5SH |
| Hornbeam Road | LA1 5TQ |
| Ley Court | LA1 5QG |
| Lune Industrial Estate | LA1 5FT LA1 5QP |
| Lune Road | LA1 5QT |
| Mariner Way | LA1 5TS |
| Nairn Road | LA1 5UY |
| New Quay Lane | LA1 5QS LA1 5SA |
| New Quay Road | LA1 5LF |
| Porritt Avenue | LA1 5NZ |
| Ropewalk | LA1 5WF |
| St Georges Quay | LA1 5JT LA1 5JU |
| St Thomas More Walk | LA1 5PT |
| The Reeds | LA1 5QQ |
| Timber Grove | LA1 5SZ |
| West Road | LA1 5QE |
| William Priestley Park | LA1 5WD |
| Willow Lane | LA1 5NA |
Property price trends in Marsh
According to the latest Land Registry data, the average home in Marsh sold for £205,000 in 2026. That figure comes from 399 sales logged over the past 12 years.
Prices have fallen back over the last three years. Compared with 2023, when the typical sale came in around £219,800, that's a fall of roughly 6.7%.
Looking back five years, average prices are up about 5.6% since 2021, a gain of around £10,821 in cash terms.
Zoom out to the past decade for the fuller picture. Back in 2016, homes here averaged £248,709, so the typical sold price has fallen about 17.6% since then, around 1.9% a year lower.
Frequently asked questions about Marsh
What is the average price for a property for sale in Marsh?
The average price for a property for sale in Marsh is £221,844. This amount is 3% lower than the average price in Lancaster. There are 865 property listings for sale in Marsh.
What streets have the most expensive properties for sale in Marsh?
The streets with the most expensive properties for sale in Marsh are William Priestley Park at an average of £277,500, Mariner Way at an average of £260,892 and Nairn Road at an average of £252,071.
What streets have the most affordable properties for sale in Marsh?
The streets with the most affordable properties for sale in Marsh are St Georges Quay at an average of £157,125, Fife Street at an average of £204,727 and Abram Close at an average of £205,718.
Which train stations are available in or near Marsh?
Some of the train stations available in or near Marsh are Lancaster, Bare Lane and Morecambe.
Property Price Paid in Marsh by Year
The average sold property price by year was:
| Year | Average Sold Price | Price Change |
Sold Properties
|
|---|---|---|---|
| 2026 | £205,000 | -16% |
1 Property |
| 2025 | £237,200 | 10% |
15 Properties |
| 2024 | £214,341 | -3% |
23 Properties |
| 2023 | £219,800 | -15% |
20 Properties |
| 2022 | £253,601 | 23% |
18 Properties |
| 2021 | £194,179 | 18% |
34 Properties |
| 2020 | £159,552 | -13% |
53 Properties |
| 2019 | £180,405 | 6% |
50 Properties |
| 2018 | £169,405 | -24% |
92 Properties |
| 2017 | £209,477 | -19% |
43 Properties |
Property Price per Property Type in Marsh
Here you can find historic sold price data in order to help with your property search.
The average Property Paid Price for specific property types in the last three years are:
| Property Type | Average Sold Price | Sold Properties |
|---|---|---|
| Semi Detached House | £224,672.00 | 18 Semi Detached Houses |
| Terraced House | £195,822.00 | 24 Terraced Houses |
| Flat | £160,500.00 | 7 Flats |
| Detached House | £322,150.00 | 10 Detached Houses |
