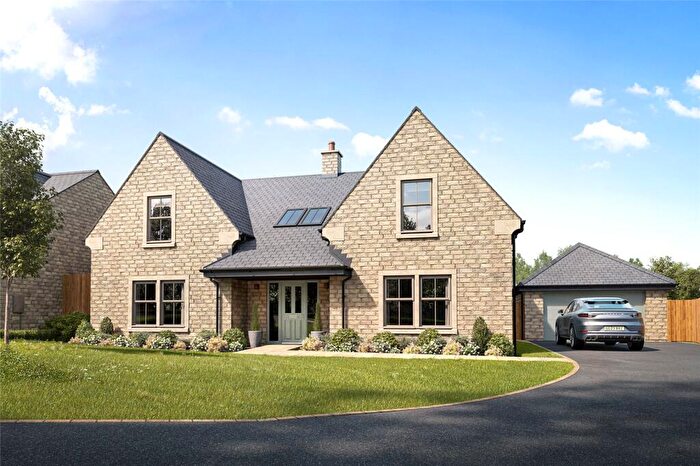
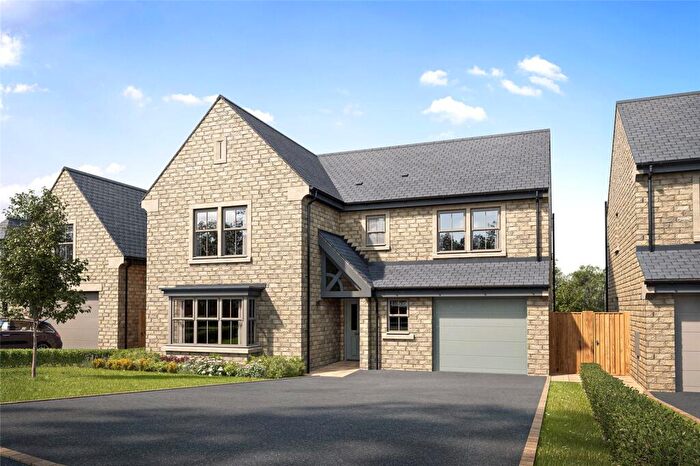
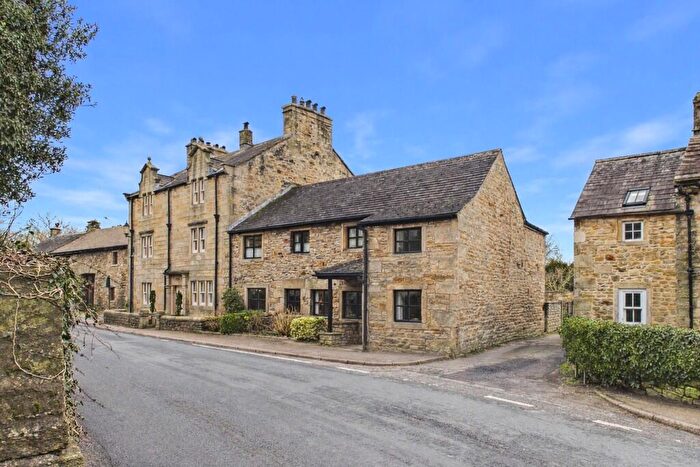
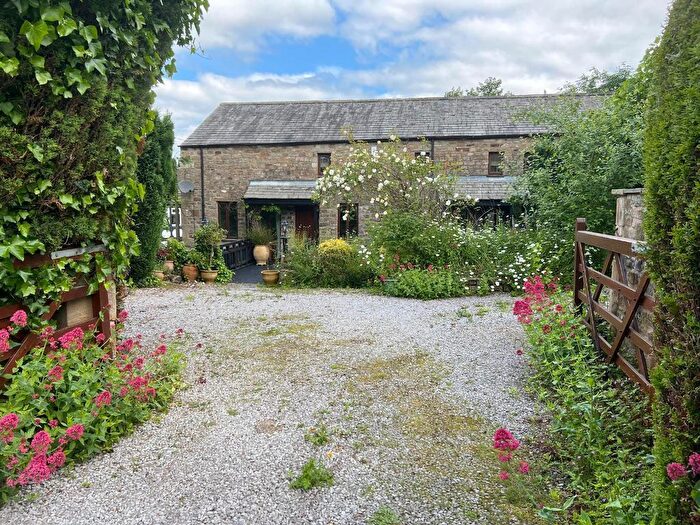
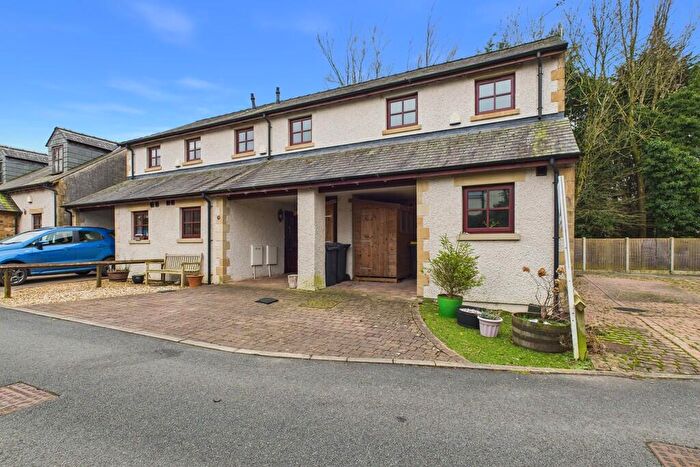
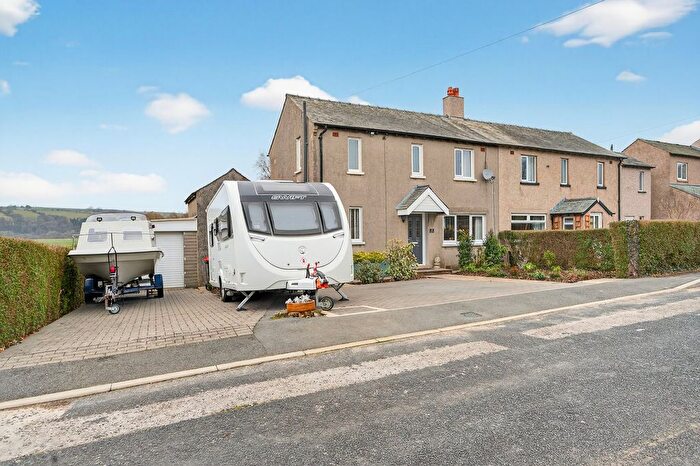
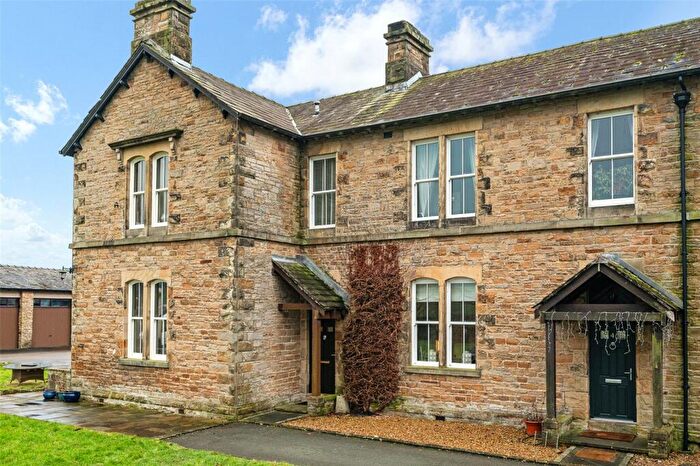
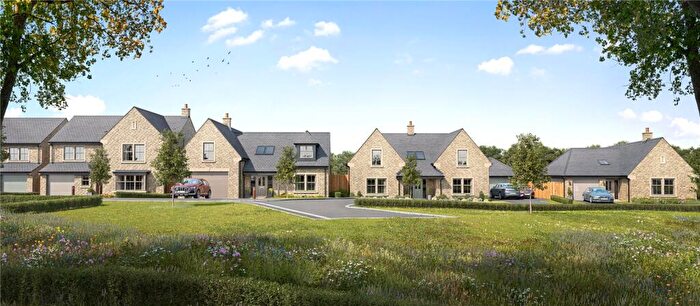
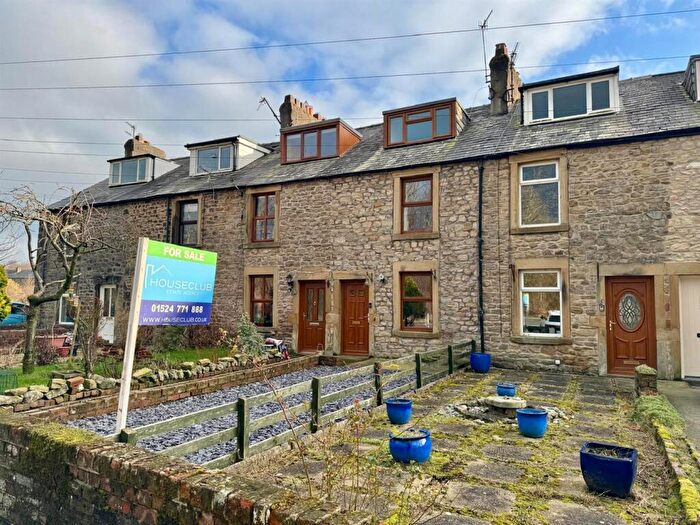
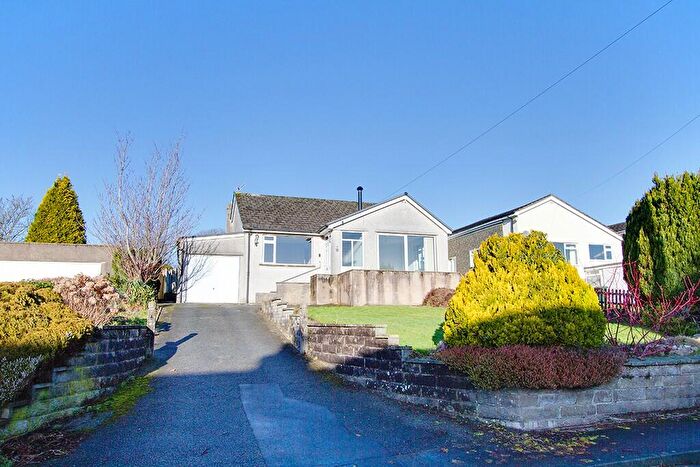
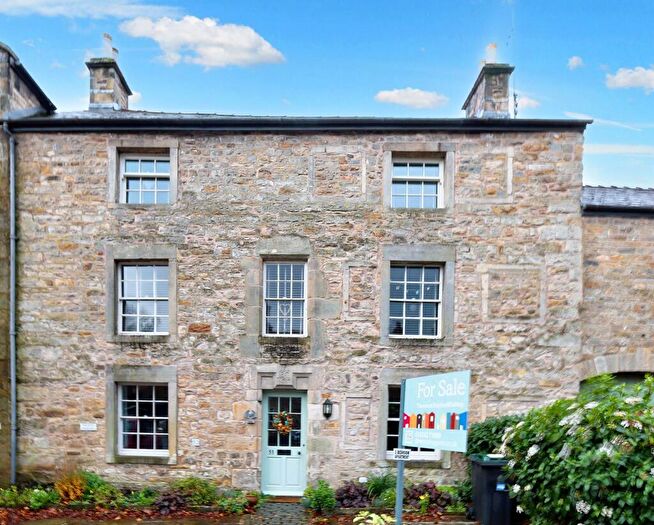
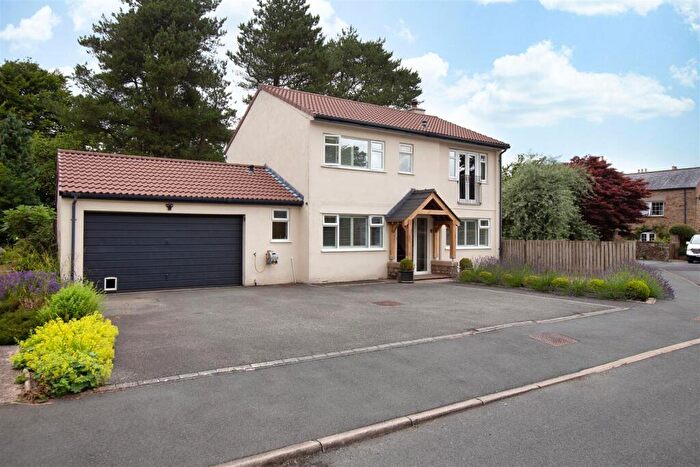
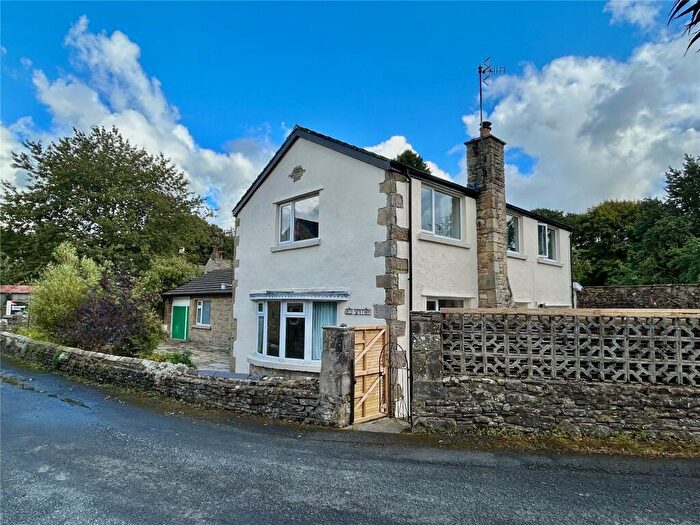
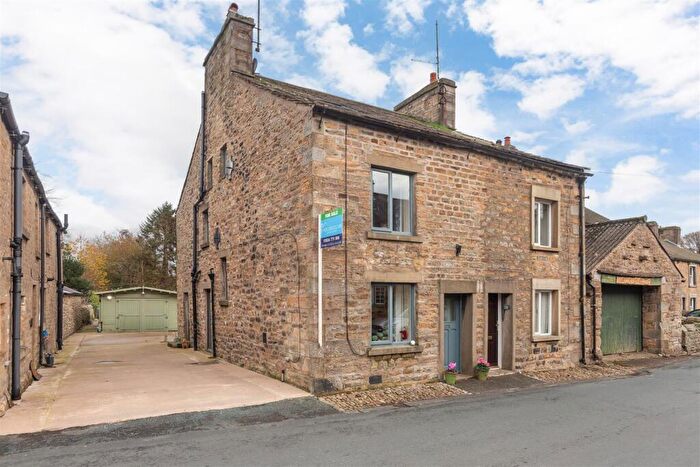
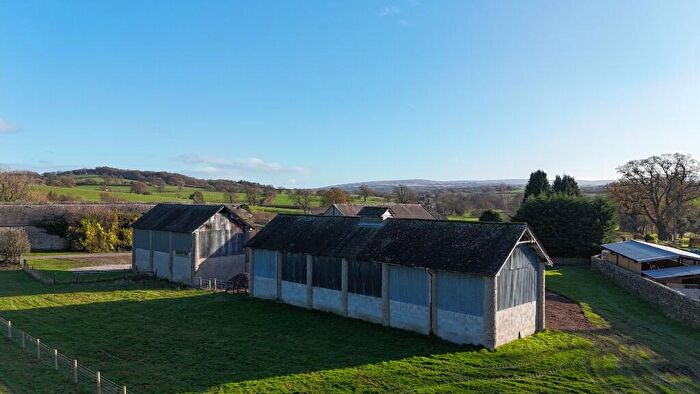
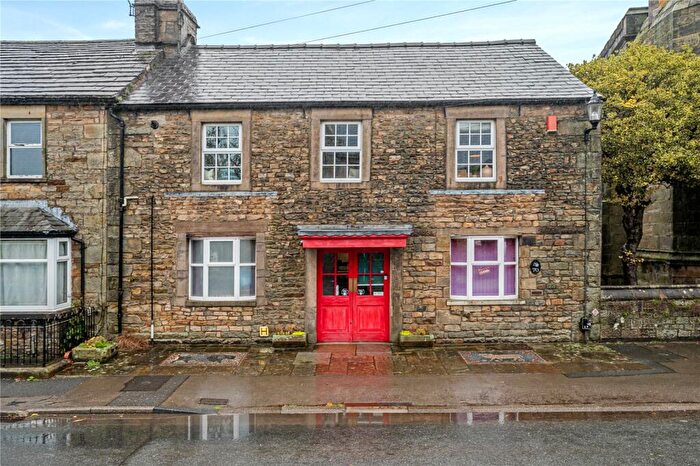
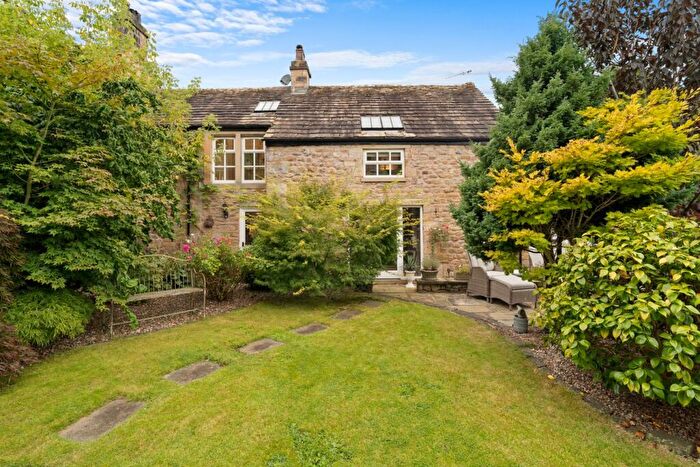
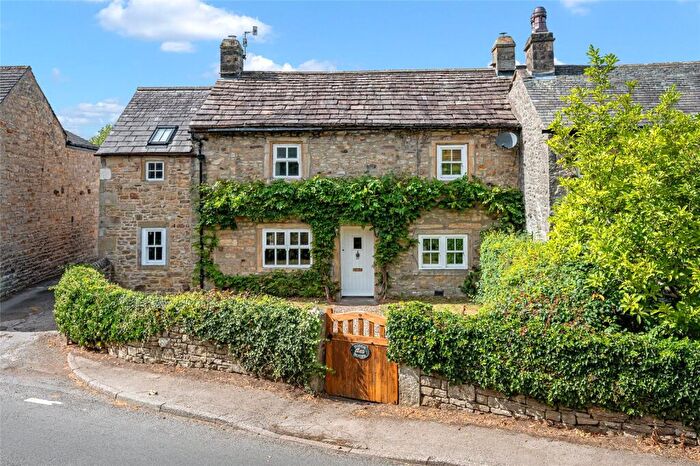
Houses for sale & to rent in Upper Lune Valley, Lancaster
House Prices in Upper Lune Valley
Properties in Upper Lune Valley have an average house price of £372,945.00 and had 41 Property Transactions within the last 3 years¹.
Upper Lune Valley is an area in Lancaster, Lancashire with 463 households², where the most expensive property was sold for £910,000.00.
Properties for sale in Upper Lune Valley
Roads and Postcodes in Upper Lune Valley
Navigate through our locations to find the location of your next house in Upper Lune Valley, Lancaster for sale or to rent.
| Streets | Postcodes |
|---|---|
| Back Lane | LA2 8NY |
| Bentham Road | LA2 8JX |
| Castle Park | LA2 8SB |
| Deer Park Lane | LA2 8LF |
| Farleton Crossing | LA2 9LE |
| Fleet Lane | LA2 8LN |
| Hornby Bank | LA2 8LQ |
| Hornby Hall Close | LA2 8LB |
| Ingleborough View | LA2 8JN |
| Lancaster Road | LA2 8JS |
| Lodge Lane | LA2 8FA LA2 8NS |
| Lunesdale Court | LA2 8JW |
| Main Street | LA2 8JR LA2 8JT LA2 8JY |
| Melling Road | LA2 8LG LA2 8LH |
| Montbegon | LA2 8JZ |
| Monteagle Drive | LA2 8LD |
| Monteagle Square | LA2 8LZ |
| Moor Lane | LA2 8RQ |
| Nether View | LA2 8NP |
| Post Horse Lane | LA2 8RH |
| Priory Lane | LA2 8LE |
| Royal Oak Meadow | LA2 8LJ |
| Spout Lane | LA2 8NX |
| Stanley Drive | LA2 8NA |
| Station Court | LA2 8SD |
| Station Road | LA2 8JP |
| Station Way | LA2 8SE |
| Strands Farm Court | LA2 8JF |
| Strands Farm Lane | LA2 8AX |
| The Meadows | LA2 8BF |
| LA2 8LP LA2 8LS LA2 8LW LA2 8LX LA2 8NU LA2 8NW LA2 8PA LA2 9LF LA2 9LQ LA2 8JU LA2 8LA LA2 8LL LA2 8LR LA2 8LY LA2 8NR LA2 8NT LA2 9LG LA2 9LH |
Transport near Upper Lune Valley
-
Wennington Station
-
Bentham Station
-
Carnforth Station
-
Silverdale Station
-
Lancaster Station
-
Bare Lane Station
-
Clapham (North Yorkshire) Station
- FAQ
- Price Paid By Year
- Property Type Price
Frequently asked questions about Upper Lune Valley
What is the average price for a property for sale in Upper Lune Valley?
The average price for a property for sale in Upper Lune Valley is £372,945. This amount is 63% higher than the average price in Lancaster. There are 161 property listings for sale in Upper Lune Valley.
What streets have the most expensive properties for sale in Upper Lune Valley?
The streets with the most expensive properties for sale in Upper Lune Valley are Deer Park Lane at an average of £635,000, Hornby Hall Close at an average of £510,000 and Stanley Drive at an average of £367,500.
What streets have the most affordable properties for sale in Upper Lune Valley?
The streets with the most affordable properties for sale in Upper Lune Valley are Strands Farm Lane at an average of £111,500, Monteagle Square at an average of £253,000 and Monteagle Drive at an average of £269,000.
Which train stations are available in or near Upper Lune Valley?
Some of the train stations available in or near Upper Lune Valley are Wennington, Bentham and Carnforth.
Property Price Paid in Upper Lune Valley by Year
The average sold property price by year was:
| Year | Average Sold Price | Price Change |
Sold Properties
|
|---|---|---|---|
| 2025 | £385,250 | 8% |
6 Properties |
| 2024 | £354,648 | -10% |
19 Properties |
| 2023 | £390,059 | 14% |
16 Properties |
| 2022 | £336,955 | -3% |
17 Properties |
| 2021 | £346,634 | 18% |
36 Properties |
| 2020 | £285,080 | -3% |
19 Properties |
| 2019 | £292,652 | -5% |
23 Properties |
| 2018 | £306,813 | -19% |
11 Properties |
| 2017 | £366,388 | 27% |
18 Properties |
| 2016 | £268,611 | -1% |
13 Properties |
| 2015 | £271,346 | 4% |
13 Properties |
| 2014 | £259,735 | 8% |
20 Properties |
| 2013 | £240,226 | 41% |
13 Properties |
| 2012 | £142,125 | -76% |
4 Properties |
| 2011 | £250,576 | -34% |
13 Properties |
| 2010 | £335,625 | 21% |
8 Properties |
| 2009 | £263,777 | -15% |
9 Properties |
| 2008 | £302,142 | 7% |
7 Properties |
| 2007 | £280,934 | 9% |
16 Properties |
| 2006 | £255,000 | 5% |
11 Properties |
| 2005 | £242,333 | 15% |
15 Properties |
| 2004 | £206,901 | 6% |
31 Properties |
| 2003 | £193,596 | 38% |
25 Properties |
| 2002 | £119,356 | 14% |
16 Properties |
| 2001 | £102,096 | -14% |
15 Properties |
| 2000 | £116,093 | -9% |
24 Properties |
| 1999 | £127,000 | 18% |
11 Properties |
| 1998 | £104,535 | -5% |
7 Properties |
| 1997 | £110,001 | 22% |
15 Properties |
| 1996 | £86,181 | 1% |
11 Properties |
| 1995 | £85,662 | - |
12 Properties |
Property Price per Property Type in Upper Lune Valley
Here you can find historic sold price data in order to help with your property search.
The average Property Paid Price for specific property types in the last three years are:
| Property Type | Average Sold Price | Sold Properties |
|---|---|---|
| Semi Detached House | £268,272.00 | 9 Semi Detached Houses |
| Detached House | £501,859.00 | 19 Detached Houses |
| Terraced House | £257,000.00 | 13 Terraced Houses |

