Houses for sale & to rent in Blacko And Higherford, Nelson
House Prices in Blacko And Higherford
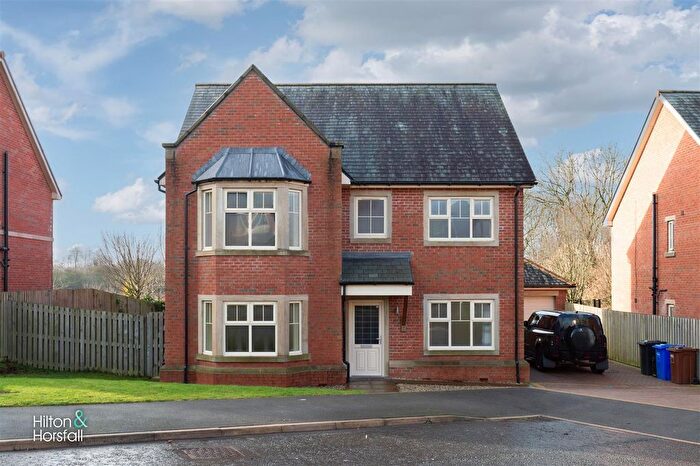
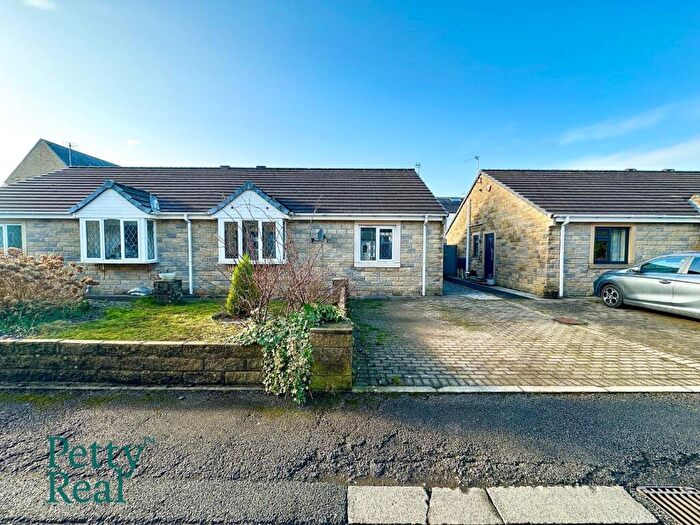
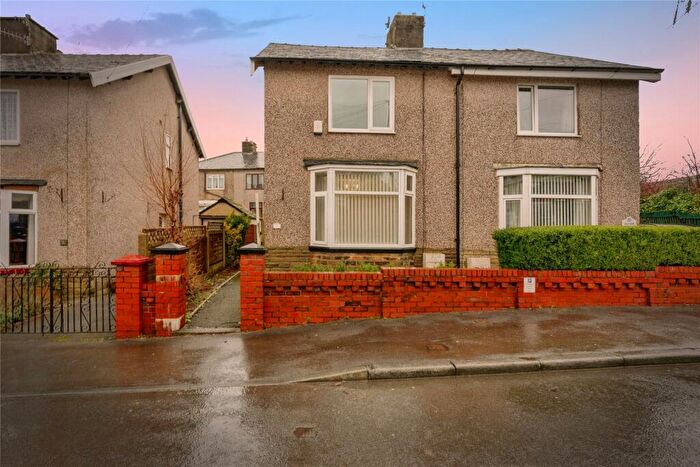
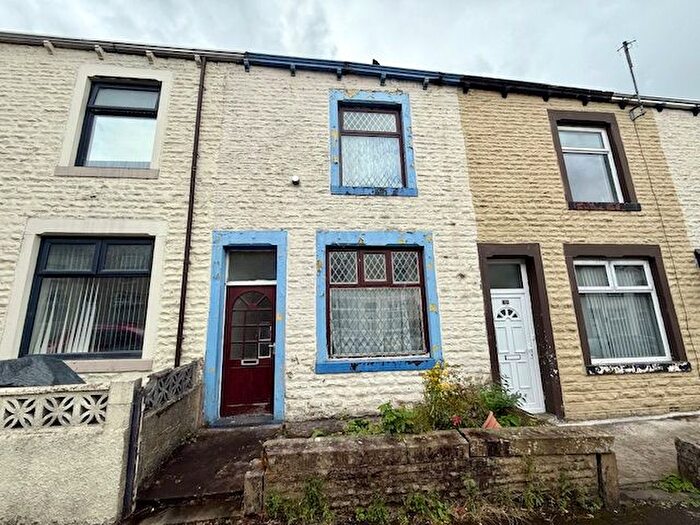
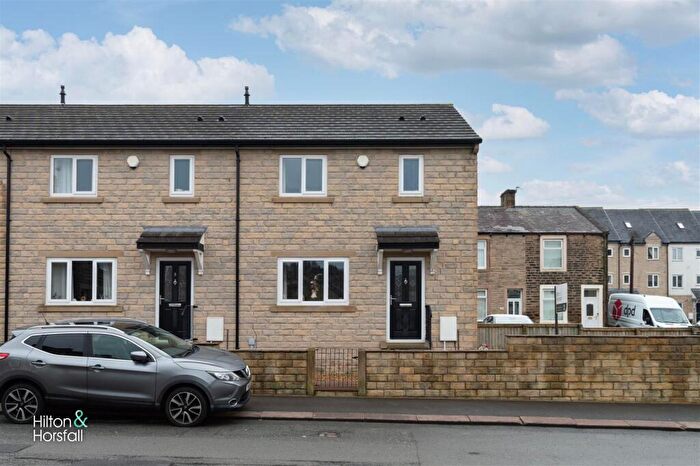
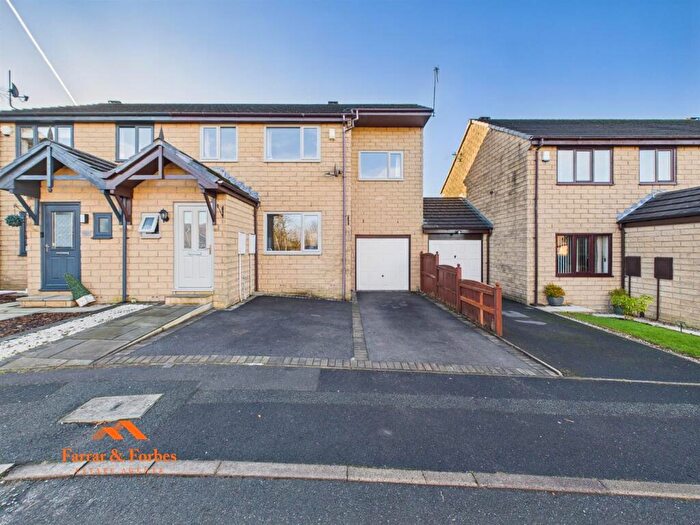
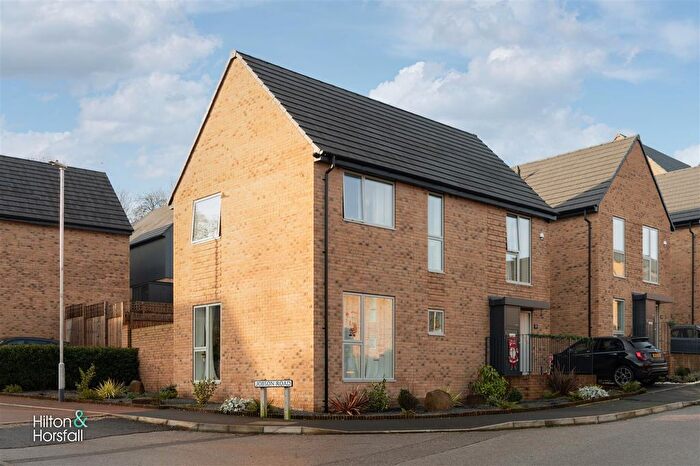
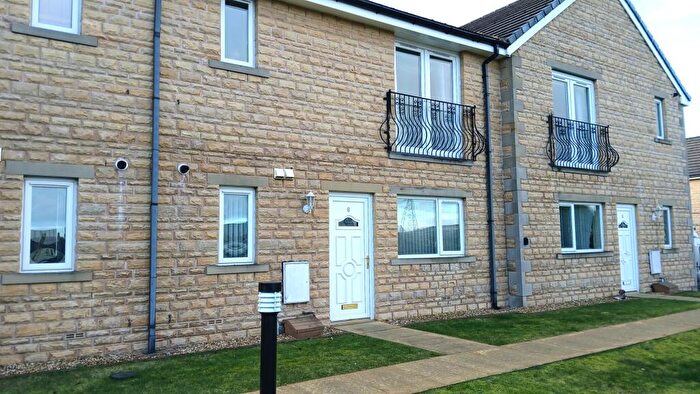
Properties in Blacko And Higherford have an average house price of £362,687.00 and had 68 Property Transactions within the last 3 years¹.
Blacko And Higherford is an area in Nelson, Lancashire with 743 households², where the most expensive property was sold for £1,700,000.00.
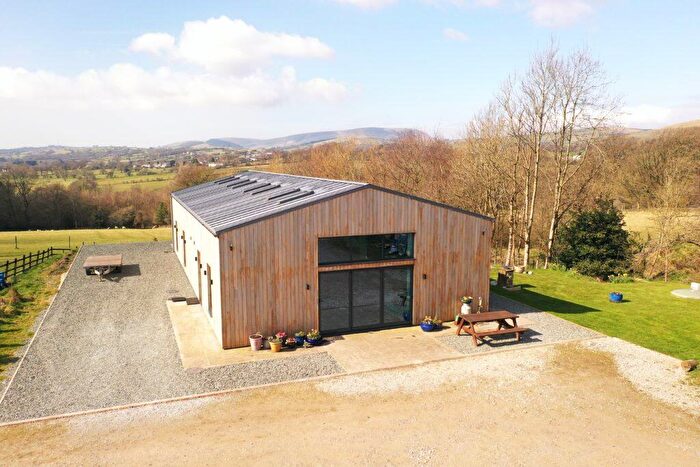
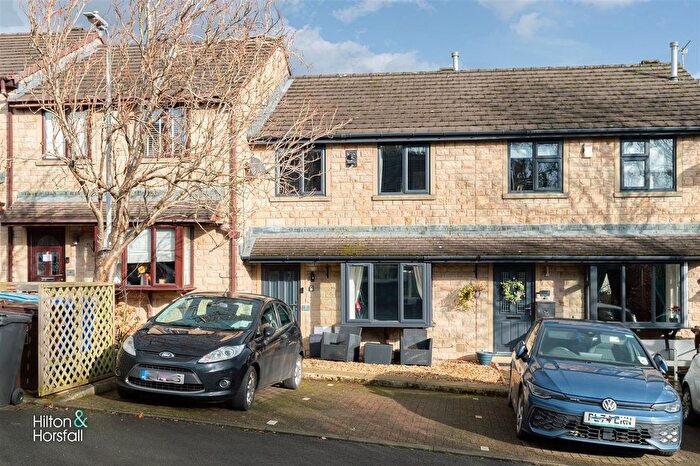
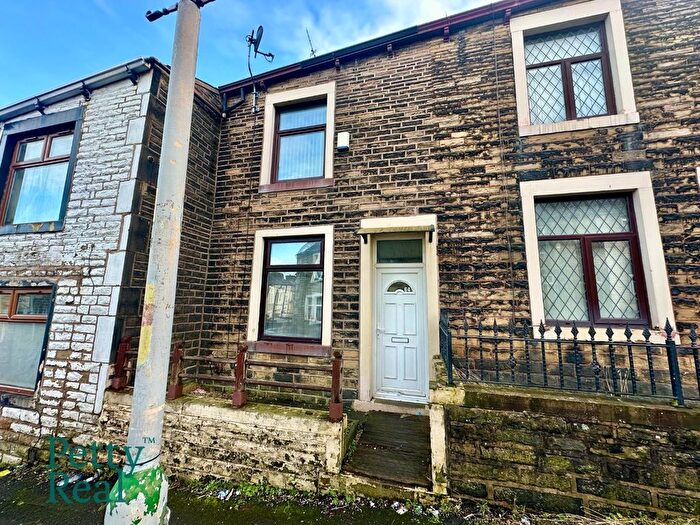
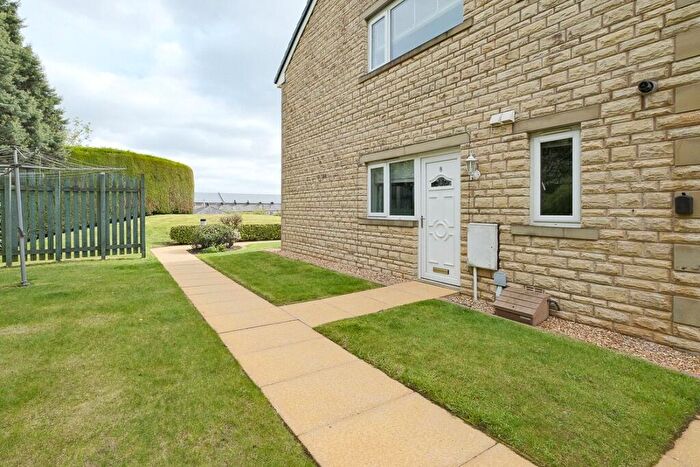
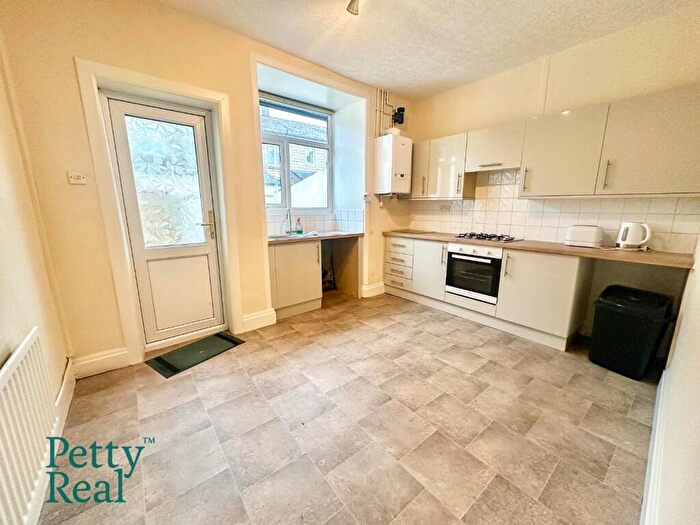
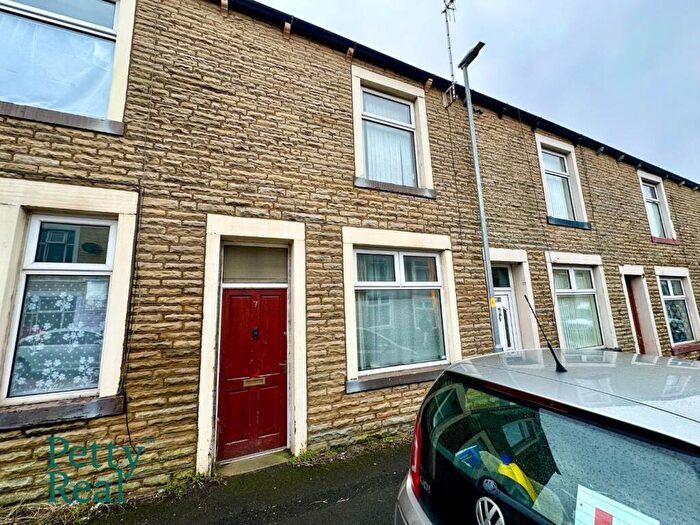
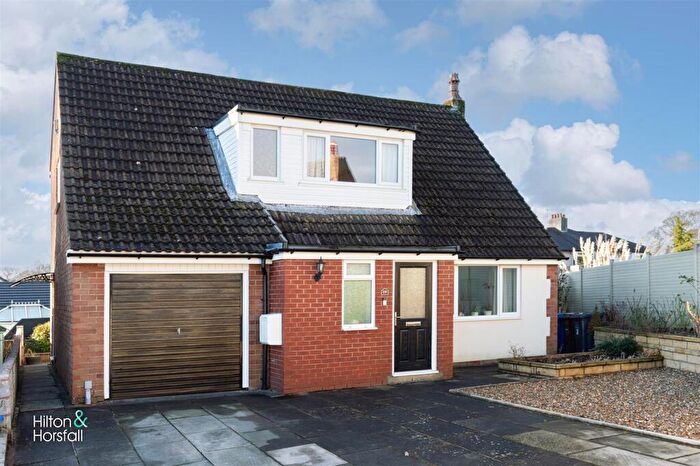
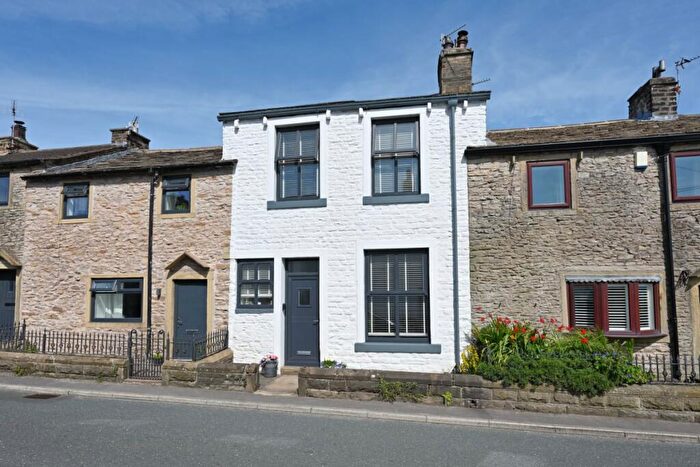
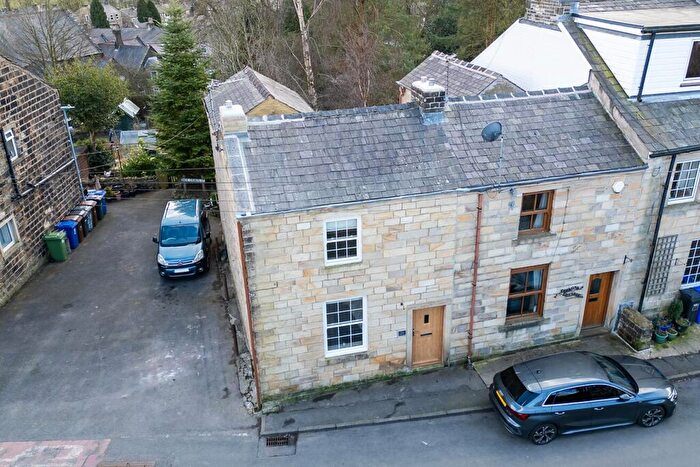
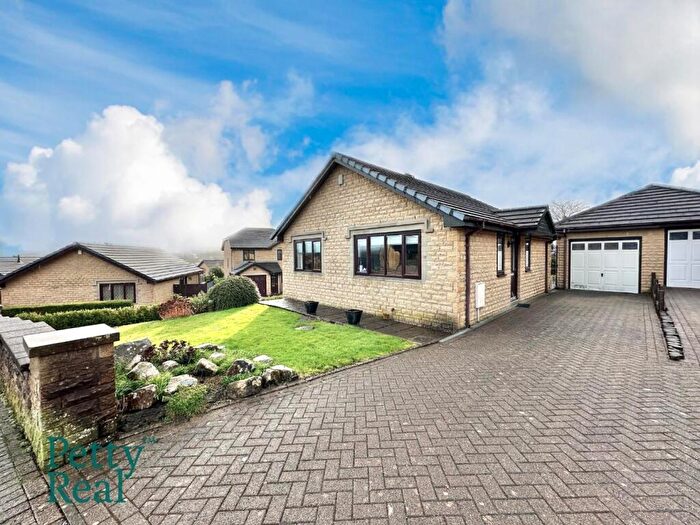
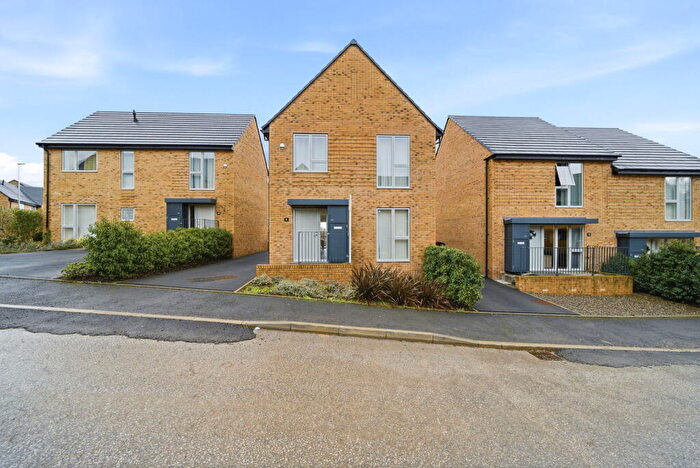
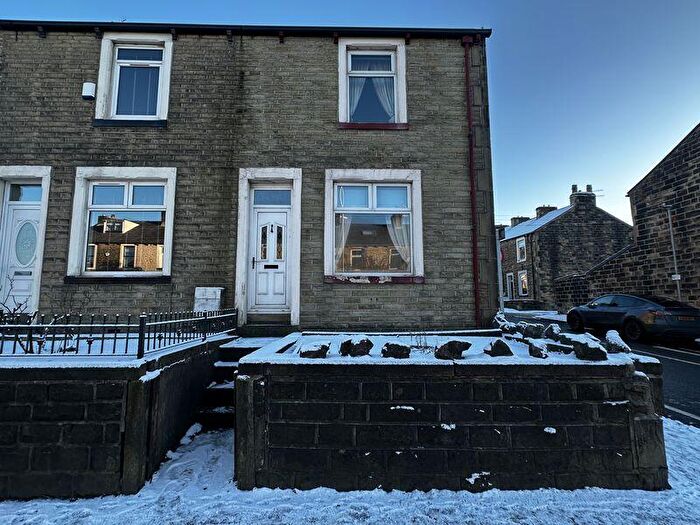
Properties for sale in Blacko And Higherford
Roads and Postcodes in Blacko And Higherford
Navigate through our locations to find the location of your next house in Blacko And Higherford, Nelson for sale or to rent.
| Streets | Postcodes |
|---|---|
| Back Gisburn Road | BB9 6LT |
| Bankfold | BB9 6JW |
| Bankhouse Mews | BB9 6JZ |
| Barleydale Road | BB9 6AD |
| Barnoldswick Road | BB9 6AT BB9 6BH BB9 6BQ BB9 6RE BB9 6RG BB9 6RQ |
| Beverley Road | BB9 6LX |
| Blacko Bar Road | BB9 6LA |
| Calder View | BB9 6AQ |
| Ford Street | BB9 6JF |
| Fore Side | BB9 6AB |
| Francis Avenue | BB9 6AL |
| Gisburn Road | BB9 6AH BB9 6AJ BB9 6AU BB9 6AW BB9 6AY BB9 6JH BB9 6LB BB9 6LP BB9 6LR BB9 6LS BB9 6LZ BB9 6NF BB9 6NG BB9 6NQ |
| Grange Avenue | BB9 6AN |
| Hollin Fold | BB9 6LW |
| Holt Square | BB9 6JJ |
| Malkin Close | BB9 6LY |
| Meadow Edge | BB9 6BT |
| Middleton Drive | BB9 6BA |
| Mitton Avenue | BB9 6BD |
| Mitton Cottages | BB9 6RD |
| Moorland Close | BB9 6BG |
| Paradise Street | BB9 6JN |
| Peel Place | BB9 6BE |
| Ribblesdale Place | BB9 6AX |
| Rockville | BB9 6AG |
| Springbank | BB9 6AP |
| Springfield | BB9 6PL |
| Stone Croft | BB9 6BL |
| Stone Edge Road | BB9 6BB |
| The Fold | BB9 6JL |
| The Orchard | BB9 6BN |
| Wheathead Lane | BB9 6PD |
| Whittycroft Avenue | BB9 6AR |
| Whittycroft Drive | BB9 6AS |
| Willaston Avenue | BB9 6LU |
Transport near Blacko And Higherford
- FAQ
- Price Paid By Year
- Property Type Price
Frequently asked questions about Blacko And Higherford
What is the average price for a property for sale in Blacko And Higherford?
The average price for a property for sale in Blacko And Higherford is £362,687. This amount is 175% higher than the average price in Nelson. There are 1,102 property listings for sale in Blacko And Higherford.
What streets have the most expensive properties for sale in Blacko And Higherford?
The streets with the most expensive properties for sale in Blacko And Higherford are Middleton Drive at an average of £744,975, Meadow Edge at an average of £565,000 and The Orchard at an average of £480,000.
What streets have the most affordable properties for sale in Blacko And Higherford?
The streets with the most affordable properties for sale in Blacko And Higherford are Ford Street at an average of £100,000, The Fold at an average of £149,000 and Moorland Close at an average of £205,000.
Which train stations are available in or near Blacko And Higherford?
Some of the train stations available in or near Blacko And Higherford are Colne, Nelson and Brierfield.
Property Price Paid in Blacko And Higherford by Year
The average sold property price by year was:
| Year | Average Sold Price | Price Change |
Sold Properties
|
|---|---|---|---|
| 2025 | £402,644 | 14% |
17 Properties |
| 2024 | £348,090 | -1% |
26 Properties |
| 2023 | £350,698 | 13% |
25 Properties |
| 2022 | £304,045 | 3% |
21 Properties |
| 2021 | £294,567 | -4% |
45 Properties |
| 2020 | £304,928 | 8% |
23 Properties |
| 2019 | £281,535 | 19% |
34 Properties |
| 2018 | £228,563 | -32% |
26 Properties |
| 2017 | £302,197 | 18% |
20 Properties |
| 2016 | £249,045 | 5% |
24 Properties |
| 2015 | £235,748 | 18% |
33 Properties |
| 2014 | £192,265 | -28% |
30 Properties |
| 2013 | £245,958 | -22% |
28 Properties |
| 2012 | £300,150 | 27% |
19 Properties |
| 2011 | £219,762 | -11% |
31 Properties |
| 2010 | £244,394 | 7% |
23 Properties |
| 2009 | £228,052 | -30% |
19 Properties |
| 2008 | £296,868 | 27% |
22 Properties |
| 2007 | £216,637 | -25% |
28 Properties |
| 2006 | £270,265 | 17% |
47 Properties |
| 2005 | £223,746 | 5% |
48 Properties |
| 2004 | £212,663 | 30% |
68 Properties |
| 2003 | £149,706 | 18% |
49 Properties |
| 2002 | £122,511 | 8% |
34 Properties |
| 2001 | £113,177 | 14% |
35 Properties |
| 2000 | £97,725 | 18% |
24 Properties |
| 1999 | £80,027 | 5% |
35 Properties |
| 1998 | £75,705 | -27% |
33 Properties |
| 1997 | £96,091 | 43% |
24 Properties |
| 1996 | £54,842 | -32% |
32 Properties |
| 1995 | £72,583 | - |
27 Properties |
Property Price per Property Type in Blacko And Higherford
Here you can find historic sold price data in order to help with your property search.
The average Property Paid Price for specific property types in the last three years are:
| Property Type | Average Sold Price | Sold Properties |
|---|---|---|
| Semi Detached House | £326,642.00 | 21 Semi Detached Houses |
| Detached House | £492,639.00 | 28 Detached Houses |
| Terraced House | £211,018.00 | 19 Terraced Houses |

