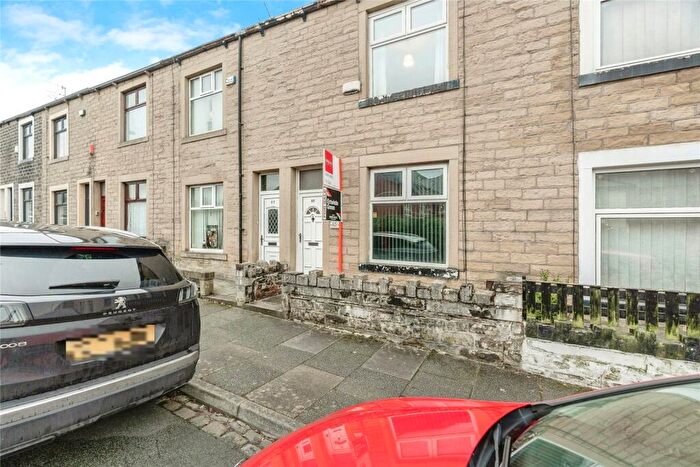
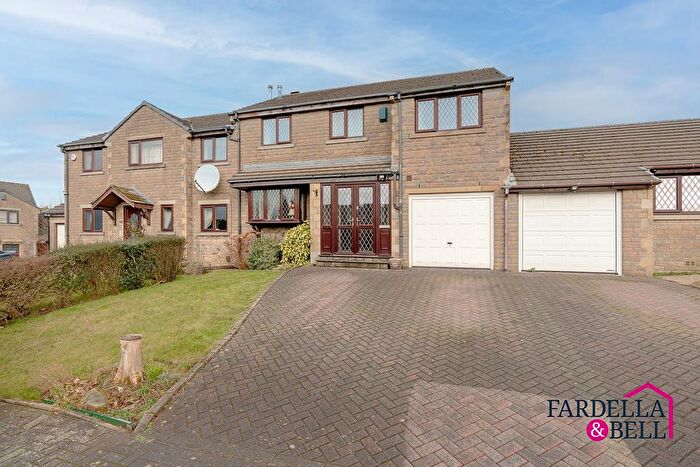
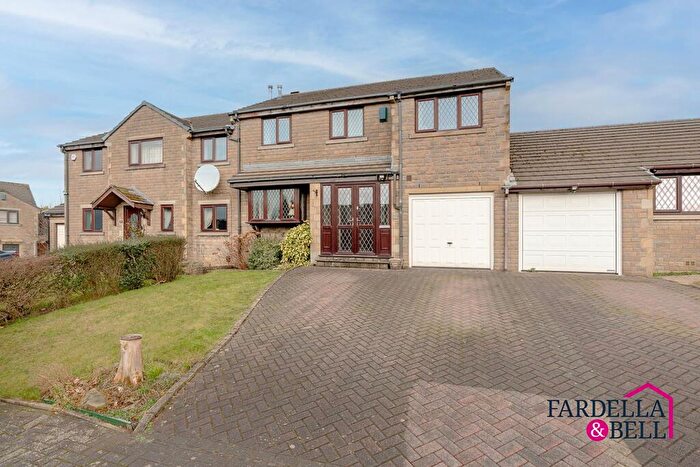
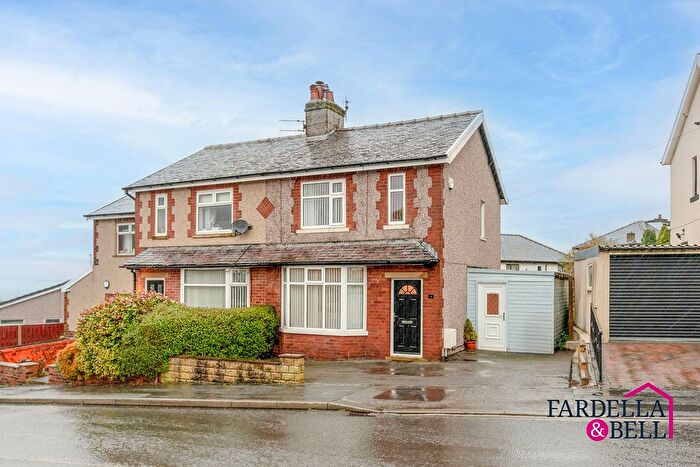
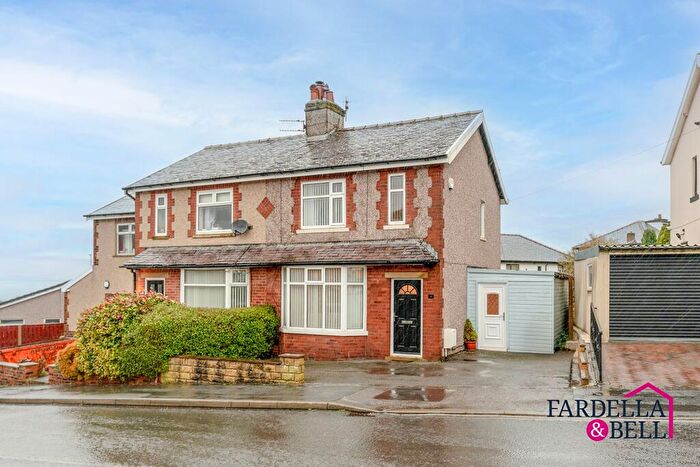
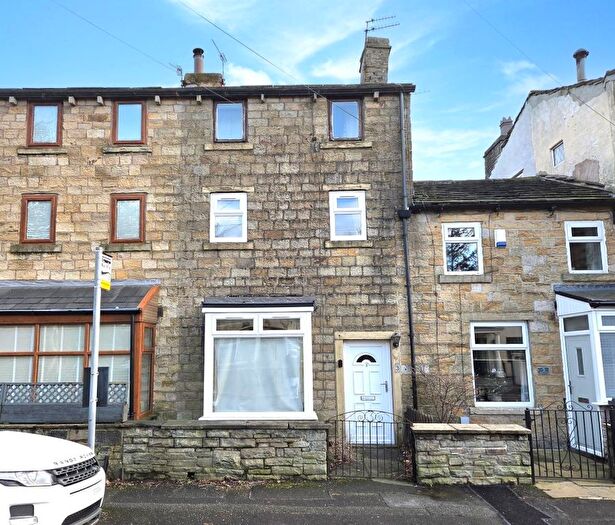
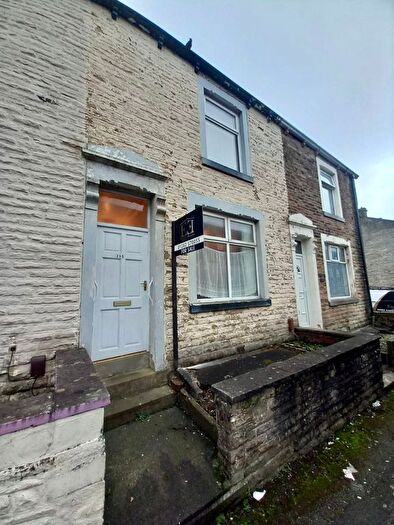
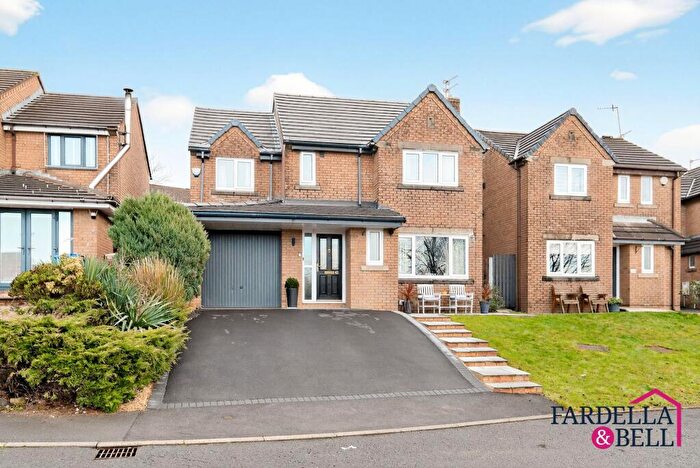
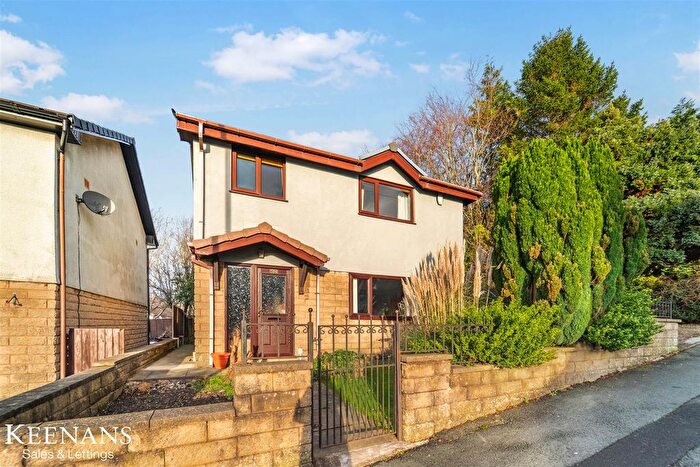
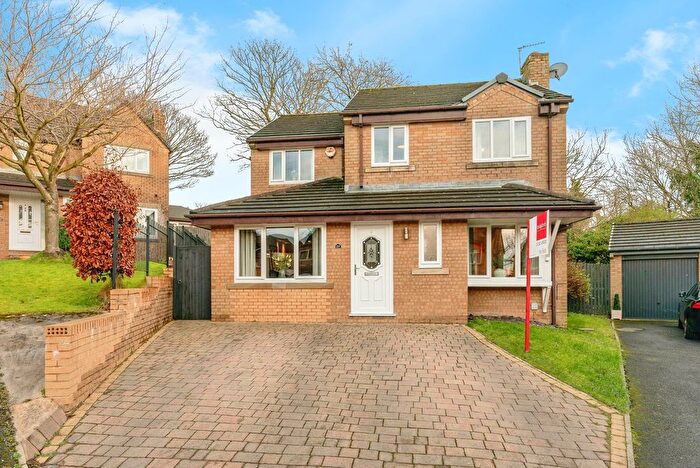
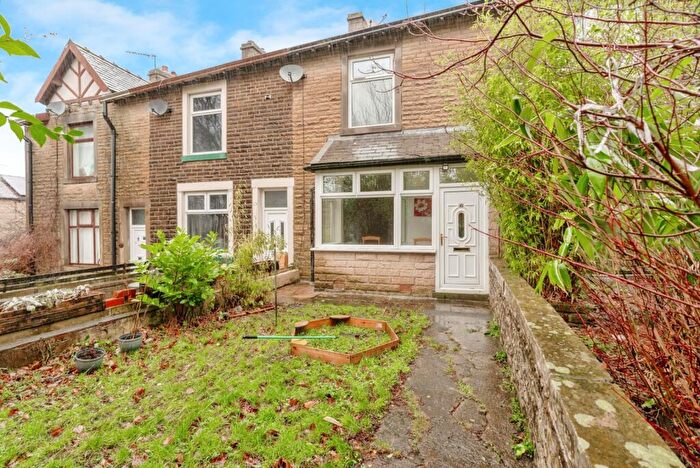
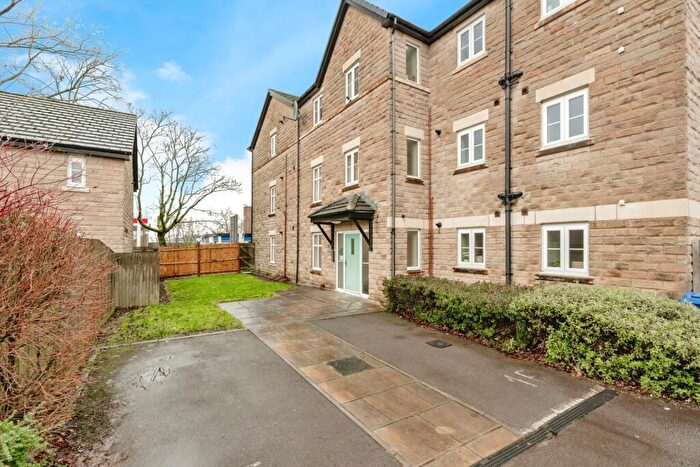
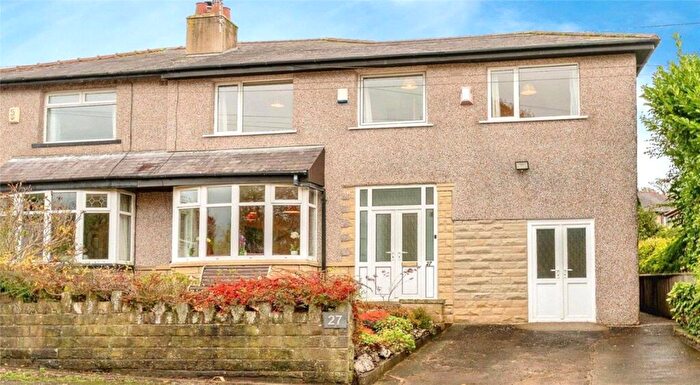
Houses for sale & to rent in Reedley, Nelson
House Prices in Reedley
Properties in Reedley have an average house price of £187,556.00 and had 133 Property Transactions within the last 3 years¹.
Reedley is an area in Nelson, Lancashire with 1,345 households², where the most expensive property was sold for £504,999.00.
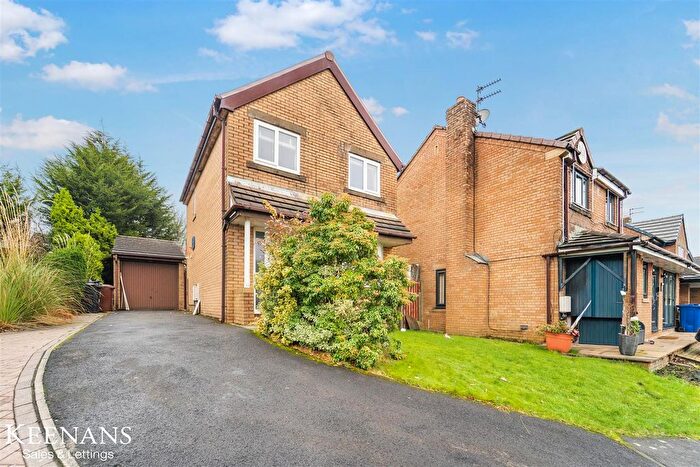
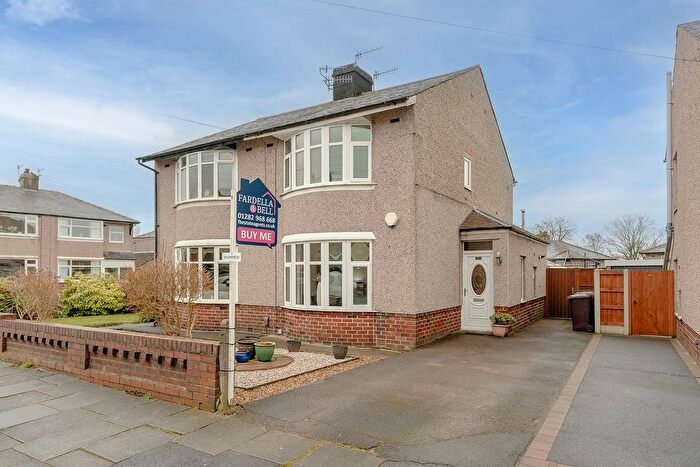
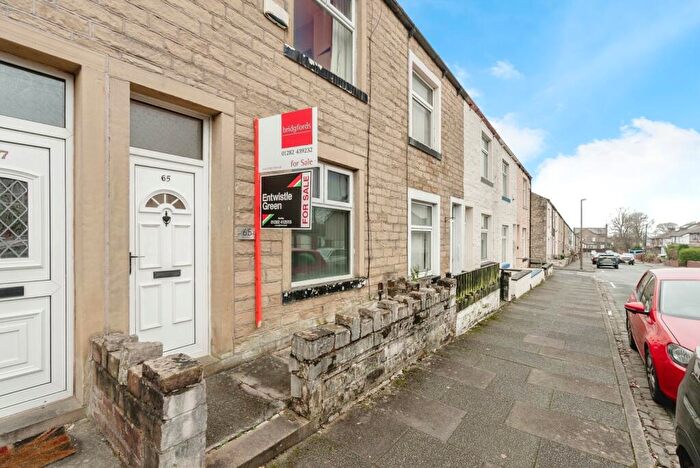
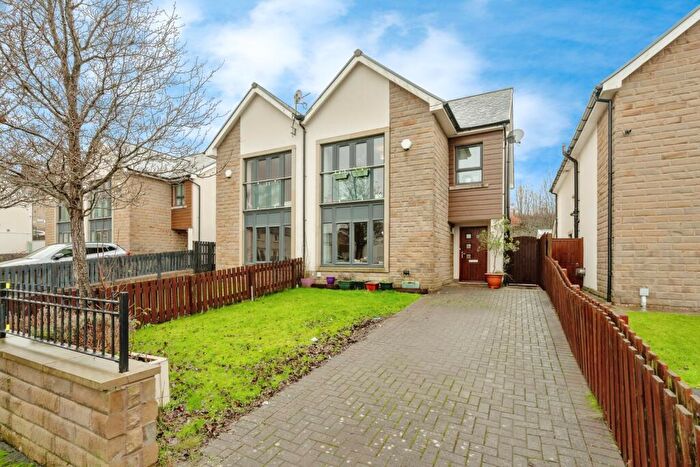
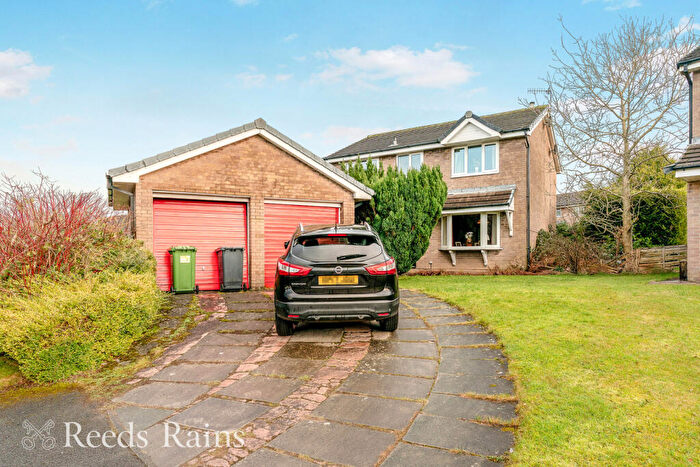
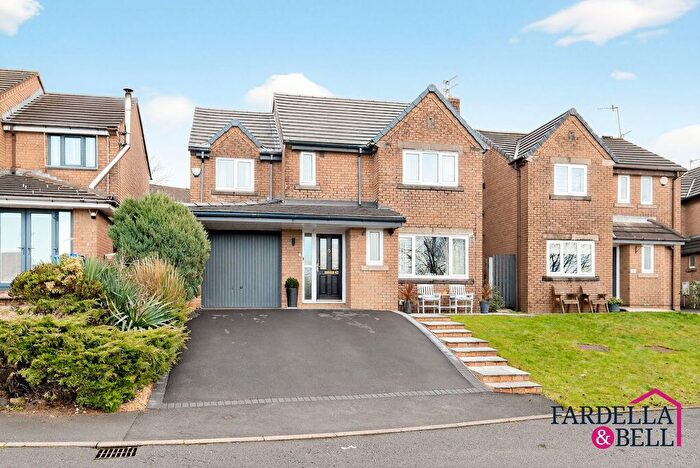
Properties for sale in Reedley
Roads and Postcodes in Reedley
Navigate through our locations to find the location of your next house in Reedley, Nelson for sale or to rent.
| Streets | Postcodes |
|---|---|
| Albert Street | BB9 5JF |
| Back Hill Street | BB9 5QL |
| Balfour Close | BB9 0HH |
| Berry Street | BB9 5JE |
| Bird Street | BB9 5BD |
| Bowland View | BB9 0YD |
| Brier Heights Close | BB9 0HL |
| Broadhurst Way | BB9 5HG |
| Brooden Drive | BB9 5HF |
| Burnley Road | BB9 5JH BB9 5JS |
| Burton Gardens | BB9 5DR |
| Church Street | BB9 5AB |
| Clegg Street | BB9 5JQ |
| Clements Drive | BB9 5TA |
| Clifton Road | BB9 5EX |
| Coronation Road | BB9 5BS |
| Crabtree Street | BB9 5AR |
| Craven Street | BB9 5AJ |
| Green Ridge Close | BB9 0HJ |
| Halifax Road | BB9 5AE BB9 5AZ BB9 5BG BB9 5BJ BB9 5BL BB9 5BY |
| Heather Close | BB9 5HB |
| Height Croft | BB9 0EX |
| Heyhead Street | BB9 5BN BB9 5BT |
| High Street | BB9 5AP |
| Higher Reedley Road | BB9 5EJ BB9 5EY BB9 5HA |
| Hill Street | BB9 5AH BB9 5AT BB9 5QJ |
| Hillsborough Avenue | BB9 0HB |
| Hillside Close | BB9 5DS |
| Hillside View | BB9 5DU |
| Hope Street | BB9 5AX |
| Horncliffe Heights | BB9 0HG |
| Hunter Street | BB9 5JG |
| Hurstwood Gardens | BB9 5FA |
| Kibble Bank | BB9 5EL |
| Kibble Grove | BB9 5EW |
| Kings Causeway | BB9 0EU BB9 0EY BB9 0EZ BB9 0HD BB9 0HE |
| Longridge Heath | BB9 0YE |
| Marsden Grove | BB9 5EZ |
| Montford Road | BB9 5QP |
| Moorland Drive | BB9 5EN BB9 5ER |
| Moorside Avenue | BB9 5HE |
| Mount Street | BB9 5AY |
| Park Drive | BB9 5BP |
| Park Lane | BB9 5BW |
| Parsonage Drive | BB9 5DX |
| Pennine Crescent | BB9 5EU |
| Pennine Way | BB9 5DT BB9 5ET |
| Primrose Street | BB9 5AG |
| Quaker Bridge | BB9 5QW |
| Reedley Road | BB9 5ES |
| Ribchester Way | BB9 0YH |
| Richard Street | BB9 5HZ |
| Robinson Lane | BB9 5QR BB9 5QS |
| Sefton Street | BB9 5BE |
| Stoneyhurst Height | BB9 0YB |
| Sycamore Rise | BB9 0HN |
| Townley Street | BB9 5JD |
| Trinity Close | BB9 5ED |
| Union Street | BB9 5AL |
| Walter Street | BB9 5AQ BB9 5AW BB9 5JA BB9 5JB |
| Watkins Close | BB9 5TB |
| Waverley Close | BB9 5HD |
| Weatherhill Crescent | BB9 0HF |
| Wilton Street | BB9 5BX |
| Wood Street | BB9 5AS |
| Woodfield Terrace | BB9 5BU |
| Woodlea Gardens | BB9 0HA |
Transport near Reedley
-
Brierfield Station
-
Nelson Station
-
Burnley Central Station
-
Burnley Barracks Station
-
Burnley Manchester Road Station
-
Colne Station
- FAQ
- Price Paid By Year
- Property Type Price
Frequently asked questions about Reedley
What is the average price for a property for sale in Reedley?
The average price for a property for sale in Reedley is £187,556. This amount is 42% higher than the average price in Nelson. There are 1,064 property listings for sale in Reedley.
What streets have the most expensive properties for sale in Reedley?
The streets with the most expensive properties for sale in Reedley are Balfour Close at an average of £351,666, Hillsborough Avenue at an average of £333,000 and Brier Heights Close at an average of £308,250.
What streets have the most affordable properties for sale in Reedley?
The streets with the most affordable properties for sale in Reedley are High Street at an average of £48,000, Clegg Street at an average of £52,500 and Walter Street at an average of £68,125.
Which train stations are available in or near Reedley?
Some of the train stations available in or near Reedley are Brierfield, Nelson and Burnley Central.
Property Price Paid in Reedley by Year
The average sold property price by year was:
| Year | Average Sold Price | Price Change |
Sold Properties
|
|---|---|---|---|
| 2025 | £195,631 | 6% |
45 Properties |
| 2024 | £184,177 | 1% |
42 Properties |
| 2023 | £182,741 | 18% |
46 Properties |
| 2022 | £150,626 | 4% |
59 Properties |
| 2021 | £145,083 | 8% |
65 Properties |
| 2020 | £133,961 | -6% |
53 Properties |
| 2019 | £142,052 | 24% |
44 Properties |
| 2018 | £107,766 | -5% |
57 Properties |
| 2017 | £113,541 | -11% |
57 Properties |
| 2016 | £125,800 | 0,2% |
46 Properties |
| 2015 | £125,487 | 13% |
40 Properties |
| 2014 | £109,589 | 15% |
44 Properties |
| 2013 | £92,987 | -8% |
48 Properties |
| 2012 | £100,363 | -4% |
37 Properties |
| 2011 | £104,658 | -8% |
40 Properties |
| 2010 | £112,584 | 2% |
46 Properties |
| 2009 | £110,664 | -16% |
35 Properties |
| 2008 | £128,671 | -0,1% |
37 Properties |
| 2007 | £128,781 | 5% |
90 Properties |
| 2006 | £121,806 | 24% |
101 Properties |
| 2005 | £92,277 | 18% |
75 Properties |
| 2004 | £75,386 | -1% |
103 Properties |
| 2003 | £76,312 | 19% |
83 Properties |
| 2002 | £62,102 | -11% |
106 Properties |
| 2001 | £68,650 | 4% |
93 Properties |
| 2000 | £65,736 | 20% |
98 Properties |
| 1999 | £52,268 | 20% |
74 Properties |
| 1998 | £41,928 | -14% |
49 Properties |
| 1997 | £47,903 | 15% |
64 Properties |
| 1996 | £40,674 | -16% |
45 Properties |
| 1995 | £47,344 | - |
60 Properties |
Property Price per Property Type in Reedley
Here you can find historic sold price data in order to help with your property search.
The average Property Paid Price for specific property types in the last three years are:
| Property Type | Average Sold Price | Sold Properties |
|---|---|---|
| Semi Detached House | £192,612.00 | 50 Semi Detached Houses |
| Detached House | £273,719.00 | 41 Detached Houses |
| Terraced House | £97,425.00 | 42 Terraced Houses |

