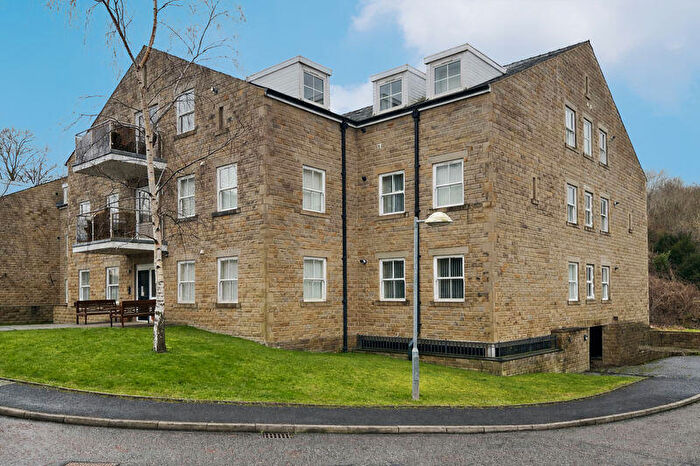
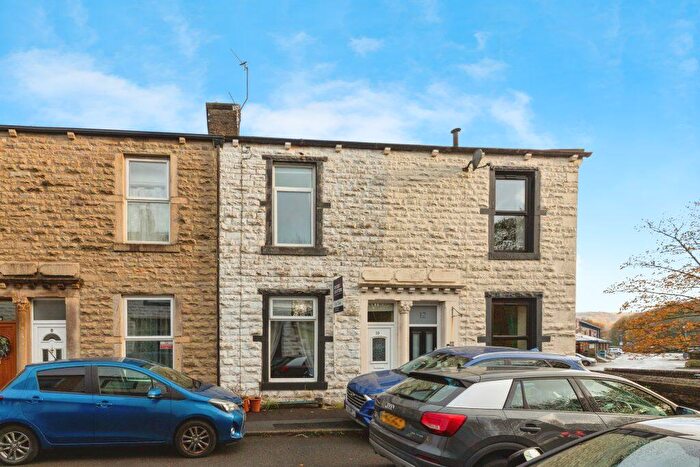
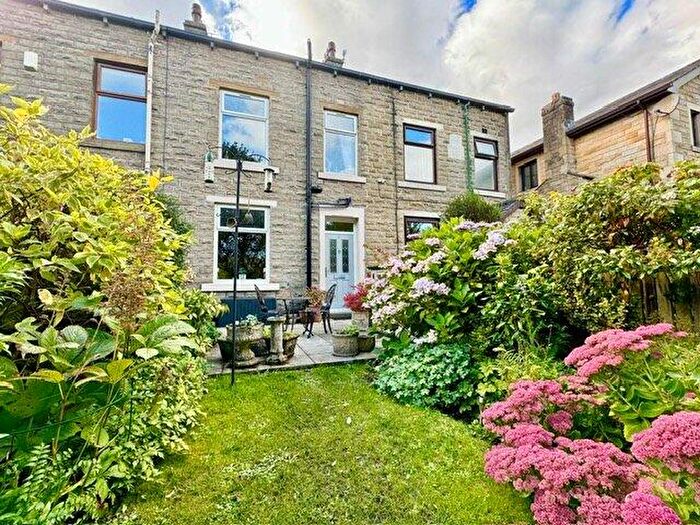
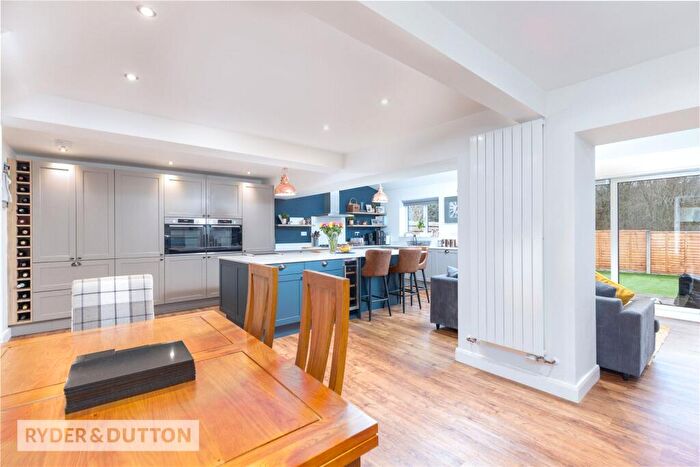
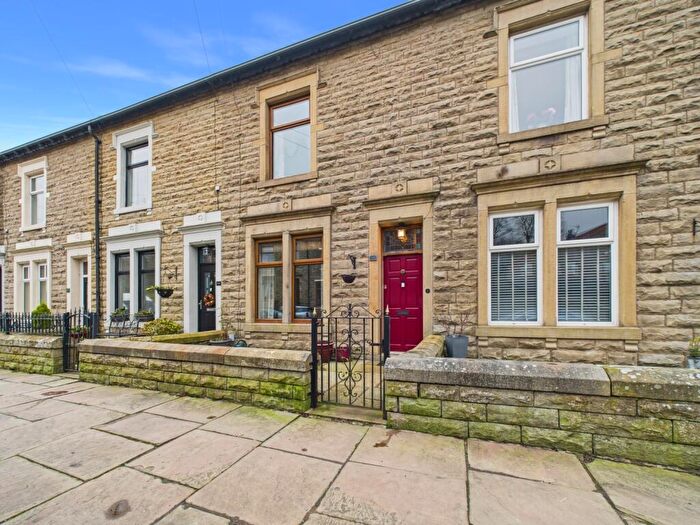
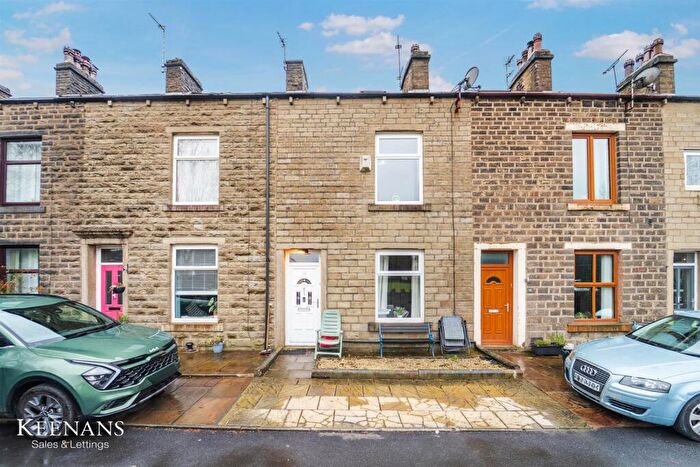
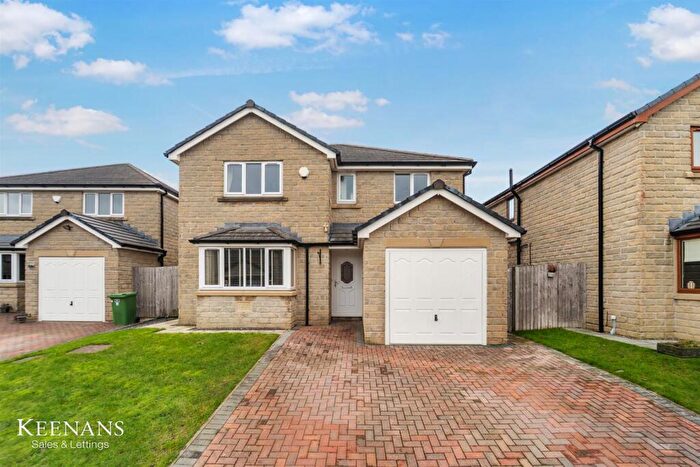
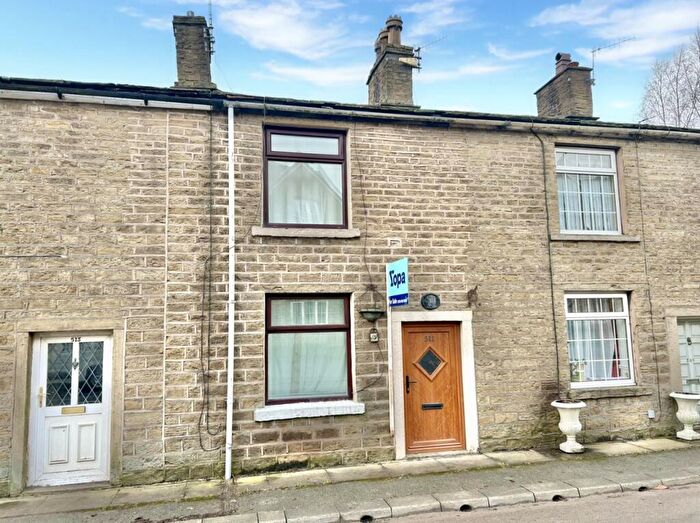
Houses for sale & to rent in Rossendale, Lancashire
House Prices in Rossendale
Properties in Rossendale have an average house price of £216,768.00 and had 1,745 Property Transactions within the last 3 years.¹
Rossendale is an area in Lancashire with 17,388 households², where the most expensive property was sold for £960,000.00.
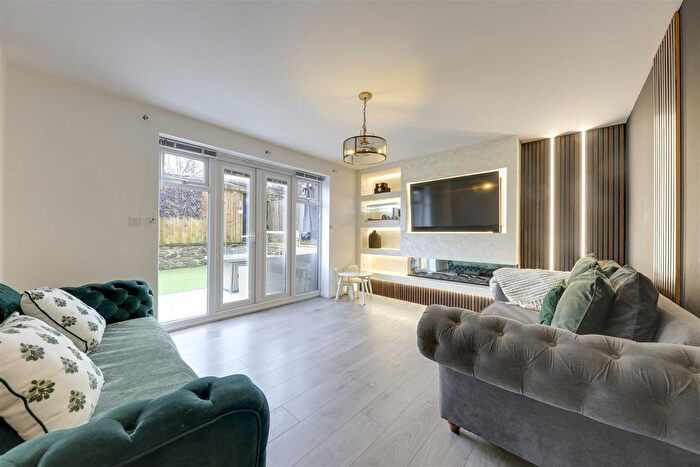
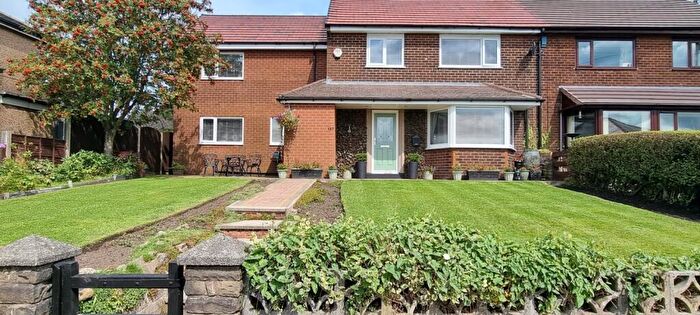
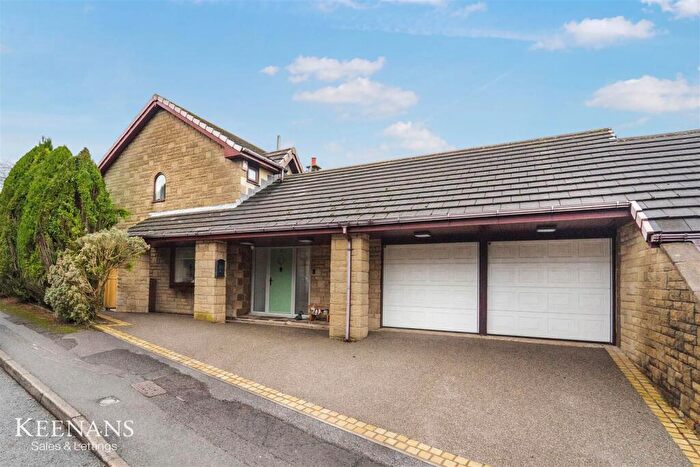
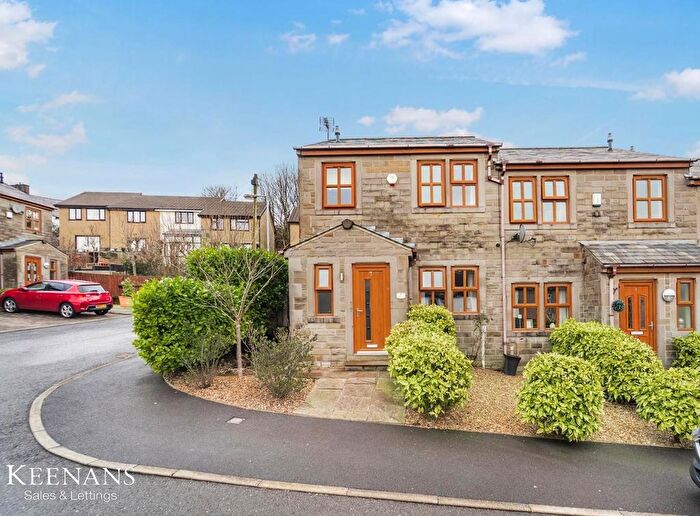
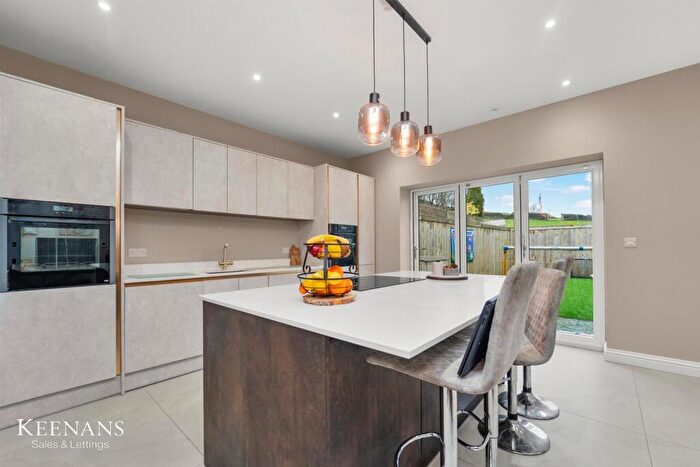
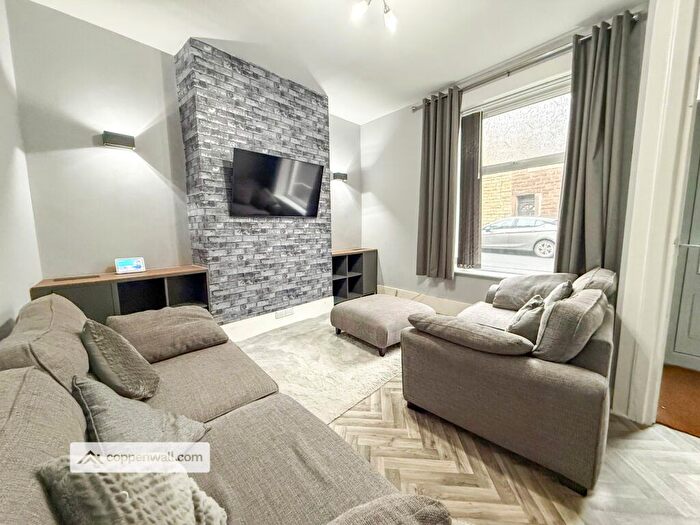
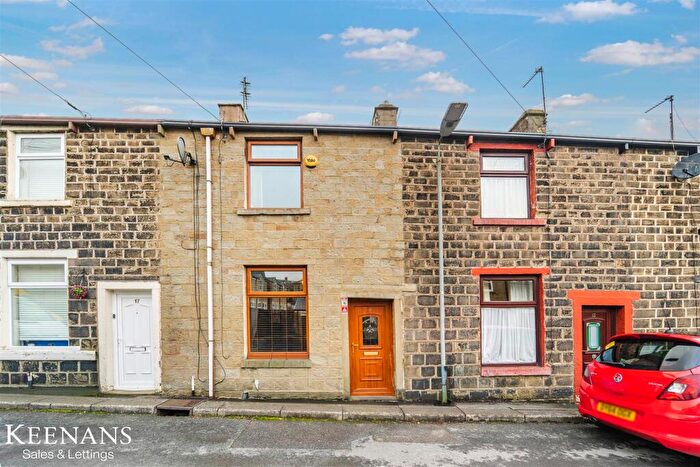
Properties for sale in Rossendale
Neighbourhoods in Rossendale
Navigate through our locations to find the location of your next house in Rossendale, Lancashire for sale or to rent.
Transport in Rossendale
Please see below transportation links in this area:
-
Accrington Station
-
Church and Oswaldtwistle Station
-
Huncoat Station
-
Hapton Station
-
Rose Grove Station
-
Burnley Manchester Road Station
-
Entwistle Station
-
Burnley Barracks Station
-
Burnley Central Station
-
Rishton Station
- FAQ
- Price Paid By Year
- Property Type Price
Frequently asked questions about Rossendale
What is the average price for a property for sale in Rossendale?
The average price for a property for sale in Rossendale is £216,768. This amount is 4% higher than the average price in Lancashire. There are 4,872 property listings for sale in Rossendale.
What locations have the most expensive properties for sale in Rossendale?
The locations with the most expensive properties for sale in Rossendale are Helmshore at an average of £252,752, Longholme at an average of £248,158 and Cribden at an average of £239,071.
What locations have the most affordable properties for sale in Rossendale?
The locations with the most affordable properties for sale in Rossendale are Worsley at an average of £145,680, Whitewell at an average of £179,310 and Greenfield at an average of £214,014.
Which train stations are available in or near Rossendale?
Some of the train stations available in or near Rossendale are Accrington, Church and Oswaldtwistle and Huncoat.
Property Price Paid in Rossendale by Year
The average sold property price by year was:
| Year | Average Sold Price | Price Change |
Sold Properties
|
|---|---|---|---|
| 2025 | £227,275 | 5% |
559 Properties |
| 2024 | £214,891 | 3% |
637 Properties |
| 2023 | £208,246 | -7% |
549 Properties |
| 2022 | £223,385 | 10% |
729 Properties |
| 2021 | £202,161 | 9% |
943 Properties |
| 2020 | £184,258 | 8% |
618 Properties |
| 2019 | £170,198 | -1% |
752 Properties |
| 2018 | £171,835 | 6% |
735 Properties |
| 2017 | £161,822 | 6% |
833 Properties |
| 2016 | £152,106 | 3% |
786 Properties |
| 2015 | £147,781 | 3% |
716 Properties |
| 2014 | £143,256 | 3% |
694 Properties |
| 2013 | £139,104 | 5% |
525 Properties |
| 2012 | £132,473 | -2% |
387 Properties |
| 2011 | £135,490 | -3% |
410 Properties |
| 2010 | £139,217 | 2% |
394 Properties |
| 2009 | £136,523 | -5% |
362 Properties |
| 2008 | £143,596 | 2% |
443 Properties |
| 2007 | £140,149 | 6% |
977 Properties |
| 2006 | £131,902 | 2% |
967 Properties |
| 2005 | £129,600 | 9% |
968 Properties |
| 2004 | £117,541 | 21% |
1,139 Properties |
| 2003 | £92,792 | 23% |
1,087 Properties |
| 2002 | £71,887 | 9% |
1,012 Properties |
| 2001 | £65,632 | 8% |
837 Properties |
| 2000 | £60,487 | 6% |
750 Properties |
| 1999 | £57,105 | -4% |
804 Properties |
| 1998 | £59,164 | 10% |
880 Properties |
| 1997 | £53,119 | 18% |
706 Properties |
| 1996 | £43,765 | -3% |
428 Properties |
| 1995 | £45,007 | - |
533 Properties |
Property Price per Property Type in Rossendale
Here you can find historic sold price data in order to help with your property search.
The average Property Paid Price for specific property types in the last three years are:
| Property Type | Average Sold Price | Sold Properties |
|---|---|---|
| Semi Detached House | £232,993.00 | 392 Semi Detached Houses |
| Terraced House | £156,629.00 | 905 Terraced Houses |
| Detached House | £394,027.00 | 317 Detached Houses |
| Flat | £154,731.00 | 131 Flats |

