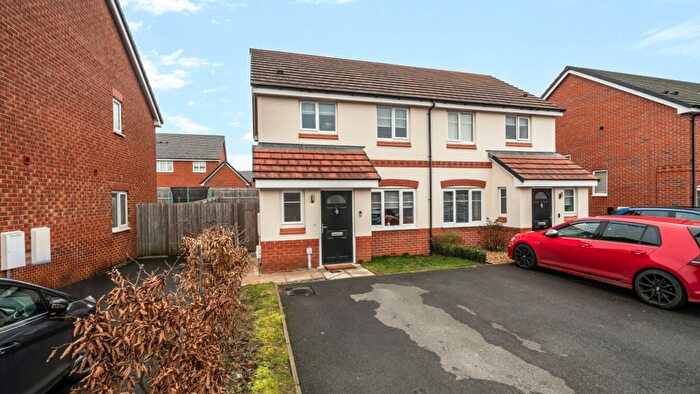
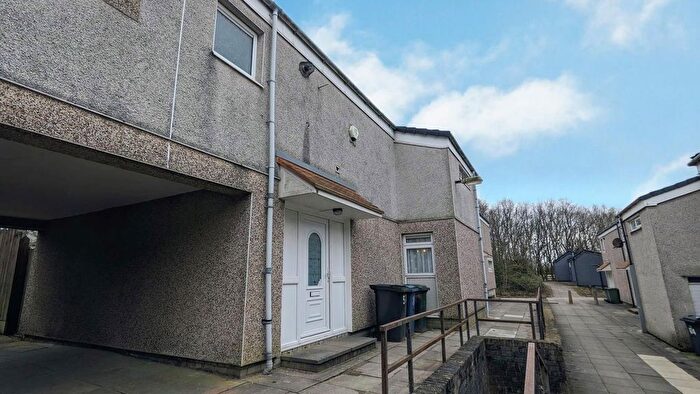
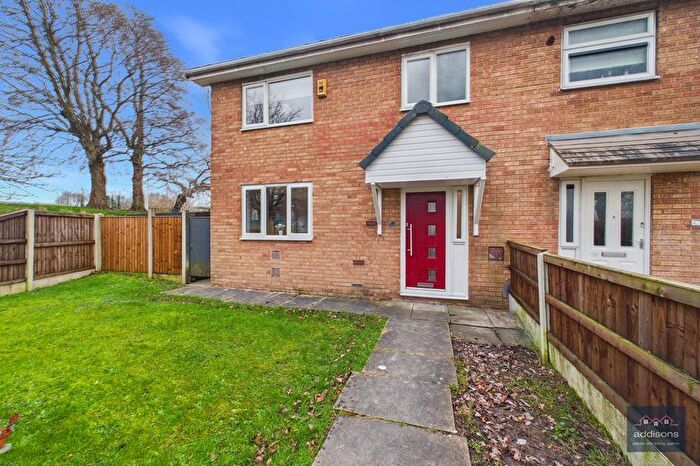
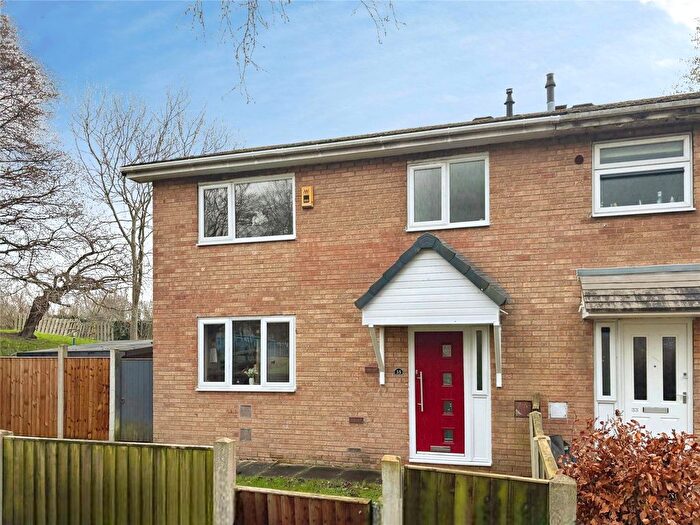
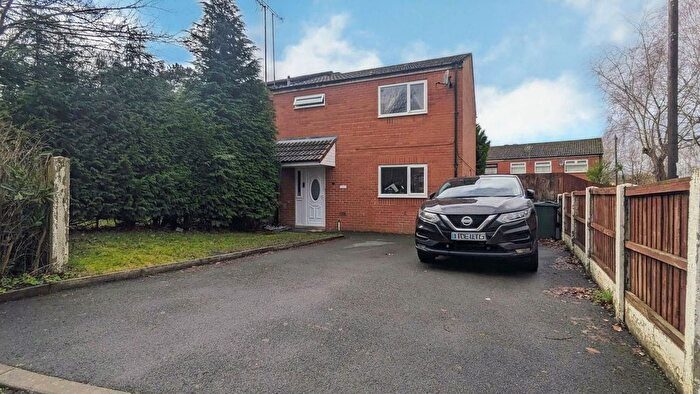
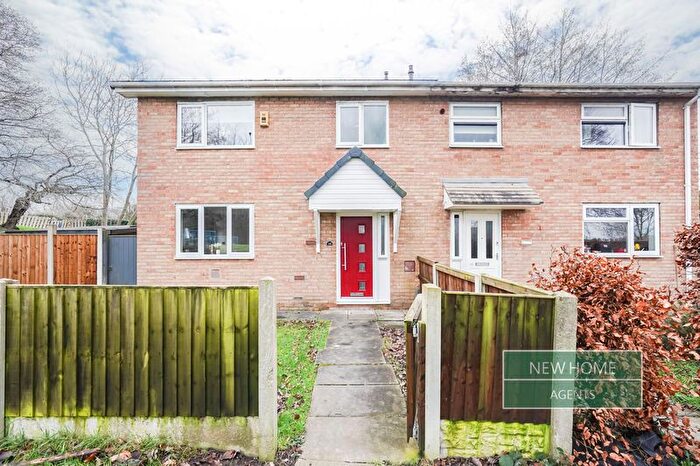
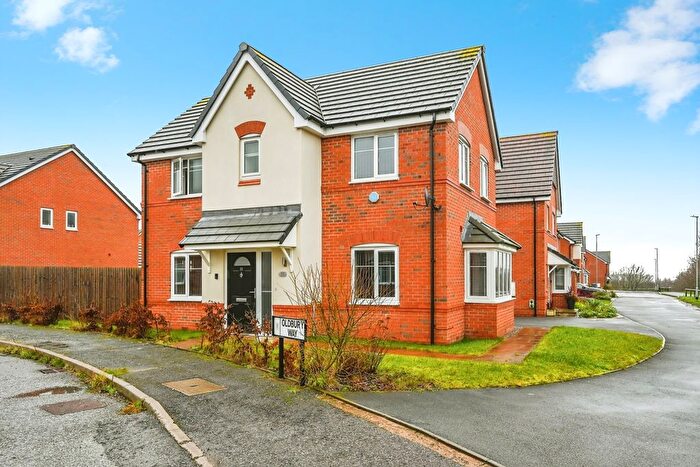
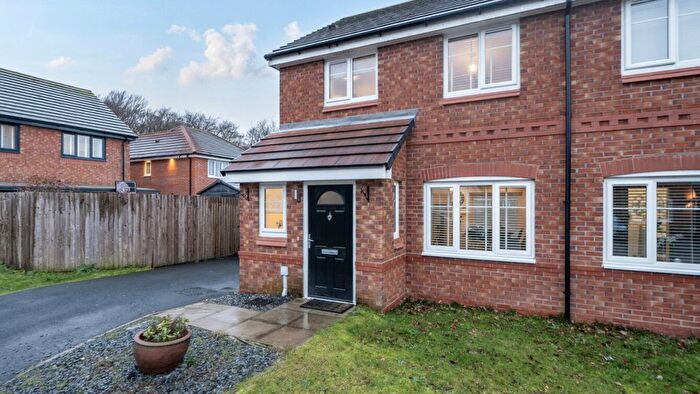
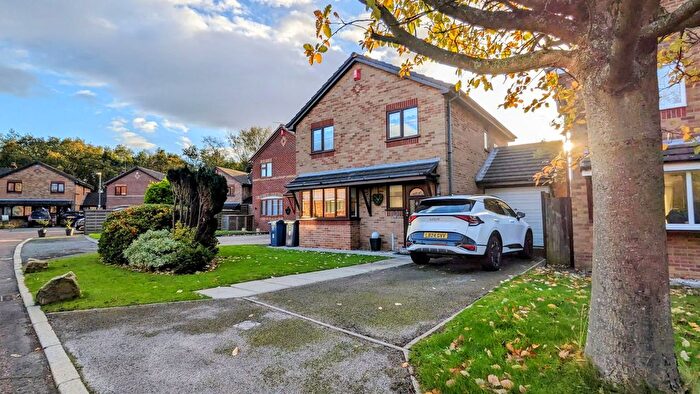
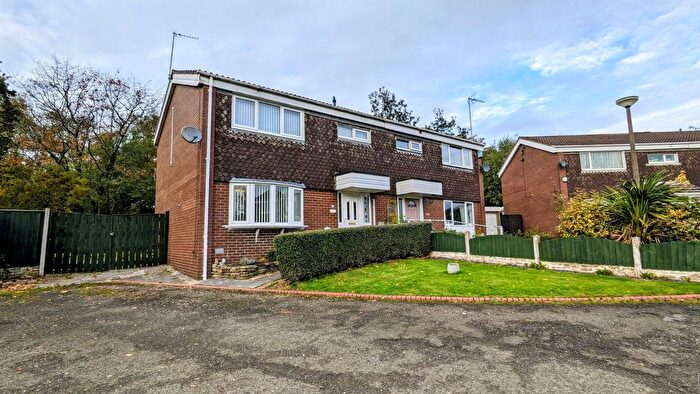
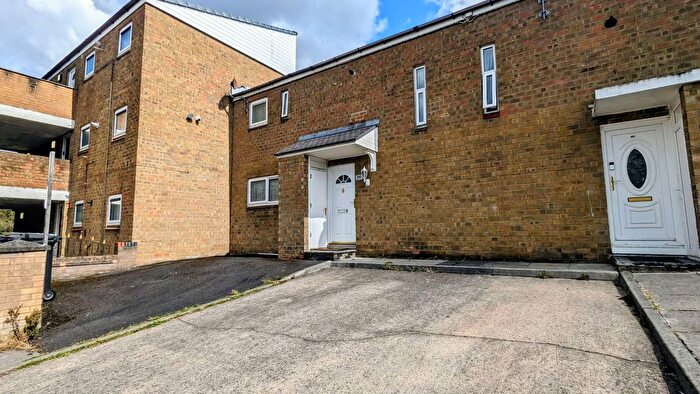
Houses for sale & to rent in Ashurst, Skelmersdale
House Prices in Ashurst
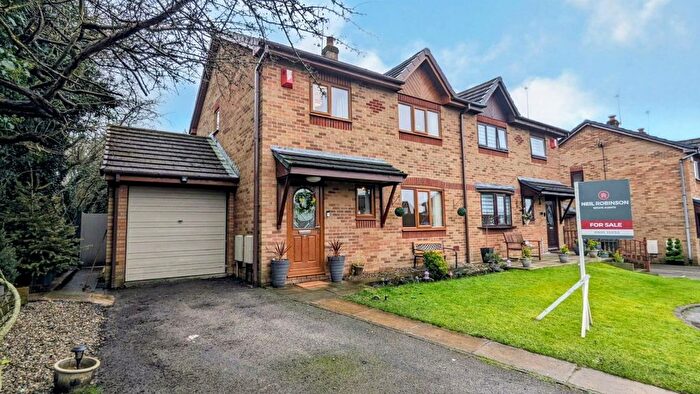
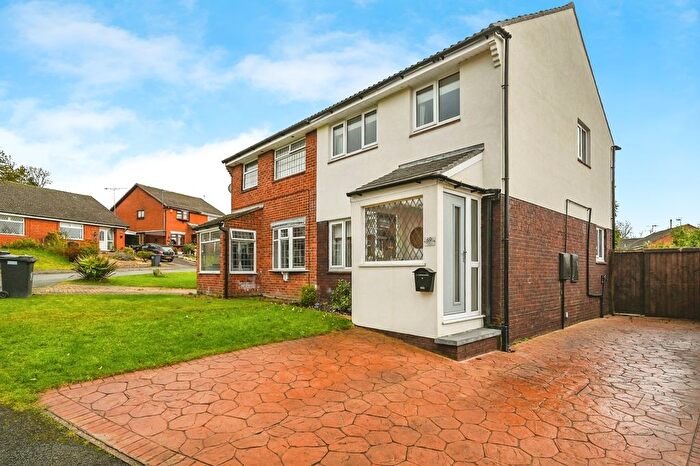
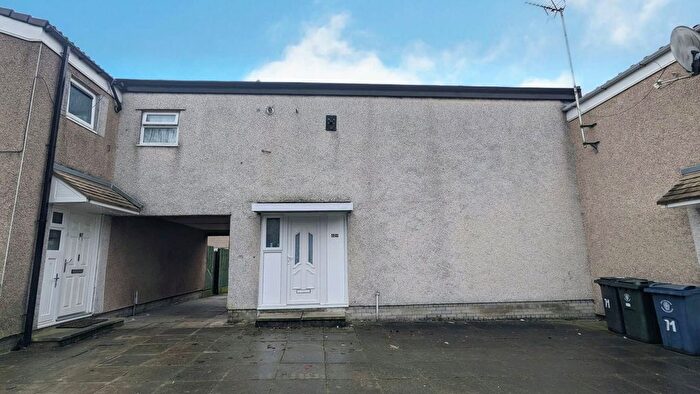
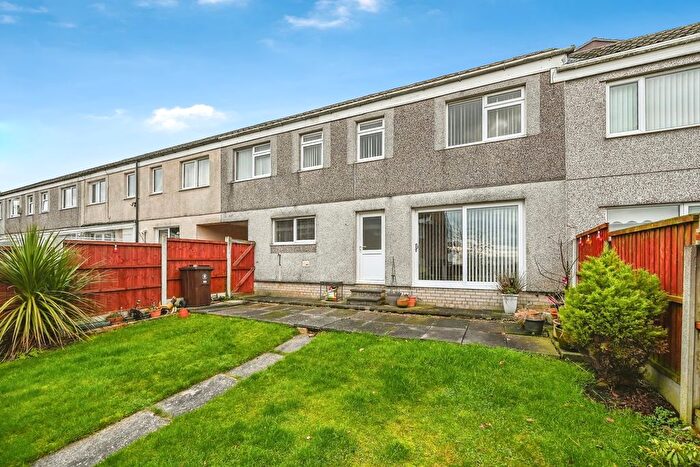
Properties in Ashurst have an average house price of £203,722.00 and had 224 Property Transactions within the last 3 years¹.
Ashurst is an area in Skelmersdale, Lancashire with 2,464 households², where the most expensive property was sold for £1,330,000.00.
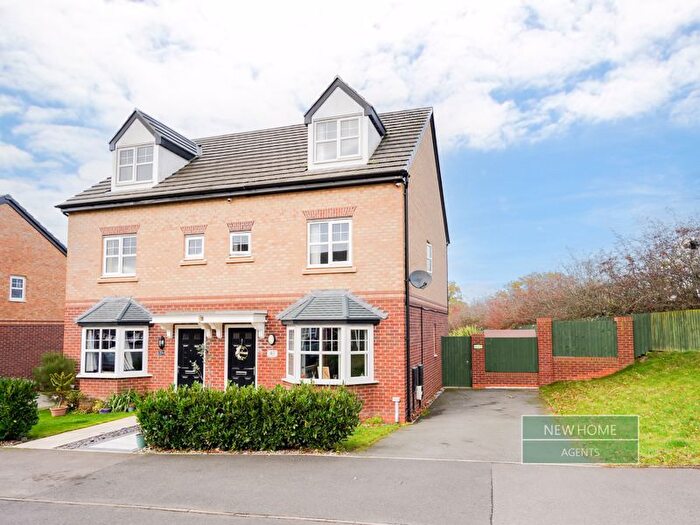
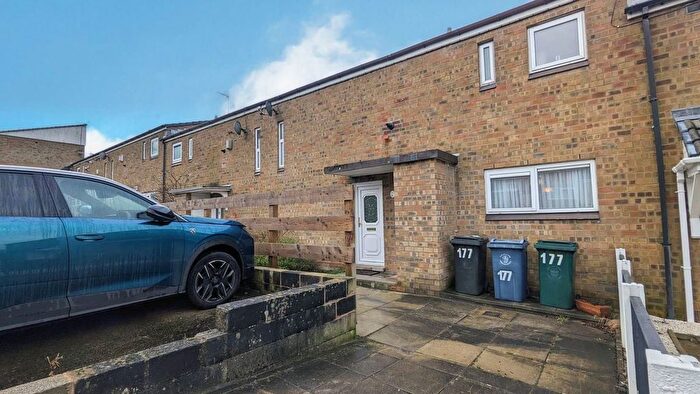
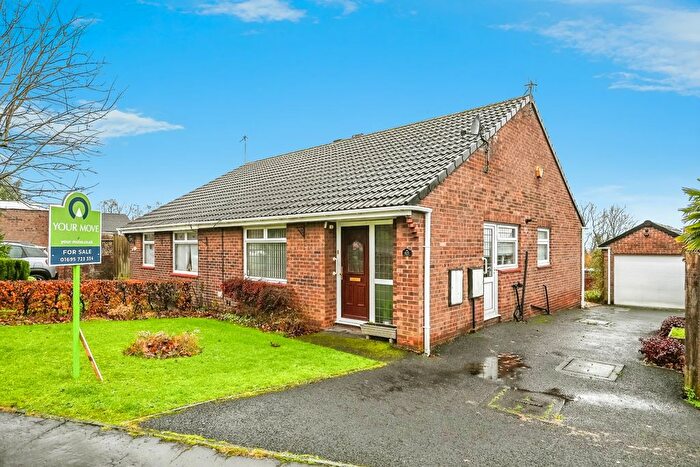
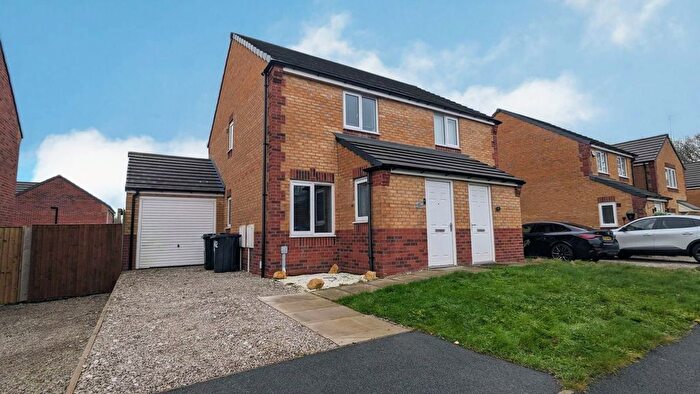
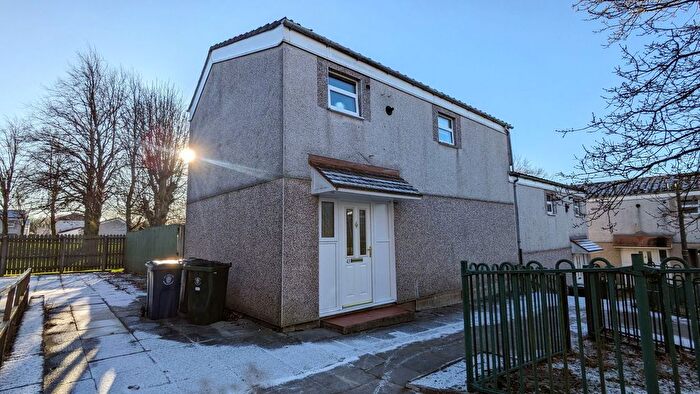
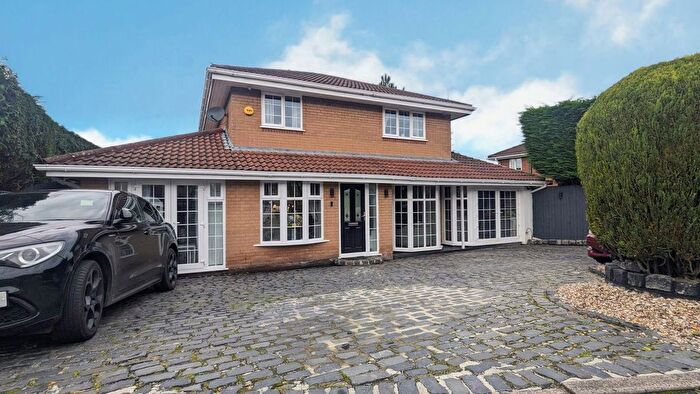
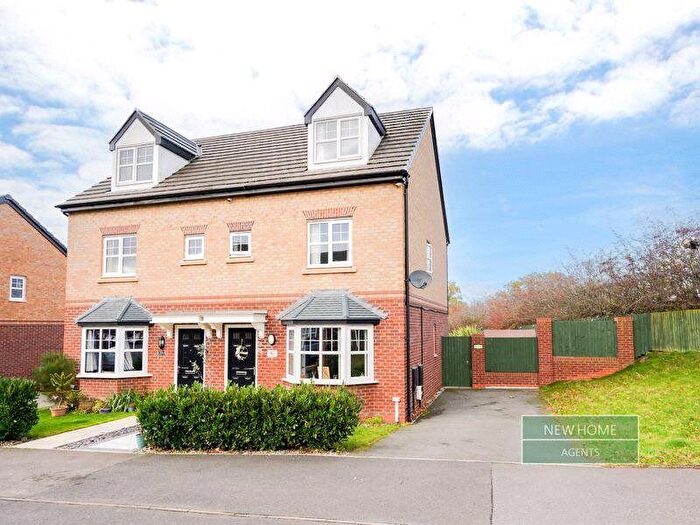
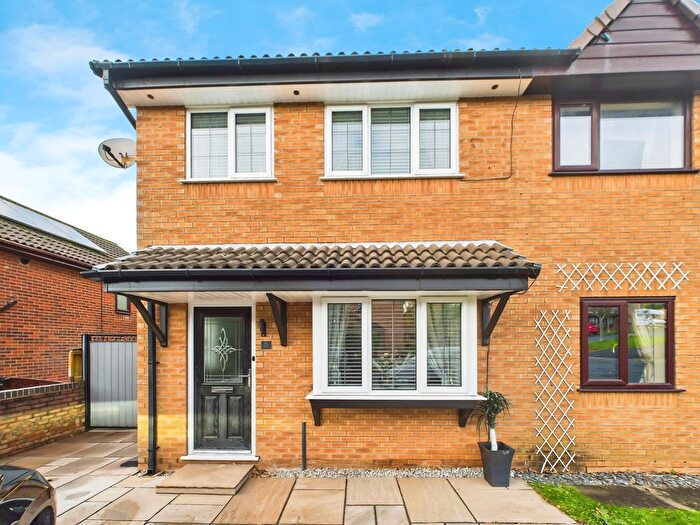
Properties for sale in Ashurst
Previously listed properties in Ashurst
Roads and Postcodes in Ashurst
Navigate through our locations to find the location of your next house in Ashurst, Skelmersdale for sale or to rent.
| Streets | Postcodes |
|---|---|
| Ashurst Close | WN8 6QR |
| Ashurst Gardens | WN8 6SW |
| Ashurst Road | WN8 6TN WN8 6XN |
| Ashwood | WN8 6US |
| Beechwood | WN8 6UT |
| Briars Green | WN8 6SQ |
| Elmers Green Lane | WN8 6SH WN8 6SJ WN8 6SN WN8 6SL |
| Elmwood | WN8 6UU |
| Fairhaven | WN8 6RH WN8 6RQ |
| Fairlie | WN8 6RF WN8 6RG |
| Fairstead | WN8 6RB WN8 6RD |
| Falkland | WN8 6RA |
| Firwood | WN8 6UX |
| Forest Drive | WN8 6UW |
| Foxfold | WN8 6UE |
| Hazel Lane | WN8 6UN |
| Jackfield Way | WN8 6EU WN8 6EW |
| Jacksdale Close | WN8 6EX |
| Jacobstow Close | WN8 6EY |
| Jarrow Close | WN8 6EZ |
| Kestrel Mews | WN8 6TD |
| Kestrel Park | WN8 6TA WN8 6TB |
| Kingfisher Park | WN8 6XS |
| Kingsbury Court | WN8 6XW |
| Lambourne | WN8 6TG |
| Langtree | WN8 6TQ |
| Larkhill | WN8 6TE WN8 6TF |
| Ledburn | WN8 6TU WN8 6TX |
| Leeswood | WN8 6TH |
| Lindens | WN8 6TJ WN8 6TL WN8 6TW |
| Lindholme | WN8 6TP |
| Longhey | WN8 6UA |
| Lowcroft | WN8 6TY WN8 6TZ |
| Luddington Drive | WN8 6HF |
| Ludlow | WN8 6TR |
| Lulworth | WN8 6TS WN8 6TT |
| Lyndale | WN8 6UJ |
| Lyndhurst | WN8 6UH |
| Manfield | WN8 6SU WN8 6SX |
| Maplewood | WN8 6RJ |
| Marland | WN8 6ST |
| Marlborough | WN8 6SD |
| Marlborough Court | WN8 6SS |
| Maryvale | WN8 6DY |
| Maytree Walk | WN8 6UP |
| Meadowclough | WN8 6QW |
| Meadowcroft | WN8 6RT |
| Meadway | WN8 6QN |
| Melbreck | WN8 6SY WN8 6SZ |
| Merewood | WN8 6RU WN8 6RX |
| Middlewood | WN8 6SR |
| Mountwood | WN8 6PS |
| Nairn Avenue | WN8 6PP |
| Needham Way | WN8 6PR |
| Newburn Close | WN8 6PJ |
| Newbury Road | WN8 6QJ |
| Newby Drive | WN8 6PU |
| Newstead Drive | WN8 6PT |
| Newton Drive | WN8 6PX |
| Oak Tree Court | WN8 6SP |
| Oakwood | WN8 6UY |
| Parklands | WN8 6UD |
| Pinewood | WN8 6UZ |
| Rowan Lane | WN8 6UL |
| Sherwood Drive | WN8 6SF |
| The Fairways | WN8 6UG |
| Ulverston Drive | WN8 6HL |
| Westhaven Mews | WN8 6DZ |
| Willow Walk | WN8 6UR |
| Woodley Park Road | WN8 6UQ |
| WN8 6GW WN8 6QP WN8 6QS WN8 6RE |
Transport near Ashurst
- FAQ
- Price Paid By Year
- Property Type Price
Frequently asked questions about Ashurst
What is the average price for a property for sale in Ashurst?
The average price for a property for sale in Ashurst is £203,722. This amount is 22% higher than the average price in Skelmersdale. There are 367 property listings for sale in Ashurst.
What streets have the most expensive properties for sale in Ashurst?
The streets with the most expensive properties for sale in Ashurst are Elmers Green Lane at an average of £557,416, The Fairways at an average of £355,000 and Kingsbury Court at an average of £325,625.
What streets have the most affordable properties for sale in Ashurst?
The streets with the most affordable properties for sale in Ashurst are Fairlie at an average of £80,500, Falkland at an average of £93,000 and Langtree at an average of £97,000.
Which train stations are available in or near Ashurst?
Some of the train stations available in or near Ashurst are Parbold, Appley Bridge and Upholland.
Property Price Paid in Ashurst by Year
The average sold property price by year was:
| Year | Average Sold Price | Price Change |
Sold Properties
|
|---|---|---|---|
| 2025 | £202,417 | -5% |
64 Properties |
| 2024 | £212,007 | 8% |
90 Properties |
| 2023 | £194,262 | 18% |
70 Properties |
| 2022 | £159,188 | -11% |
76 Properties |
| 2021 | £176,128 | 9% |
141 Properties |
| 2020 | £159,665 | 12% |
143 Properties |
| 2019 | £140,807 | -12% |
145 Properties |
| 2018 | £157,671 | 14% |
128 Properties |
| 2017 | £136,096 | -3% |
91 Properties |
| 2016 | £140,808 | 6% |
73 Properties |
| 2015 | £132,947 | 16% |
68 Properties |
| 2014 | £112,283 | -31% |
49 Properties |
| 2013 | £146,597 | 20% |
45 Properties |
| 2012 | £117,869 | -12% |
39 Properties |
| 2011 | £131,576 | -2% |
44 Properties |
| 2010 | £133,878 | 9% |
60 Properties |
| 2009 | £121,454 | 5% |
33 Properties |
| 2008 | £115,323 | -14% |
40 Properties |
| 2007 | £131,216 | 4% |
104 Properties |
| 2006 | £125,550 | 1% |
130 Properties |
| 2005 | £123,995 | 7% |
93 Properties |
| 2004 | £115,692 | 14% |
140 Properties |
| 2003 | £99,889 | 19% |
117 Properties |
| 2002 | £81,337 | 21% |
118 Properties |
| 2001 | £64,262 | 9% |
120 Properties |
| 2000 | £58,658 | -5% |
131 Properties |
| 1999 | £61,709 | 2% |
166 Properties |
| 1998 | £60,285 | -1% |
148 Properties |
| 1997 | £60,725 | 13% |
133 Properties |
| 1996 | £53,037 | 1% |
99 Properties |
| 1995 | £52,684 | - |
67 Properties |
Property Price per Property Type in Ashurst
Here you can find historic sold price data in order to help with your property search.
The average Property Paid Price for specific property types in the last three years are:
| Property Type | Average Sold Price | Sold Properties |
|---|---|---|
| Semi Detached House | £176,563.00 | 93 Semi Detached Houses |
| Detached House | £293,939.00 | 76 Detached Houses |
| Terraced House | £127,234.00 | 49 Terraced Houses |
| Flat | £106,583.00 | 6 Flats |

