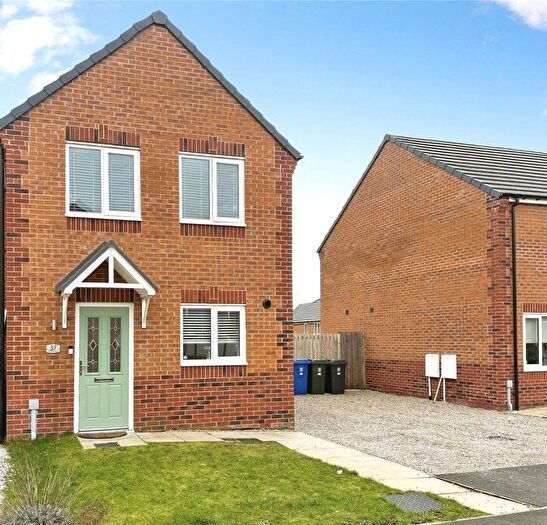
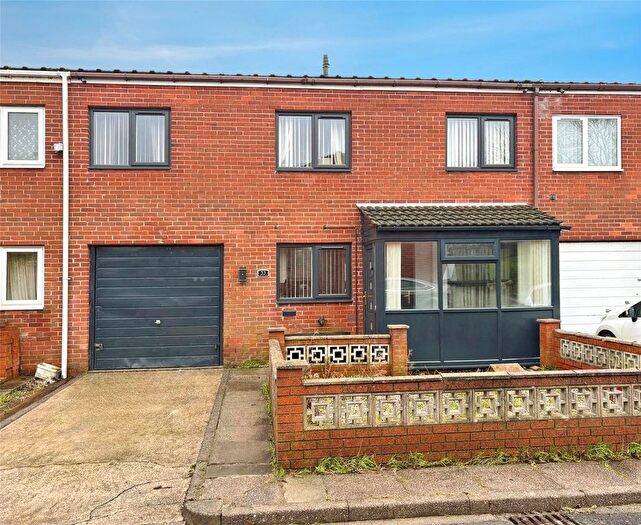
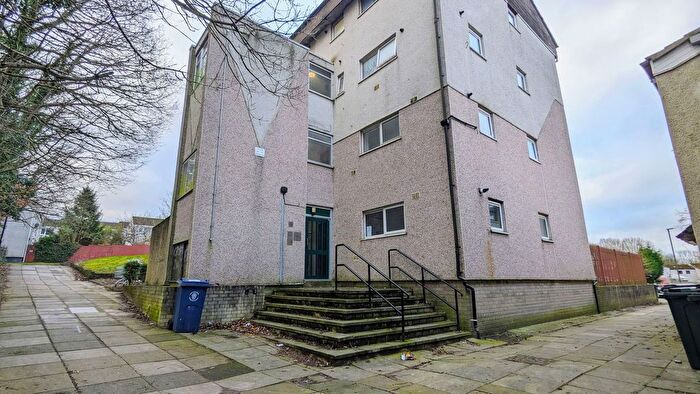
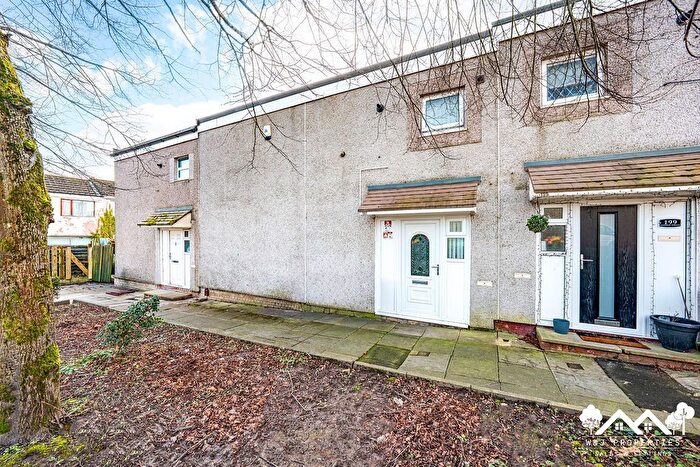
Houses for sale & to rent in Digmoor, Skelmersdale
House Prices in Digmoor
Properties in Digmoor have an average house price of £114,205.00 and had 129 Property Transactions within the last 3 years¹.
Digmoor is an area in Skelmersdale, Lancashire with 1,846 households², where the most expensive property was sold for £295,000.00.
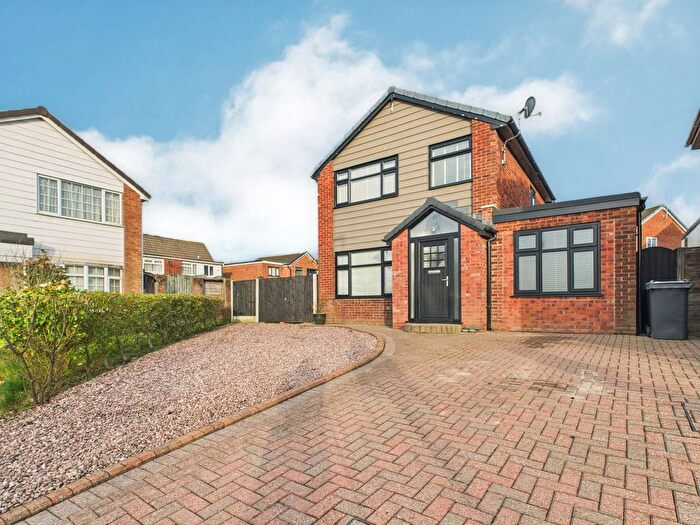
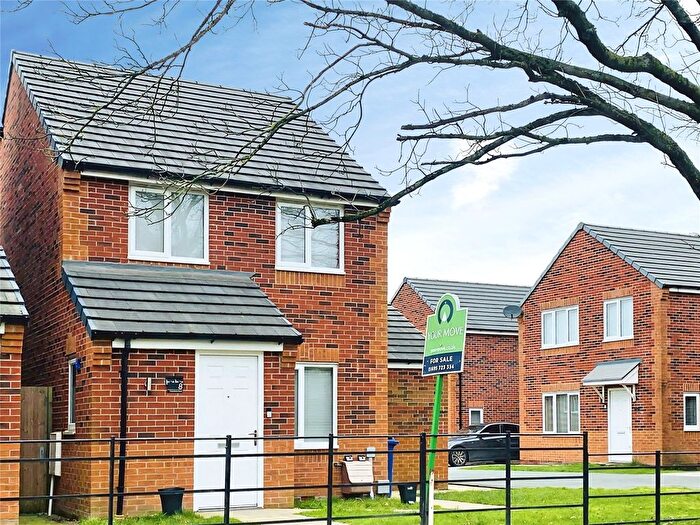
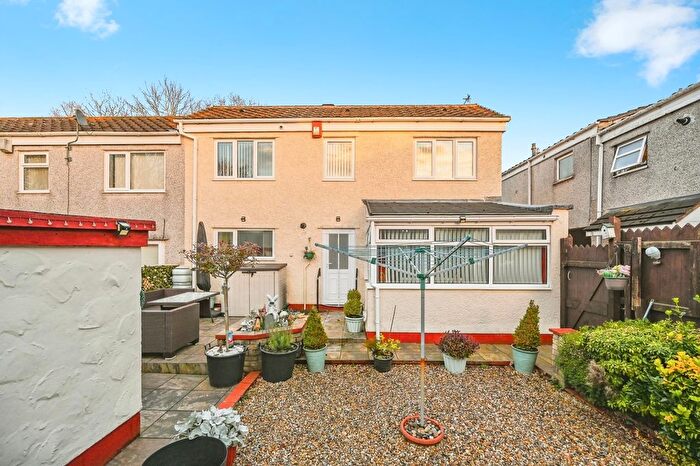
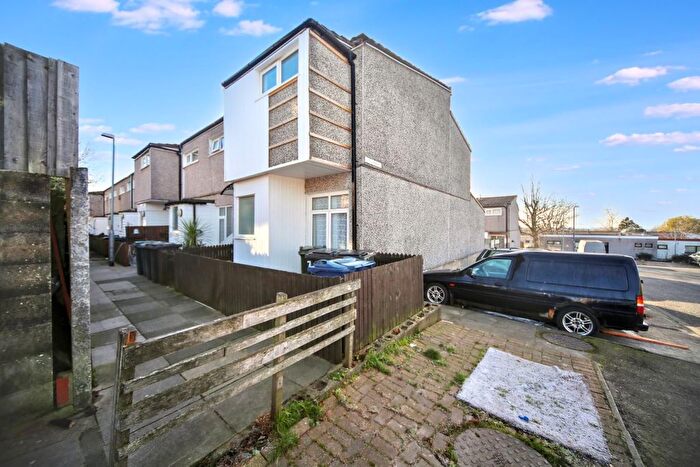
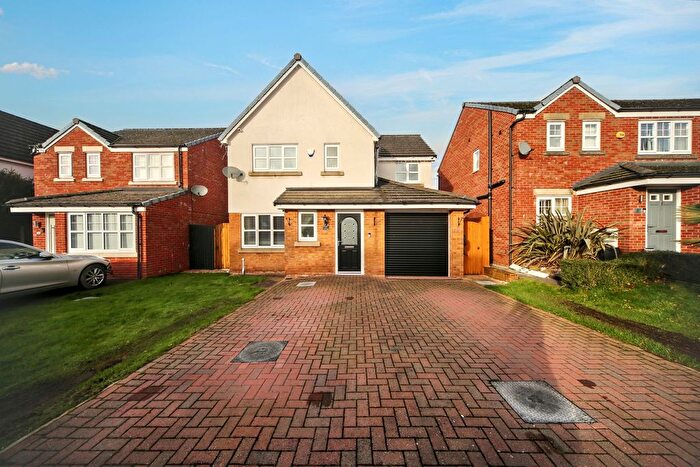
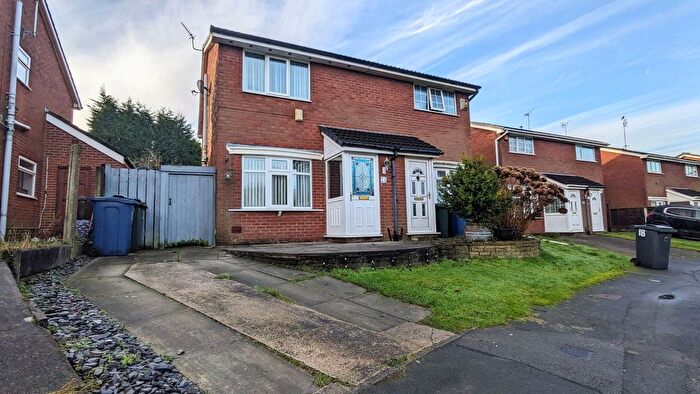
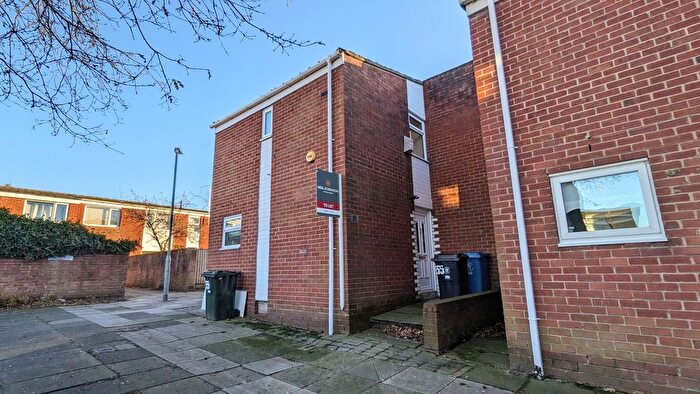
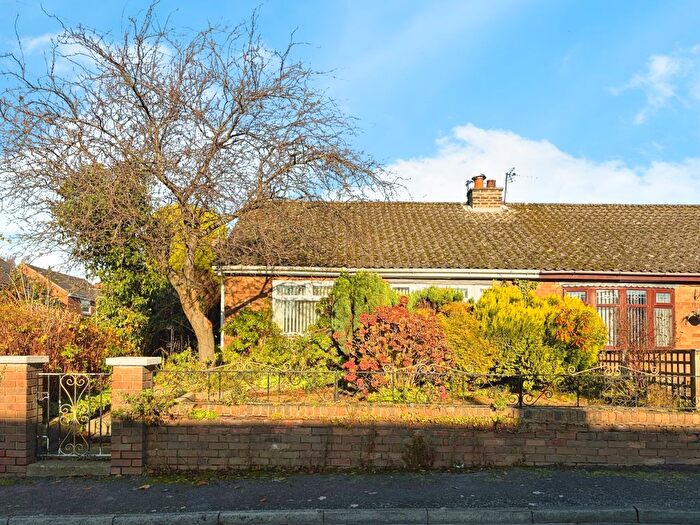
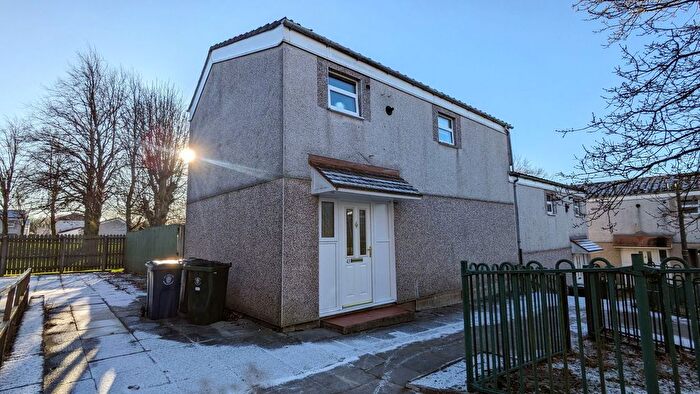
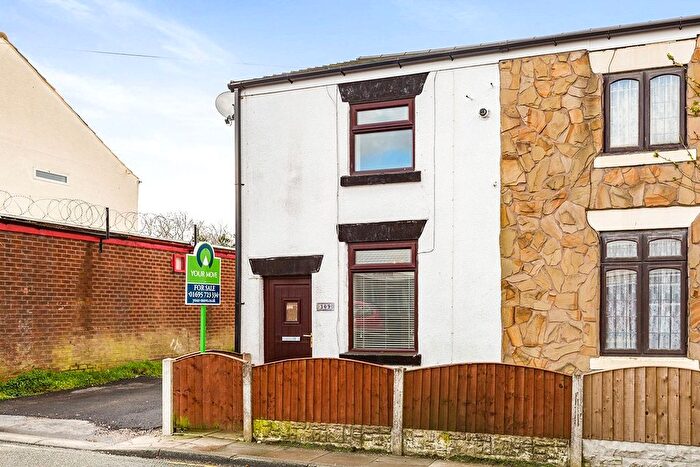
Properties for sale in Digmoor
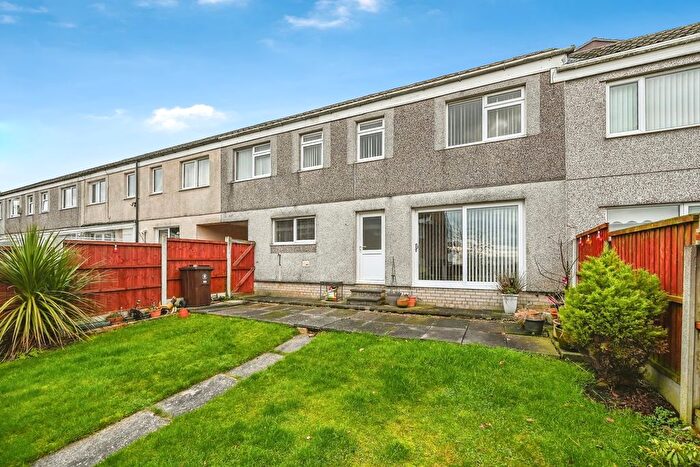
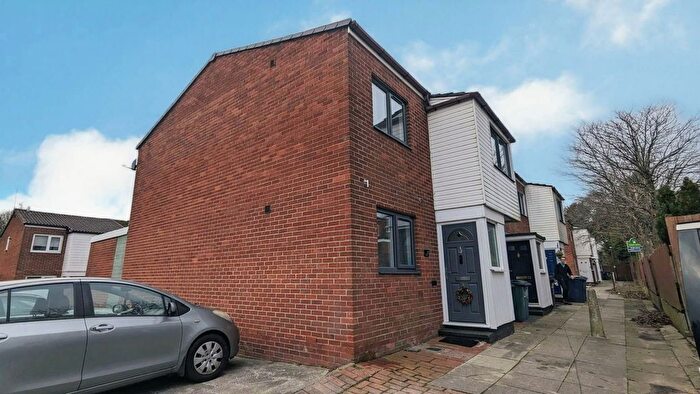
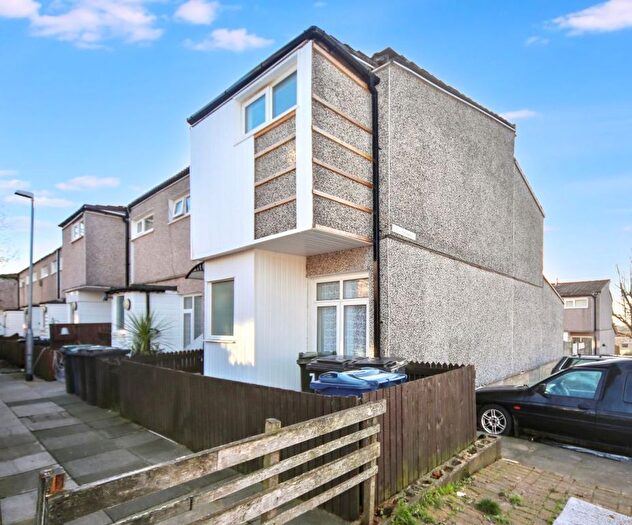
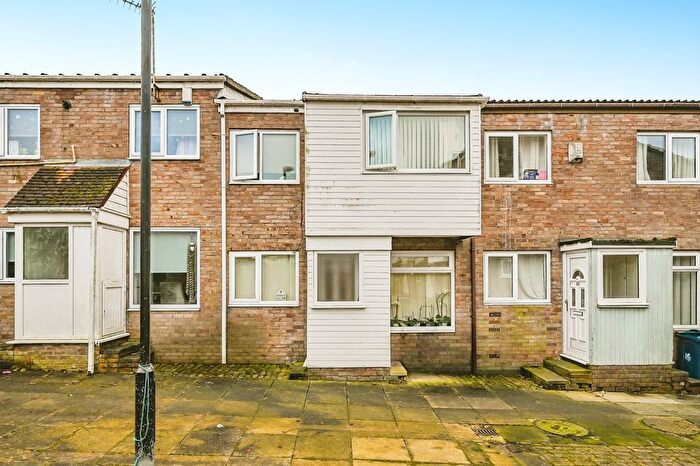
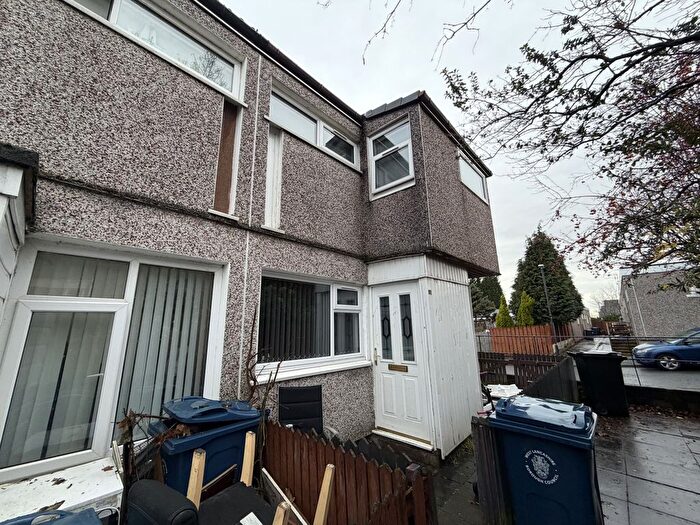
Previously listed properties in Digmoor
Roads and Postcodes in Digmoor
Navigate through our locations to find the location of your next house in Digmoor, Skelmersdale for sale or to rent.
| Streets | Postcodes |
|---|---|
| Abbeystead | WN8 9LP WN8 9NE |
| Abbeywood | WN8 9LR WN8 9LS |
| Acregate | WN8 9LT WN8 9LU WN8 9LX |
| Alderley | WN8 9LY WN8 9LZ WN8 9NA WN8 9NB |
| Ambergate | WN8 9JN |
| Ambleside Close | WN8 9NX |
| Amersham | WN8 9JW |
| Bankfield | WN8 9EW |
| Banksbarn | WN8 9EP WN8 9ER WN8 9ES WN8 9EX |
| Bearncroft | WN8 9HD WN8 9HE WN8 9HF WN8 9HG |
| Beechtrees | WN8 9ET WN8 9EU WN8 9EY WN8 9EZ WN8 9HA WN8 9HB |
| Beechwood Court | WN8 9HT |
| Belfield | WN8 9HH WN8 9HJ WN8 9HQ |
| Blakehall | WN8 9AZ WN8 9BA WN8 9BB |
| Blythewood | WN8 9EN |
| Cascades | WN8 9NG |
| Crossfield Road | WN8 9NQ |
| Daniels Lane | WN8 9NH |
| Digmoor Drive | WN8 9NJ |
| Digmoor Road | WN8 9NN |
| Eskbank | WN8 6EE WN8 6EF WN8 6EG WN8 6EQ |
| Fir Tree Close | WN8 9AW |
| Greenway Avenue | WN8 9JY |
| Hillcrest | WN8 9JZ |
| Hurlston Avenue | WN8 9NR |
| Lynwood Close | WN8 9AP |
| Miller Close | WN8 9AX |
| Ormskirk Road | WN8 9AL WN8 9AN WN8 9NP |
| Potter Close | WN8 9AU |
| Scarth Park | WN8 9NS |
| Spencers Lane | WN8 9JR WN8 9JS WN8 9JU |
| The Mount | WN8 9JX |
| Top Acre Road | WN8 9NT |
| WN8 9BN WN8 9HN WN8 9HU WN8 9ND WN8 9NF WN8 9NU WN8 9NW |
Transport near Digmoor
- FAQ
- Price Paid By Year
- Property Type Price
Frequently asked questions about Digmoor
What is the average price for a property for sale in Digmoor?
The average price for a property for sale in Digmoor is £114,205. This amount is 32% lower than the average price in Skelmersdale. There are 386 property listings for sale in Digmoor.
What streets have the most expensive properties for sale in Digmoor?
The streets with the most expensive properties for sale in Digmoor are Scarth Park at an average of £275,000, Top Acre Road at an average of £252,666 and Crossfield Road at an average of £252,100.
What streets have the most affordable properties for sale in Digmoor?
The streets with the most affordable properties for sale in Digmoor are Ambleside Close at an average of £57,416, Beechtrees at an average of £61,627 and Banksbarn at an average of £67,668.
Which train stations are available in or near Digmoor?
Some of the train stations available in or near Digmoor are Upholland, Rainford and Orrell.
Property Price Paid in Digmoor by Year
The average sold property price by year was:
| Year | Average Sold Price | Price Change |
Sold Properties
|
|---|---|---|---|
| 2025 | £119,937 | 5% |
31 Properties |
| 2024 | £113,475 | 2% |
47 Properties |
| 2023 | £111,395 | 6% |
51 Properties |
| 2022 | £104,310 | -14% |
57 Properties |
| 2021 | £119,138 | 24% |
64 Properties |
| 2020 | £90,990 | -7% |
33 Properties |
| 2019 | £97,298 | 27% |
31 Properties |
| 2018 | £70,680 | -28% |
33 Properties |
| 2017 | £90,464 | -7% |
28 Properties |
| 2016 | £97,078 | 29% |
30 Properties |
| 2015 | £68,980 | -22% |
31 Properties |
| 2014 | £84,331 | 24% |
24 Properties |
| 2013 | £64,215 | -24% |
19 Properties |
| 2012 | £79,382 | 3% |
17 Properties |
| 2011 | £77,025 | -34% |
16 Properties |
| 2010 | £103,236 | 30% |
19 Properties |
| 2009 | £72,055 | -11% |
9 Properties |
| 2008 | £80,283 | -8% |
36 Properties |
| 2007 | £87,017 | 18% |
63 Properties |
| 2006 | £70,951 | -8% |
93 Properties |
| 2005 | £76,580 | 13% |
74 Properties |
| 2004 | £66,902 | 32% |
75 Properties |
| 2003 | £45,415 | 5% |
86 Properties |
| 2002 | £43,171 | -0,4% |
64 Properties |
| 2001 | £43,330 | 20% |
53 Properties |
| 2000 | £34,638 | -60% |
47 Properties |
| 1999 | £55,350 | 7% |
55 Properties |
| 1998 | £51,704 | 31% |
67 Properties |
| 1997 | £35,843 | 15% |
36 Properties |
| 1996 | £30,392 | -6% |
30 Properties |
| 1995 | £32,350 | - |
34 Properties |
Property Price per Property Type in Digmoor
Here you can find historic sold price data in order to help with your property search.
The average Property Paid Price for specific property types in the last three years are:
| Property Type | Average Sold Price | Sold Properties |
|---|---|---|
| Semi Detached House | £139,020.00 | 24 Semi Detached Houses |
| Detached House | £240,461.00 | 13 Detached Houses |
| Terraced House | £87,921.00 | 88 Terraced Houses |
| Flat | £133,250.00 | 4 Flats |

