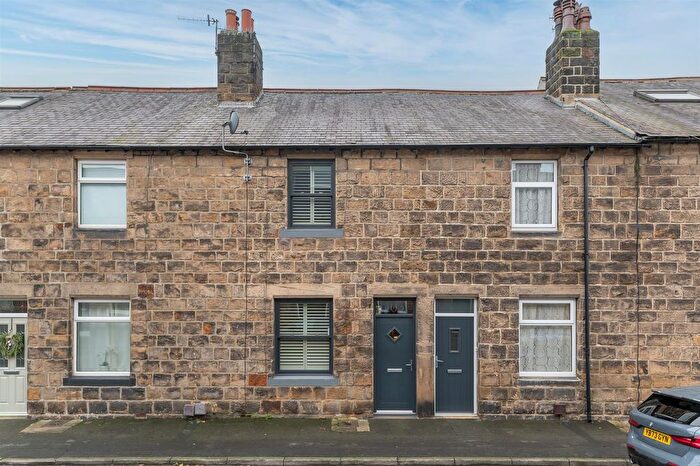
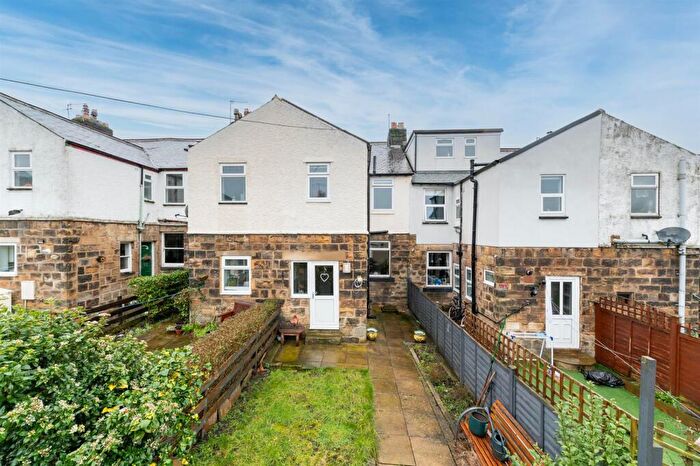
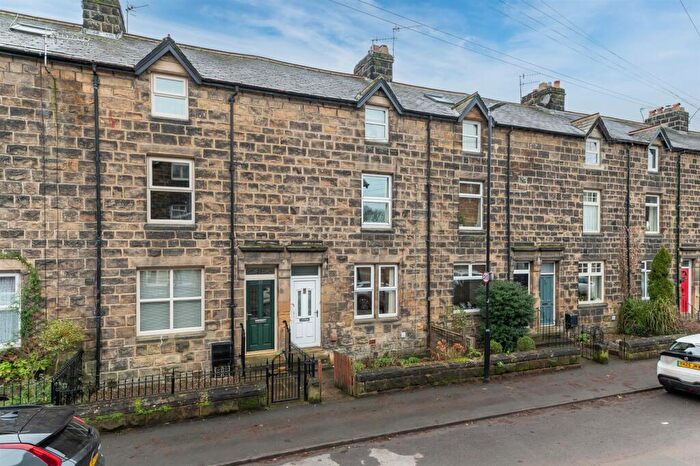
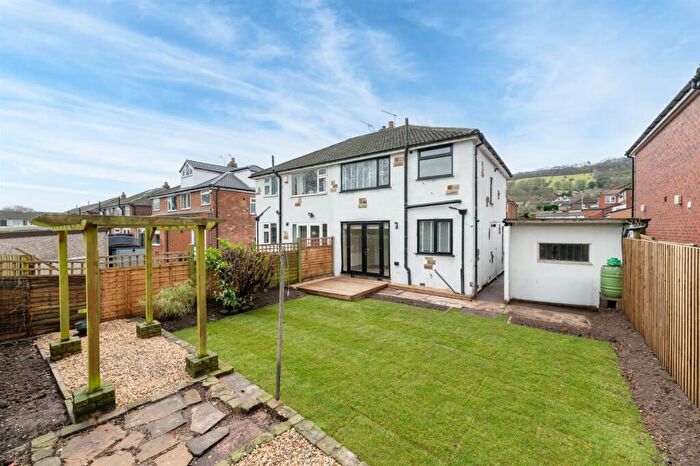
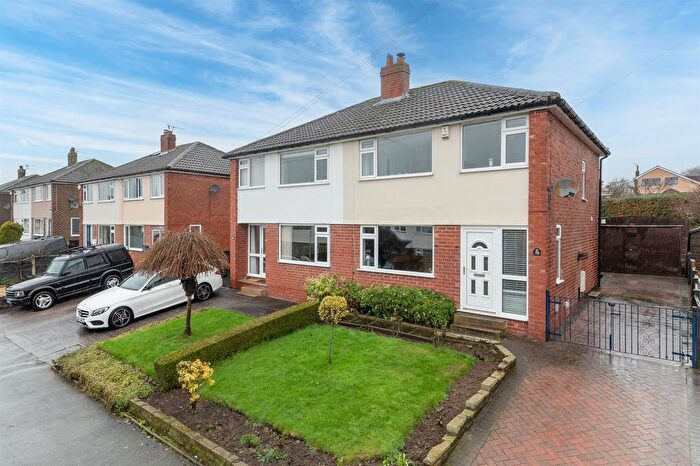
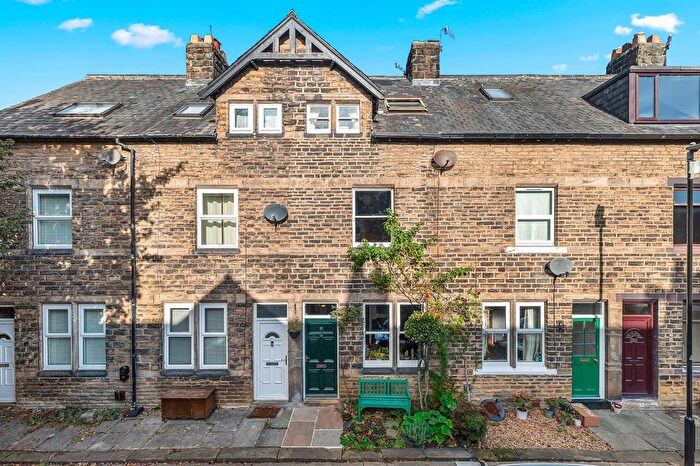
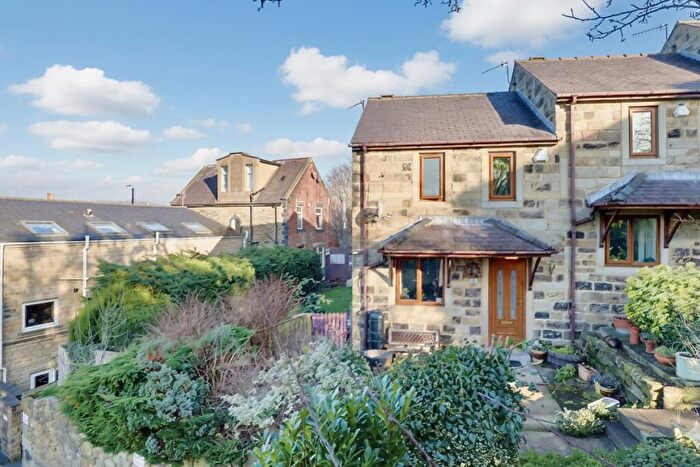
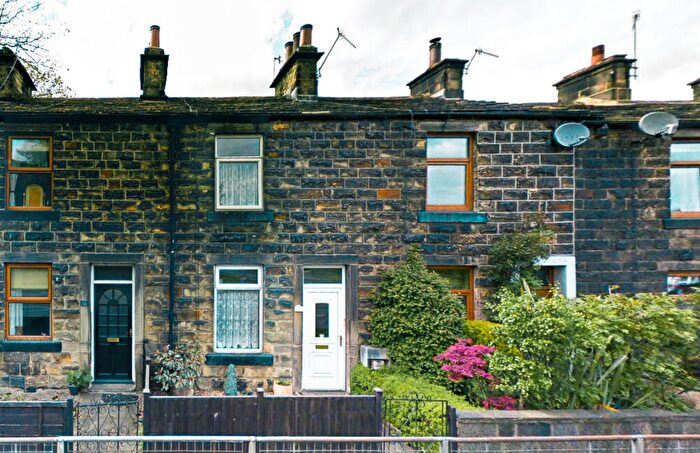
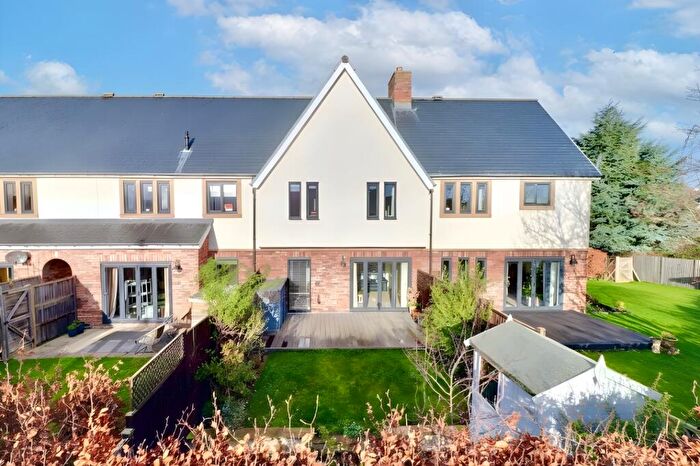
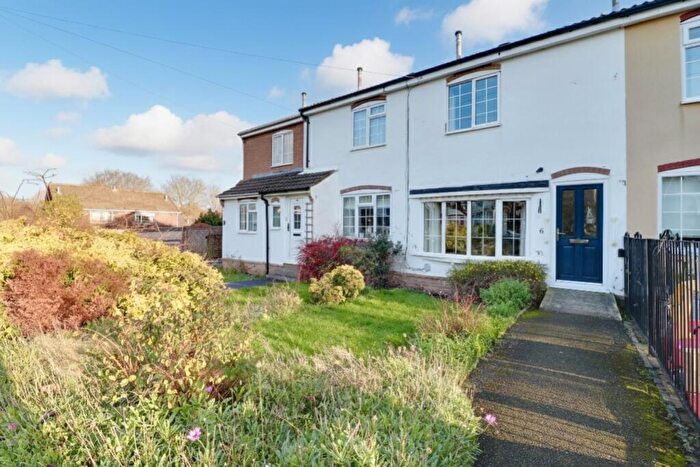
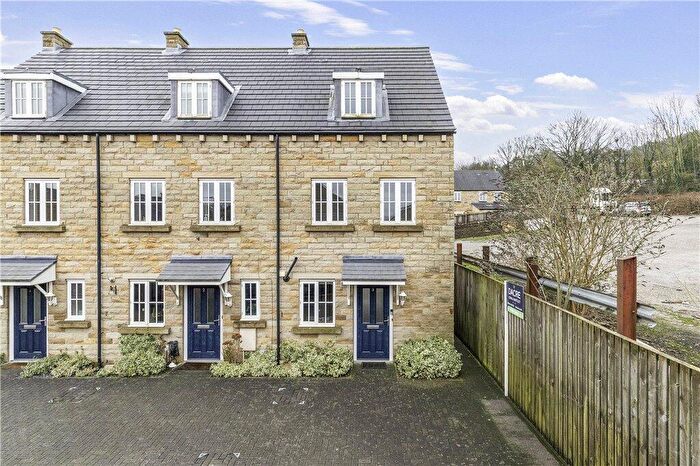
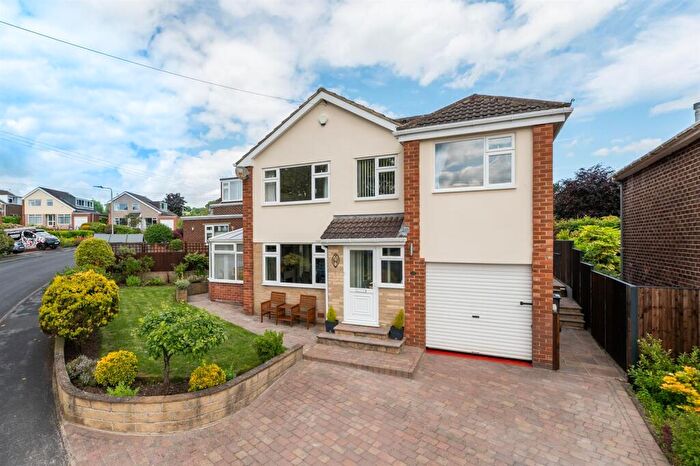
Houses for sale & to rent in Otley & Yeadon, Otley
House Prices in Otley & Yeadon
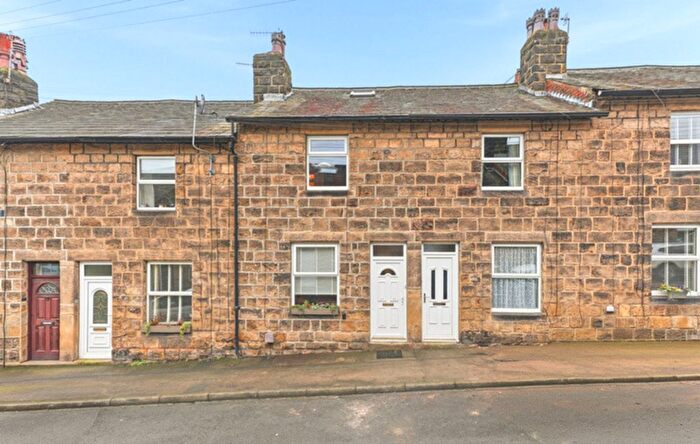
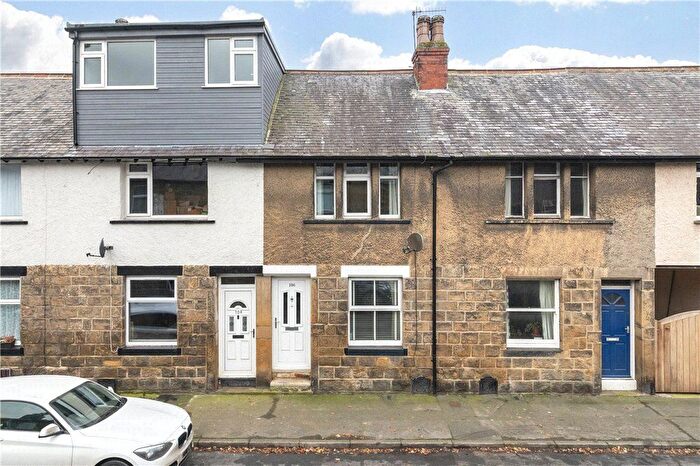
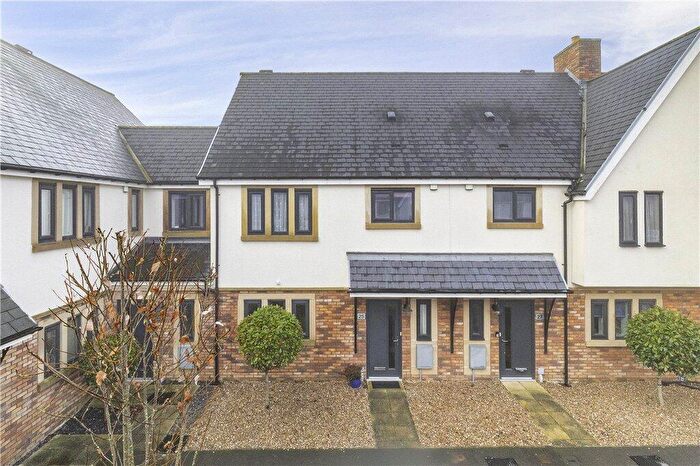
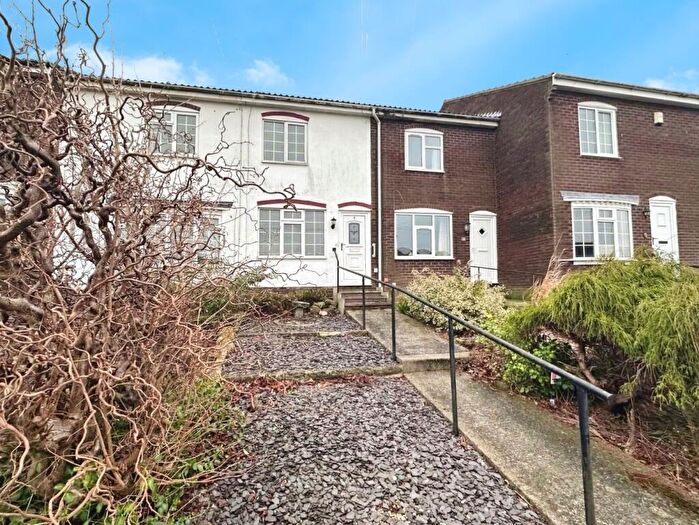
Properties in Otley & Yeadon have an average house price of £323,667.00 and had 56 Property Transactions within the last 3 years¹.
Otley & Yeadon is an area in Otley, Leeds with 437 households², where the most expensive property was sold for £640,000.00.
Properties for sale in Otley & Yeadon
Roads and Postcodes in Otley & Yeadon
Navigate through our locations to find the location of your next house in Otley & Yeadon, Otley for sale or to rent.
| Streets | Postcodes |
|---|---|
| Adams Croft | LS21 3NQ |
| Back North Street | LS21 1FW |
| Bay Horse Court | LS21 1SB |
| Boroughgate | LS21 3AG |
| Bridge Street | LS21 1FQ LS21 3AZ |
| Brooklands Court | LS21 1FP |
| Candleworks Yard | LS21 3HZ |
| Church Lane | LS21 3HP |
| Claro Mews | LS21 1FA |
| Courthouse Street | LS21 1BG LS21 1SP |
| Crossgate | LS21 1BE LS21 3AA |
| Crow Lane | LS21 1BW LS21 1TZ |
| Crow Lane Mews | LS21 1JF |
| Dawsons Yard | LS21 3AU |
| Deanbeck Rise | LS21 2FG |
| Dennison Hill | LS21 1AY |
| East Busk Lane | LS21 1DT |
| Fairfax Street | LS21 1JW |
| Farnley Lane | LS21 2BB LS21 2BD |
| Forrest Villas | LS21 3JZ |
| Garnetts Court | LS21 1GA |
| Garnetts End | LS21 1GB |
| Garnetts Grove | LS21 1FX LS21 1GD |
| Garnetts Place | LS21 1GE |
| Gordon Larking Court | LS21 3NJ |
| Granville Court | LS21 3PB |
| Hillridge Drive | LS21 2FJ |
| Ilkley Road | LS21 1QS LS21 1FZ LS21 3EE |
| Kirkgate | LS21 3HJ |
| Kirkgate Arcade | LS21 3HW |
| Lea Croft | LS21 3JF |
| Leeds Road | LS21 1DN |
| Linfoot Court | LS21 3EF |
| Manor Square | LS21 3AR LS21 3AW LS21 3AY |
| Market Street | LS21 3AF |
| Mellor Close | LS21 2FB |
| Mercury Row | LS21 3HQ |
| Middleton Court | LS21 2FA |
| Mill Avenue | LS21 1FJ |
| Mill Row | LS21 1FF |
| Mill Walk | LS21 1FN |
| Mill Way | LS21 1FE LS21 1FU |
| Nelson Street | LS21 1EZ LS21 1QE LS21 1ST |
| New Inn Court | LS21 3AJ |
| Newall Carr Road | LS21 2LY |
| Newall Close | LS21 2RX |
| Newall Hall Mews | LS21 2PH |
| Old St. Clair Road | LS21 1BF |
| Orchard Gate | LS21 3NX |
| Pool Road | LS21 1DY LS21 1EA |
| Riverside Garth | LS21 1FS |
| Riverside Square | LS21 1FH |
| Riverside View | LS21 1FT |
| Riverside Walk | LS21 1FG |
| Sunnylee Estate | LS21 1AT |
| The Broadwalk | LS21 2RL |
| Union Court | LS21 3NW |
| West Busk Lane | LS21 3NG |
| Westgate | LS21 3AX LS21 3HD LS21 3BA |
| Weston Drive | LS21 2EW LS21 2RH |
| Weston Lane | LS21 2DD LS21 2HJ |
| Wharfe Meadow Avenue | LS21 2FF |
| Wharfedale Drive | LS21 2FD LS21 2FE |
| Whiteley Croft | LS21 3JA |
| Whiteley Croft Gardens | LS21 3PF |
| Yorkgate | LS21 3DF LS21 3NU |
| LS21 1QR LS21 1TD LS21 1XP LS21 1YA LS21 2FH LS21 2SU LS21 2XB LS21 3NT LS21 3PA LS21 3XZ LS21 9BT LS21 9BX LS21 9BY LS21 9BZ LS21 9DA LS21 9DB LS21 9DD LS21 9DE LS21 9DF LS21 9DL LS21 9DP LS21 9DQ LS21 9EE LS21 9EF LS21 9EJ LS21 9EL LS21 9EN LS21 9ER LS21 9EU LS21 9EW |
Transport near Otley & Yeadon
- FAQ
- Price Paid By Year
- Property Type Price
Frequently asked questions about Otley & Yeadon
What is the average price for a property for sale in Otley & Yeadon?
The average price for a property for sale in Otley & Yeadon is £323,667. This amount is 5% higher than the average price in Otley. There are 1,158 property listings for sale in Otley & Yeadon.
What streets have the most expensive properties for sale in Otley & Yeadon?
The streets with the most expensive properties for sale in Otley & Yeadon are Brooklands Court at an average of £640,000, Middleton Court at an average of £494,000 and Wharfe Meadow Avenue at an average of £491,225.
What streets have the most affordable properties for sale in Otley & Yeadon?
The streets with the most affordable properties for sale in Otley & Yeadon are Garnetts Court at an average of £201,500, Bridge Street at an average of £241,840 and Garnetts Grove at an average of £281,666.
Which train stations are available in or near Otley & Yeadon?
Some of the train stations available in or near Otley & Yeadon are Menston, Guiseley and Burley-In-Wharfedale.
Property Price Paid in Otley & Yeadon by Year
The average sold property price by year was:
| Year | Average Sold Price | Price Change |
Sold Properties
|
|---|---|---|---|
| 2025 | £349,972 | 4% |
18 Properties |
| 2024 | £335,184 | 19% |
24 Properties |
| 2023 | £270,103 | -36% |
14 Properties |
| 2022 | £366,264 | 11% |
17 Properties |
| 2021 | £325,875 | -14% |
34 Properties |
| 2020 | £370,481 | -3% |
45 Properties |
| 2019 | £380,222 | 34% |
20 Properties |
| 2018 | £249,221 | 2% |
43 Properties |
| 2017 | £243,332 | -14% |
95 Properties |
| 2016 | £277,546 | -8% |
94 Properties |
| 2015 | £299,687 | 5% |
76 Properties |
| 2014 | £285,578 | 67% |
22 Properties |
| 2011 | £95,000 | -76% |
1 Property |
| 2009 | £167,000 | -184% |
1 Property |
| 2008 | £475,000 | 72% |
1 Property |
| 2005 | £135,000 | 26% |
1 Property |
| 2003 | £100,000 | - |
2 Properties |
Property Price per Property Type in Otley & Yeadon
Here you can find historic sold price data in order to help with your property search.
The average Property Paid Price for specific property types in the last three years are:
| Property Type | Average Sold Price | Sold Properties |
|---|---|---|
| Detached House | £515,645.00 | 10 Detached Houses |
| Semi Detached House | £412,500.00 | 2 Semi Detached Houses |
| Terraced House | £345,301.00 | 13 Terraced Houses |
| Flat | £246,935.00 | 31 Flats |

