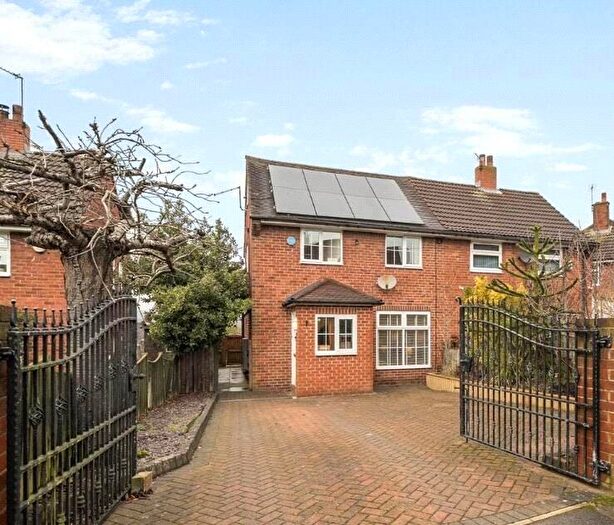
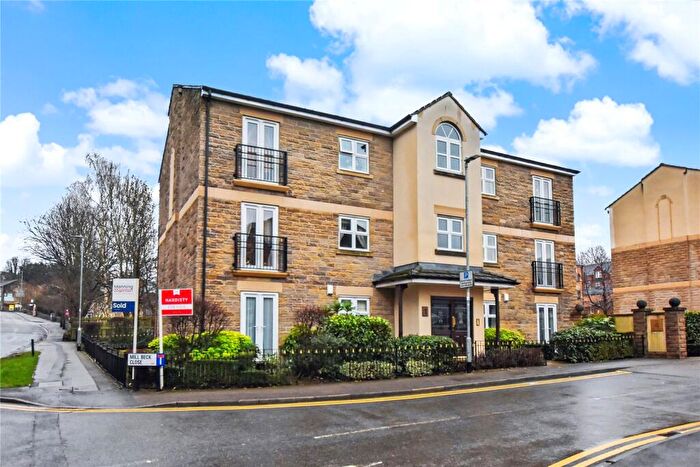
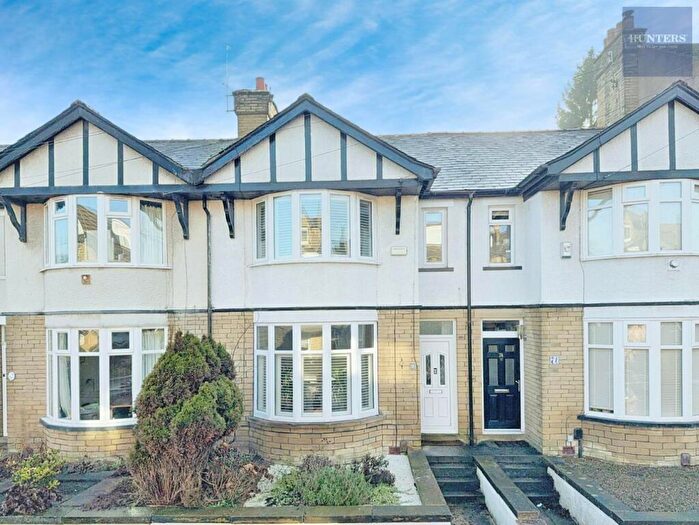
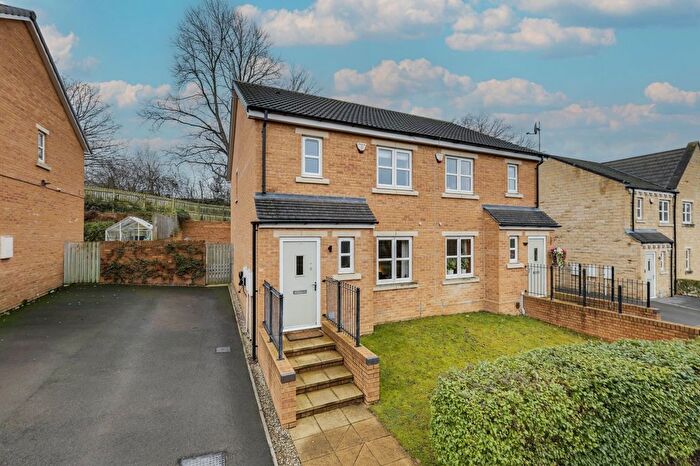
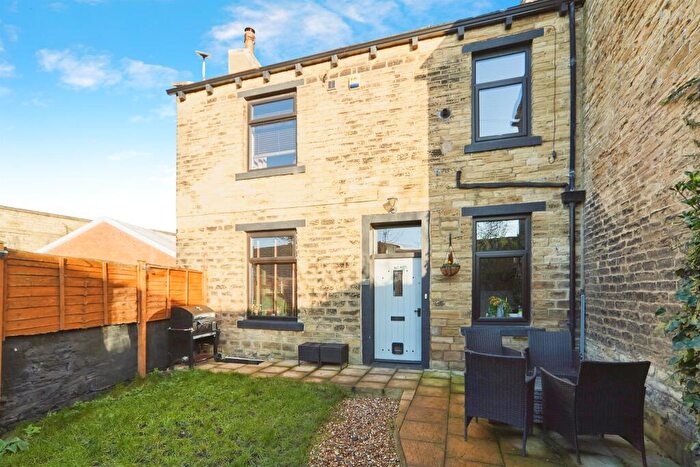
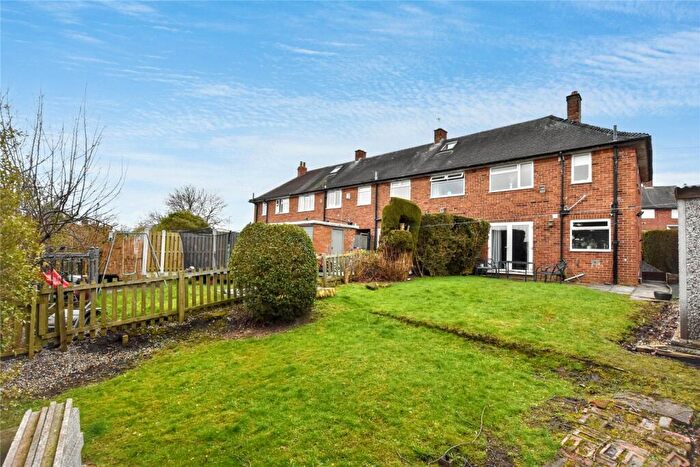
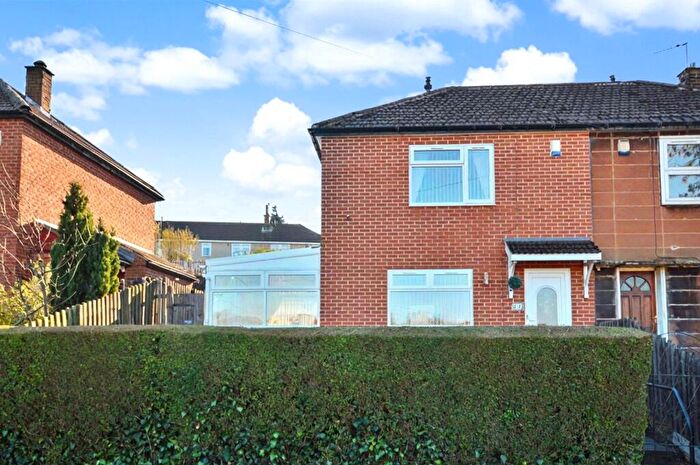
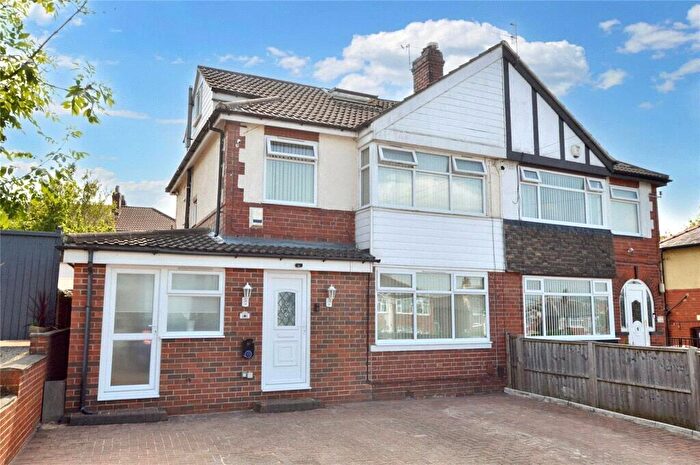
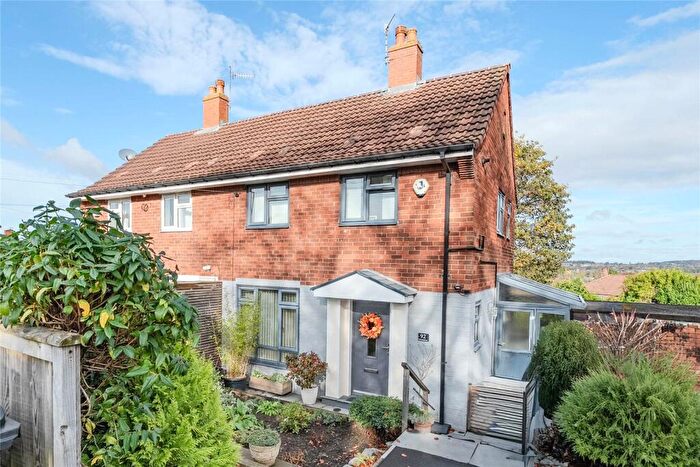
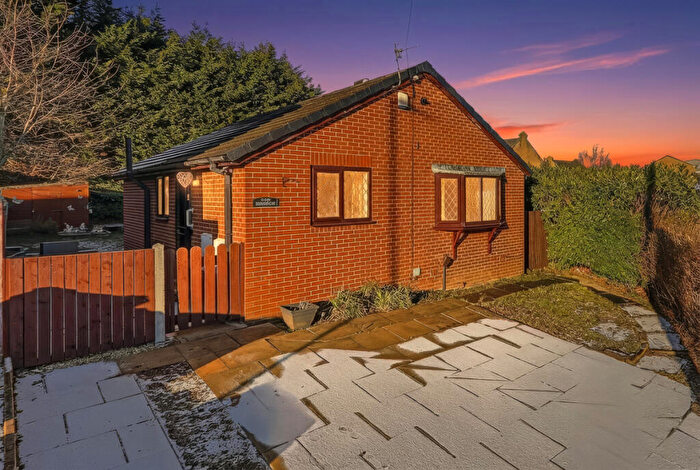
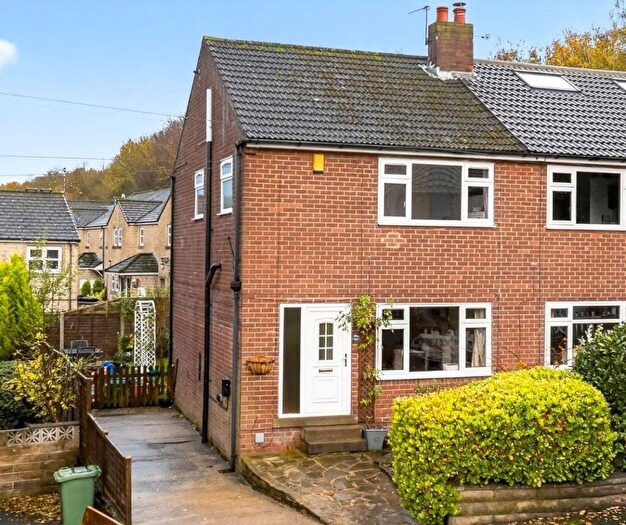
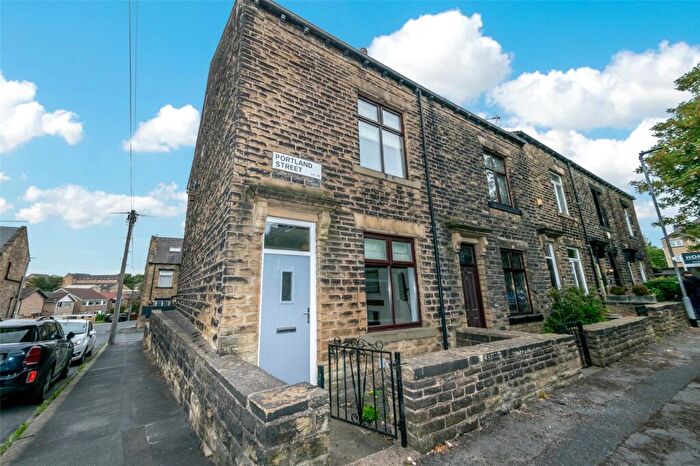
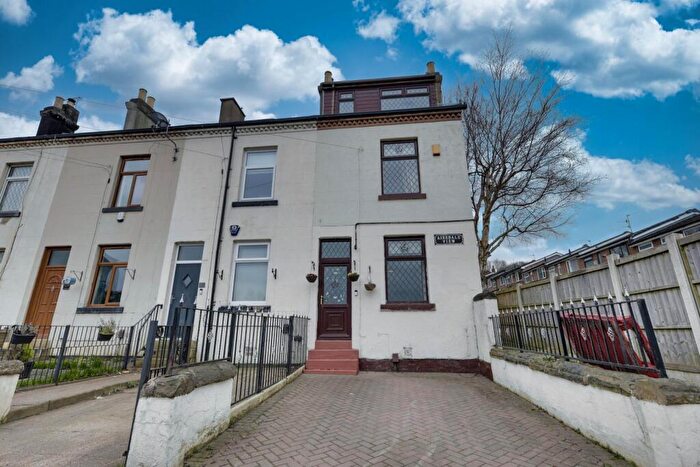
Houses for sale & to rent in Bramley And Stanningley, Pudsey
House Prices in Bramley And Stanningley
Properties in Bramley And Stanningley have an average house price of £203,108.00 and had 101 Property Transactions within the last 3 years¹.
Bramley And Stanningley is an area in Pudsey, Leeds with 763 households², where the most expensive property was sold for £435,000.00.
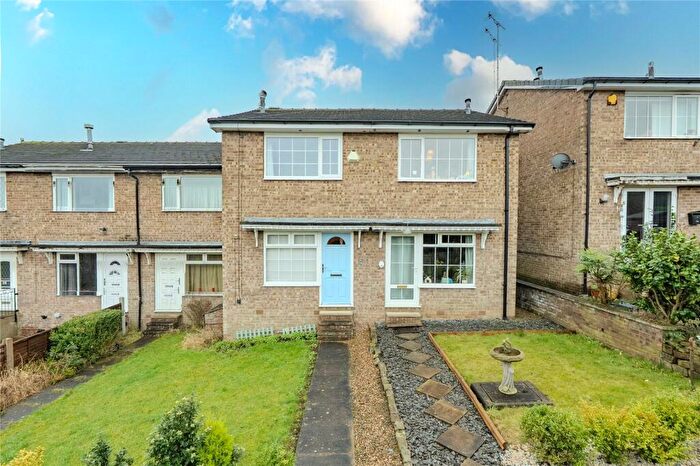
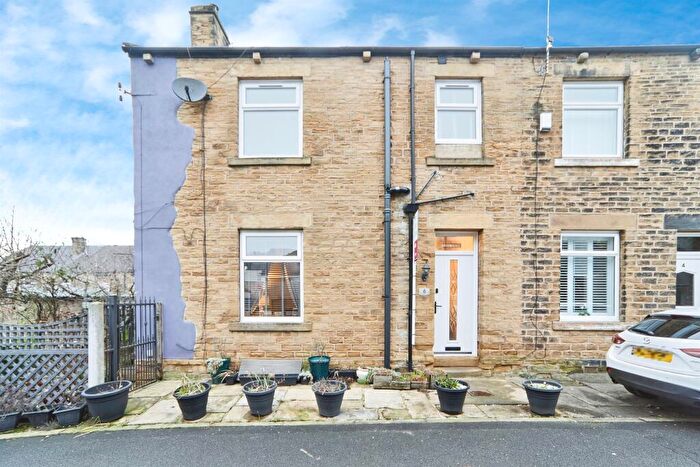
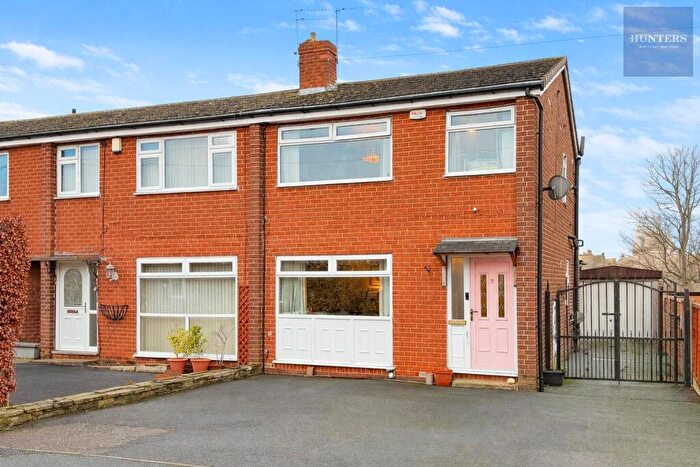
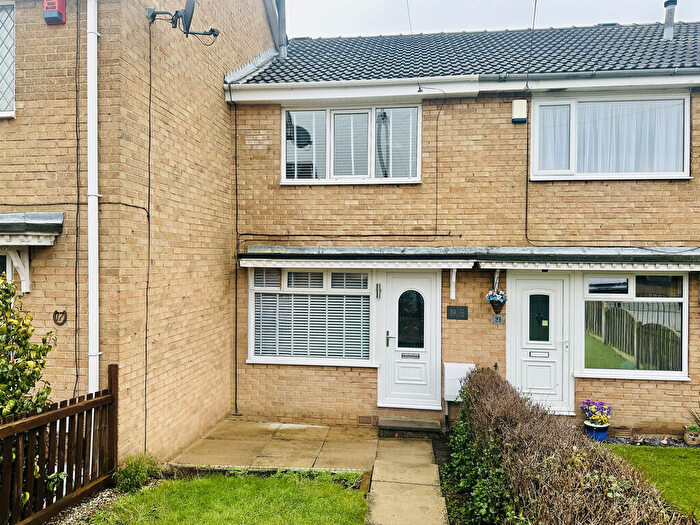
Properties for sale in Bramley And Stanningley
Roads and Postcodes in Bramley And Stanningley
Navigate through our locations to find the location of your next house in Bramley And Stanningley, Pudsey for sale or to rent.
| Streets | Postcodes |
|---|---|
| Adas Place | LS28 6JG |
| Arthur Street | LS28 6JD LS28 6JY |
| Bank Terrace | LS28 6JJ |
| Baptist Way | LS28 6LA |
| Bradley Hill View | LS28 6RT |
| Bright Street | LS28 6NJ |
| Britannia Close | LS28 6NS |
| Britannia Street | LS28 6NR |
| Broad Lane | LS28 6PD |
| Church Hill Gardens | LS28 6LP |
| Church Hill Green | LS28 6LW |
| Church Hill Mount | LS28 6LL |
| Fern Lea View | LS28 6JX |
| Fern Terrace | LS28 6JA |
| Gladstone Court | LS28 6PF |
| Gladstone Terrace | LS28 6NE |
| Glenlea Close | LS28 6QH |
| Glenlea Gardens | LS28 6PH |
| Granville Street | LS28 6NF |
| Half Mile Close | LS28 6HP |
| Half Mile Green | LS28 6HR LS28 6HS |
| Half Mile Lane | LS28 6LH |
| Harrisons Avenue | LS28 6NA |
| Hillside Mount | LS28 6HX |
| Hillside View | LS28 6HT |
| Intake Lane | LS28 6PL |
| Jordan Road | LS28 6LB |
| Leeds & Bradford Road | LS28 6LS LS28 6LT LS28 6PE |
| Magdalin Drive | LS28 6LD |
| North View Street | LS28 6HZ |
| North View Terrace | LS28 6HY |
| Norwood Crescent | LS28 6NG |
| Norwood Croft | LS28 6NH |
| Palmerston Close | LS28 6AD |
| Pavilion Close | LS28 6NL |
| Rosebery Terrace | LS28 6NQ |
| Stanningley Road | LS28 6NB |
| Swinnow Crescent | LS28 6NZ |
| Swinnow Lane | LS28 6NY |
| Town Street | LS28 6ER LS28 6ES LS28 6EZ |
| Vernon Place | LS28 6EX |
| Vickersdale Court | LS28 6JF |
| Vickersdale Grove | LS28 6JL |
| Victoria Terrace | LS28 6ND |
Transport near Bramley And Stanningley
-
Bramley (West Yorkshire) Station
-
New Pudsey Station
-
Kirkstall Forge Station
-
Headingley Station
-
Horsforth Station
- FAQ
- Price Paid By Year
- Property Type Price
Frequently asked questions about Bramley And Stanningley
What is the average price for a property for sale in Bramley And Stanningley?
The average price for a property for sale in Bramley And Stanningley is £203,108. This amount is 19% lower than the average price in Pudsey. There are 1,562 property listings for sale in Bramley And Stanningley.
What streets have the most expensive properties for sale in Bramley And Stanningley?
The streets with the most expensive properties for sale in Bramley And Stanningley are Intake Lane at an average of £340,000, Vernon Place at an average of £285,000 and Leeds & Bradford Road at an average of £258,500.
What streets have the most affordable properties for sale in Bramley And Stanningley?
The streets with the most affordable properties for sale in Bramley And Stanningley are Town Street at an average of £98,333, Church Hill Mount at an average of £120,000 and Pavilion Close at an average of £138,694.
Which train stations are available in or near Bramley And Stanningley?
Some of the train stations available in or near Bramley And Stanningley are Bramley (West Yorkshire), New Pudsey and Kirkstall Forge.
Property Price Paid in Bramley And Stanningley by Year
The average sold property price by year was:
| Year | Average Sold Price | Price Change |
Sold Properties
|
|---|---|---|---|
| 2025 | £203,937 | -5% |
28 Properties |
| 2024 | £213,955 | 10% |
34 Properties |
| 2023 | £193,057 | -6% |
39 Properties |
| 2022 | £204,298 | 20% |
35 Properties |
| 2021 | £164,015 | 2% |
45 Properties |
| 2020 | £160,294 | 7% |
34 Properties |
| 2019 | £148,516 | 9% |
27 Properties |
| 2018 | £135,616 | -9% |
43 Properties |
| 2017 | £148,296 | 8% |
31 Properties |
| 2016 | £136,259 | 10% |
46 Properties |
| 2015 | £122,528 | -2% |
41 Properties |
| 2014 | £125,583 | 13% |
55 Properties |
| 2013 | £109,849 | 4% |
20 Properties |
| 2012 | £105,651 | -5% |
15 Properties |
| 2011 | £111,333 | -16% |
15 Properties |
| 2010 | £129,040 | 6% |
23 Properties |
| 2009 | £121,935 | -1% |
19 Properties |
| 2008 | £123,095 | -11% |
23 Properties |
| 2007 | £136,772 | 11% |
57 Properties |
| 2006 | £121,474 | -2% |
67 Properties |
| 2005 | £123,611 | 6% |
50 Properties |
| 2004 | £116,332 | 16% |
93 Properties |
| 2003 | £98,004 | 25% |
54 Properties |
| 2002 | £73,719 | 12% |
76 Properties |
| 2001 | £65,074 | 24% |
64 Properties |
| 2000 | £49,199 | -13% |
41 Properties |
| 1999 | £55,661 | 1% |
32 Properties |
| 1998 | £55,221 | 11% |
27 Properties |
| 1997 | £48,961 | 14% |
29 Properties |
| 1996 | £42,001 | -17% |
23 Properties |
| 1995 | £48,972 | - |
42 Properties |
Property Price per Property Type in Bramley And Stanningley
Here you can find historic sold price data in order to help with your property search.
The average Property Paid Price for specific property types in the last three years are:
| Property Type | Average Sold Price | Sold Properties |
|---|---|---|
| Semi Detached House | £227,141.00 | 28 Semi Detached Houses |
| Detached House | £273,600.00 | 10 Detached Houses |
| Terraced House | £197,420.00 | 47 Terraced Houses |
| Flat | £133,703.00 | 16 Flats |

