
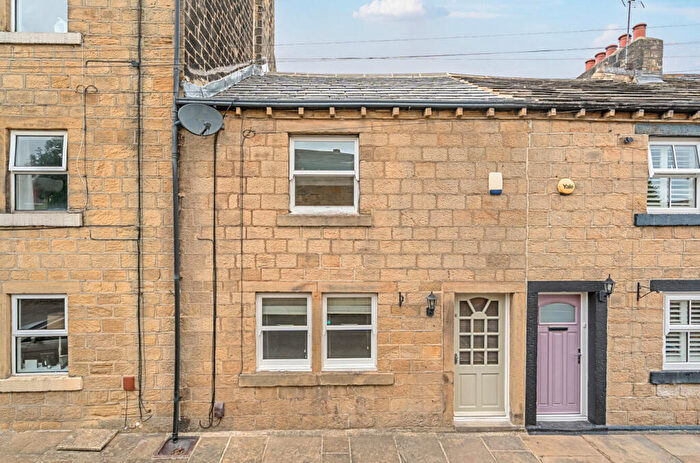
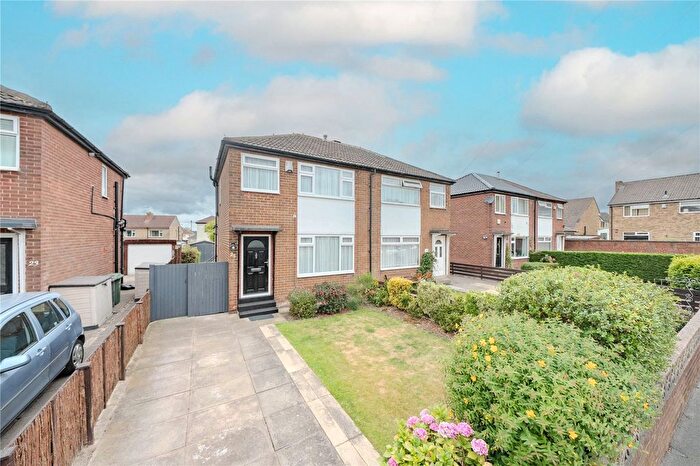
Houses for sale in Pudsey, Leeds
House Prices in Pudsey
Properties in Pudsey have an average house price of £252k and had 1,947 Property Transactions within the last 3 years.¹
Pudsey is an area in Leeds with 18,109 households², where the most expensive property was sold for £1.15M.
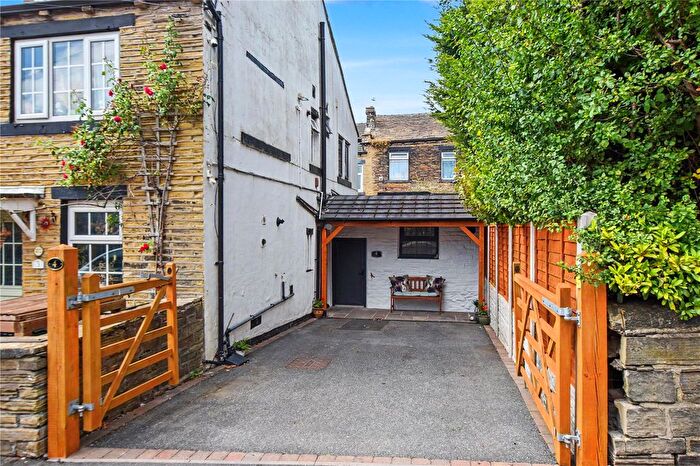
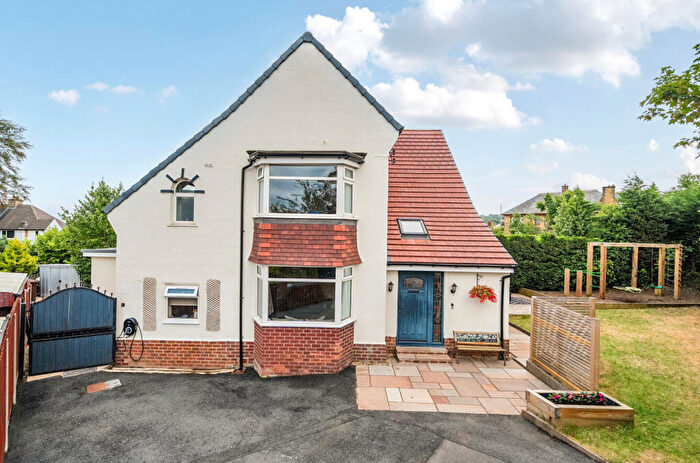
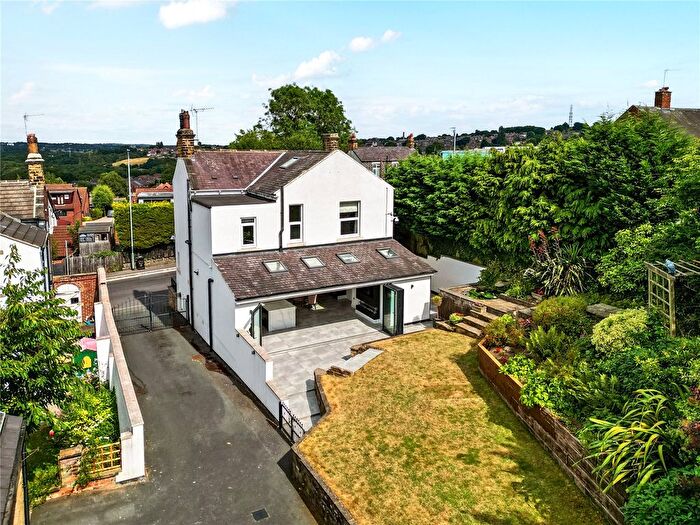
Properties for sale in Pudsey
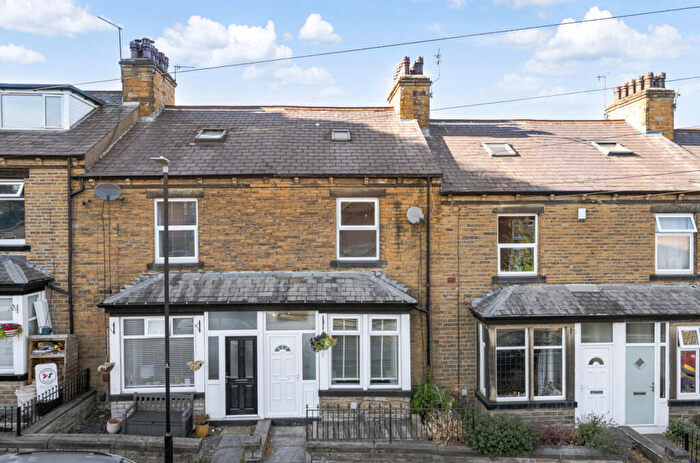

![]()
If you are looking to sell your house, let it out, or receive a property valuation, an expert can help you.
Click the button below to get started.
Neighbourhoods in Pudsey
Navigate through our locations to find the location of your next house in Pudsey, Leeds for sale or to rent.
Property price trends in Pudsey
According to the latest Land Registry data, the average home in Pudsey sold for £246,306 in 2026. That figure comes from a substantial record of 25,270 sales logged over the past 31 years.
Prices have held fairly steady over the last three years. Compared with 2023, when the typical sale came in around £244,322, values are broadly unchanged.
Looking back five years, average prices are up about 6.6% since 2021, a gain of around £15,150 in cash terms.
Zoom out to the past decade for the fuller picture. Back in 2016, homes here averaged £180,629, so the typical sold price has climbed about 36.4% since then, roughly 3.1% a year. Stretch the view to fifteen years and that annual pace eases back to about 2.9%.
Frequently asked questions about Pudsey
What is the average price for a property for sale in Pudsey?
The average price for a property for sale in Pudsey is £251,680. This amount is 4% lower than the average price in Leeds. There are 6,880 property listings for sale in Pudsey.
What locations have the most expensive properties for sale in Pudsey?
The locations with the most expensive properties for sale in Pudsey are Bramley & Stanningley at an average of £455,000, Calverley & Farsley at an average of £341,991 and Calverley And Farsley at an average of £258,519.
What locations have the most affordable properties for sale in Pudsey?
The locations with the most affordable properties for sale in Pudsey are Bramley And Stanningley at an average of £202,686 and Pudsey at an average of £245,928.
Which train stations are available in or near Pudsey?
Some of the train stations available in or near Pudsey are New Pudsey, Bramley (West Yorkshire) and Kirkstall Forge.
Property Price Paid in Pudsey by Year
The average sold property price by year was:
| Year | Average Sold Price | Price Change |
Sold Properties
|
|---|---|---|---|
| 2026 | £246,306 | -5% |
31 Properties |
| 2025 | £258,614 | 3% |
653 Properties |
| 2024 | £251,944 | 3% |
647 Properties |
| 2023 | £244,322 | 2% |
616 Properties |
| 2022 | £240,509 | 4% |
729 Properties |
| 2021 | £231,156 | 5% |
919 Properties |
| 2020 | £220,271 | 8% |
672 Properties |
| 2019 | £201,710 | 7% |
850 Properties |
| 2018 | £187,192 | 2% |
903 Properties |
| 2017 | £184,004 | 2% |
768 Properties |
Property Price per Property Type in Pudsey
Here you can find historic sold price data in order to help with your property search.
The average Property Paid Price for specific property types in the last three years are:
| Property Type | Average Sold Price | Sold Properties |
|---|---|---|
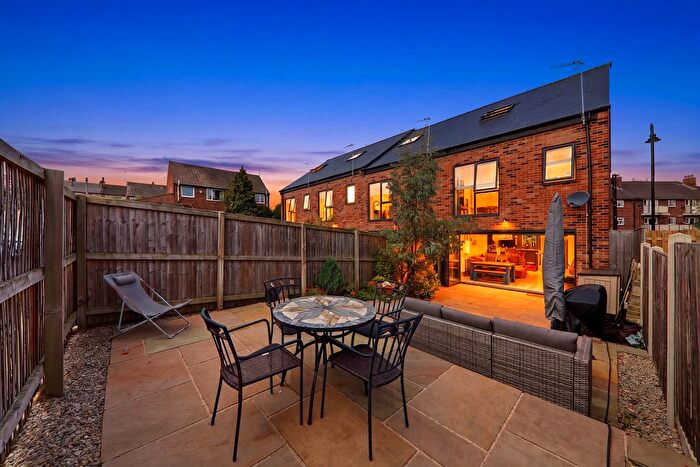
| Semi Detached House | £261,316.00 | 714 Semi Detached Houses |
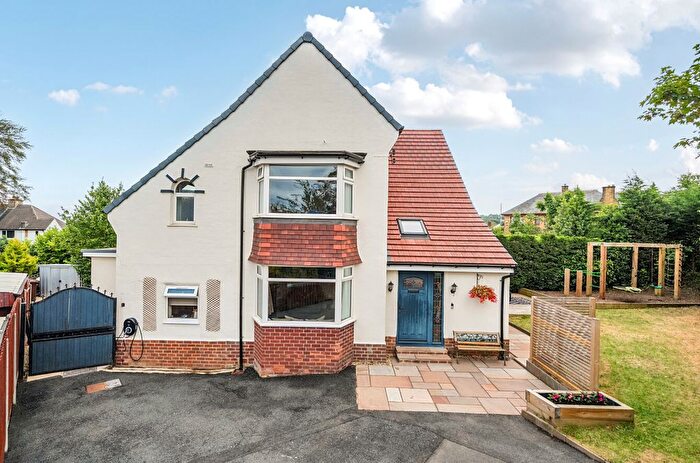
| Detached House | £409,246.00 | 245 Detached Houses |
| Terraced House | £218,151.00 | 816 Terraced Houses |
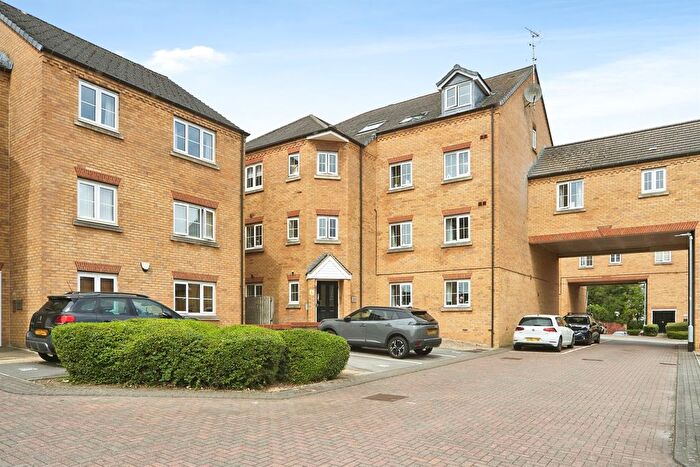
| Flat | £146,309.00 | 172 Flats |
Transport in Pudsey
Please see below transportation links in this area:
