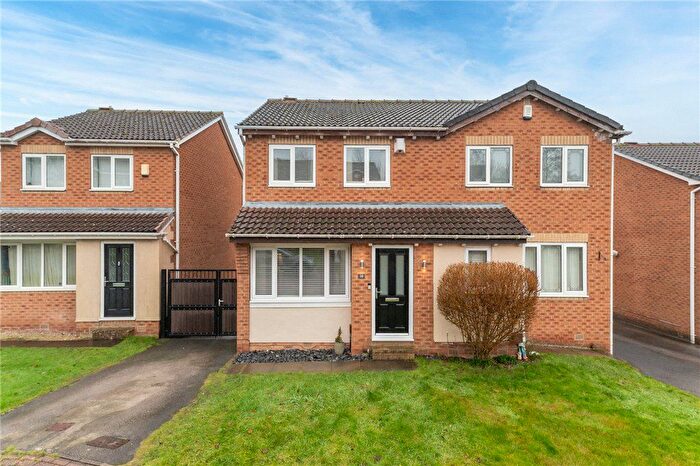
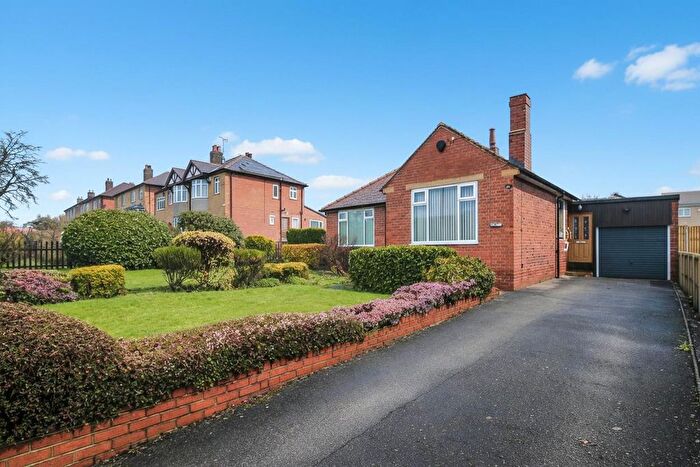
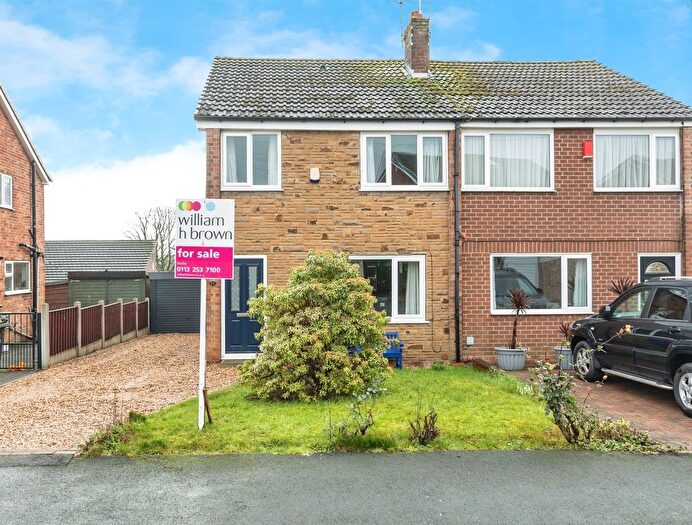
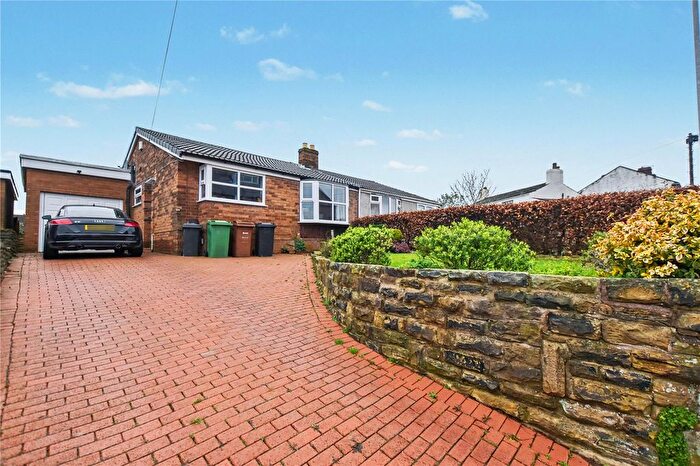
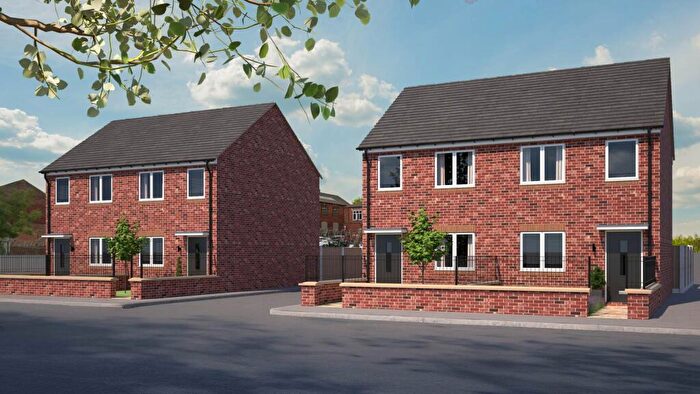
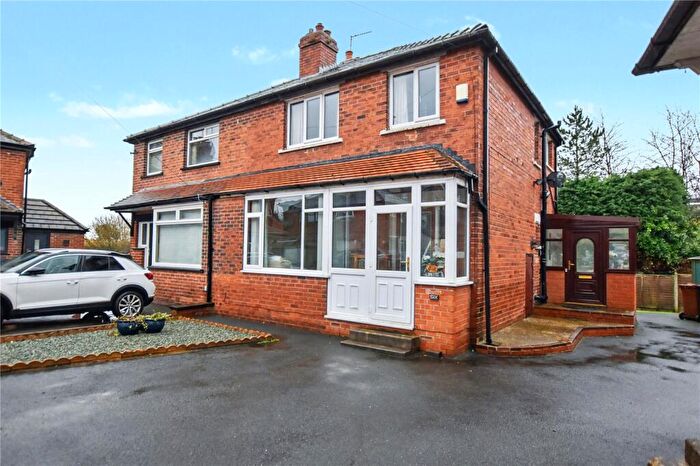
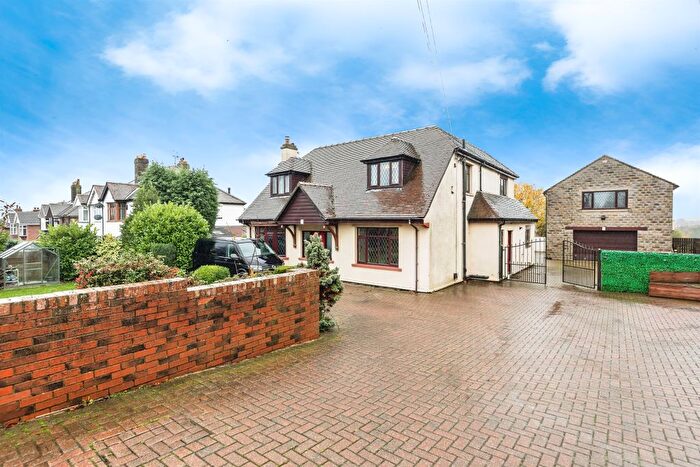
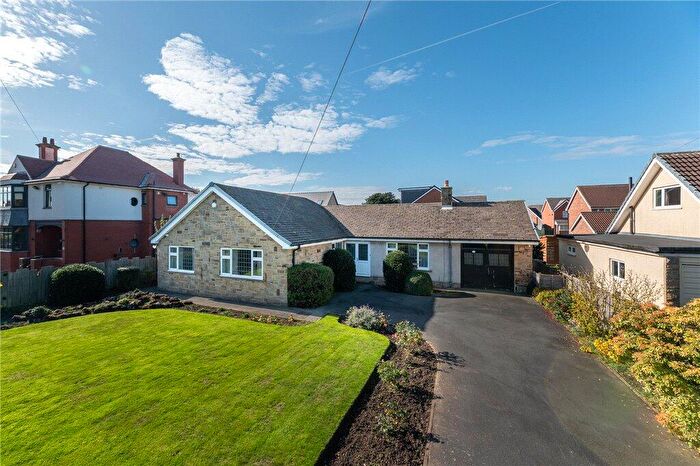
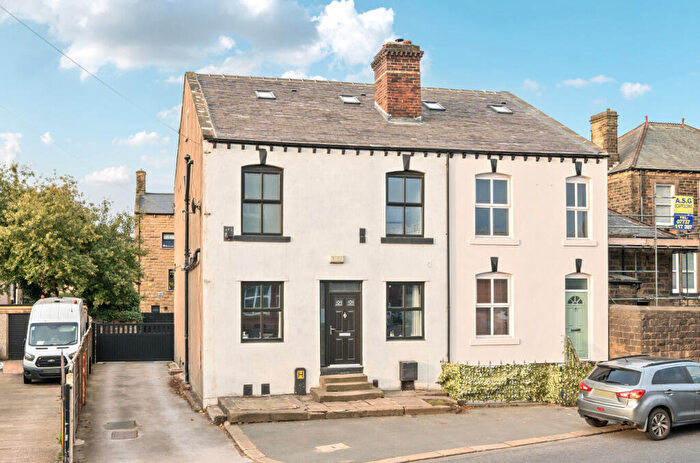
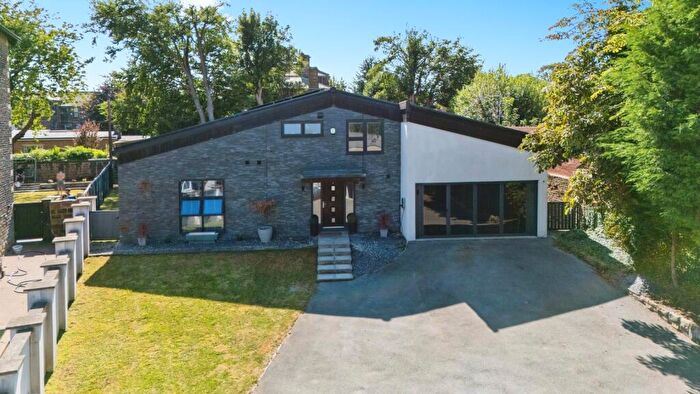
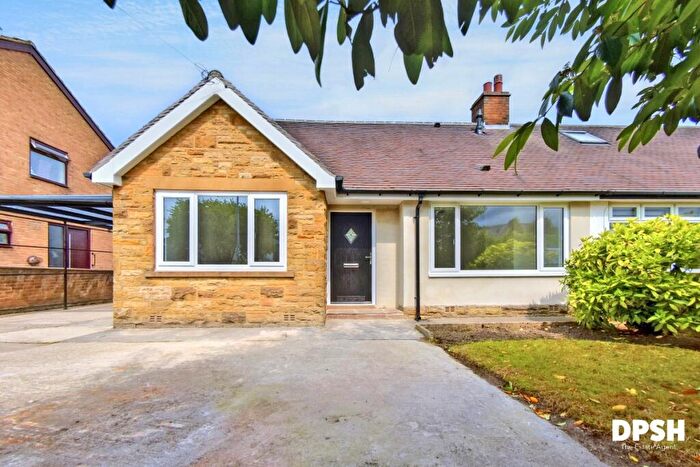
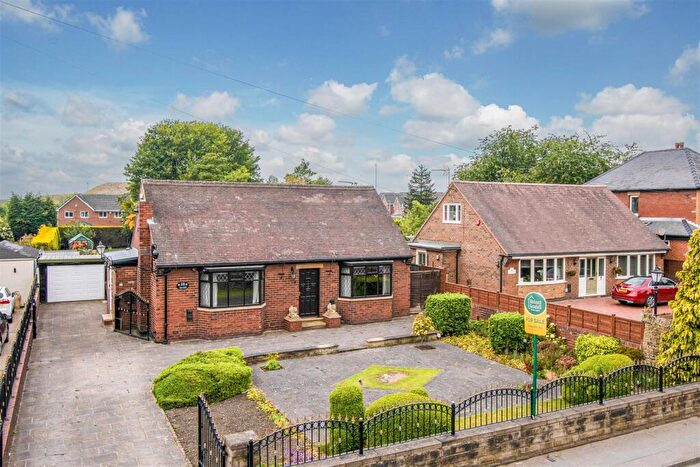
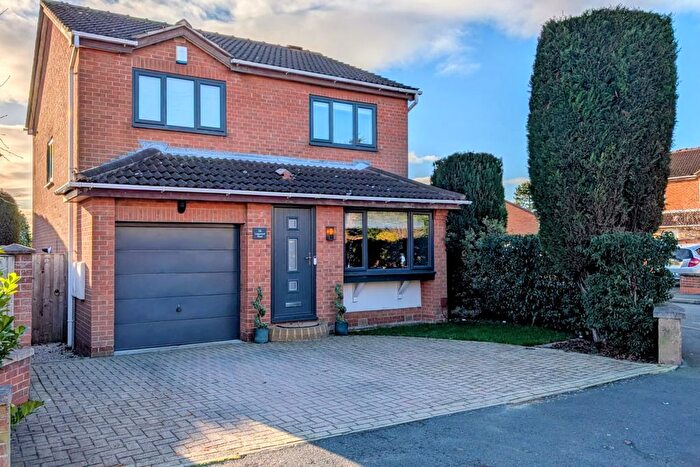
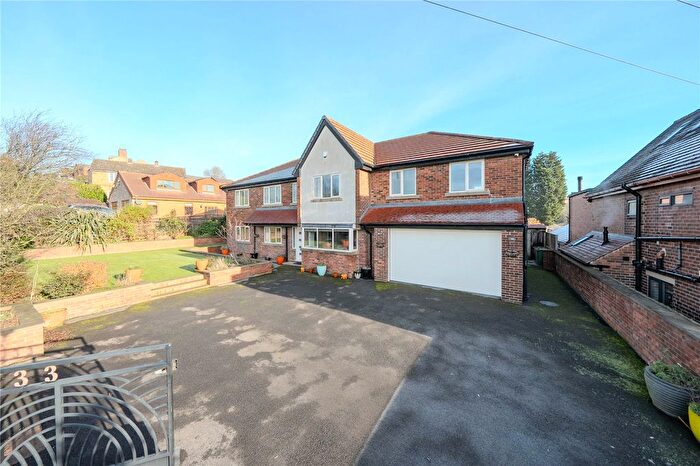
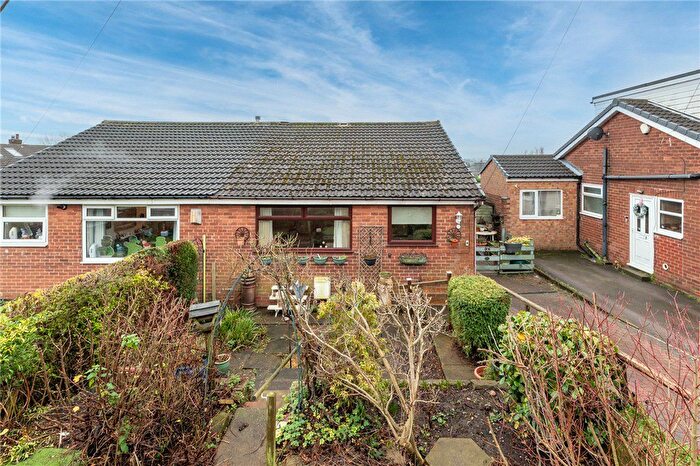
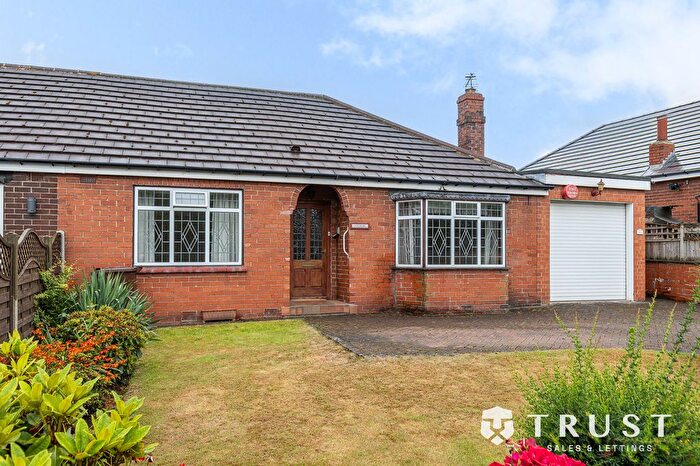
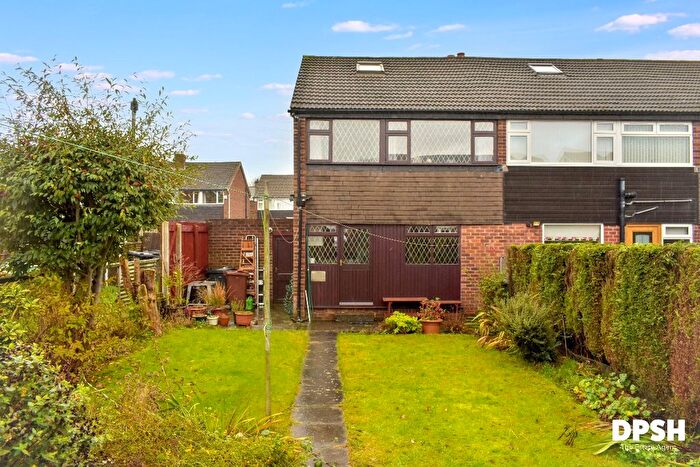
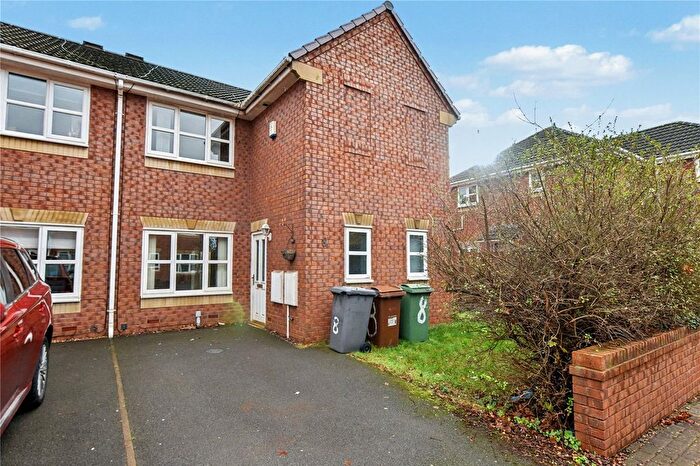
Houses for sale & to rent in Morley South, Wakefield
House Prices in Morley South
Properties in Morley South have an average house price of £261,197.00 and had 134 Property Transactions within the last 3 years¹.
Morley South is an area in Wakefield, Leeds with 1,408 households², where the most expensive property was sold for £725,000.00.
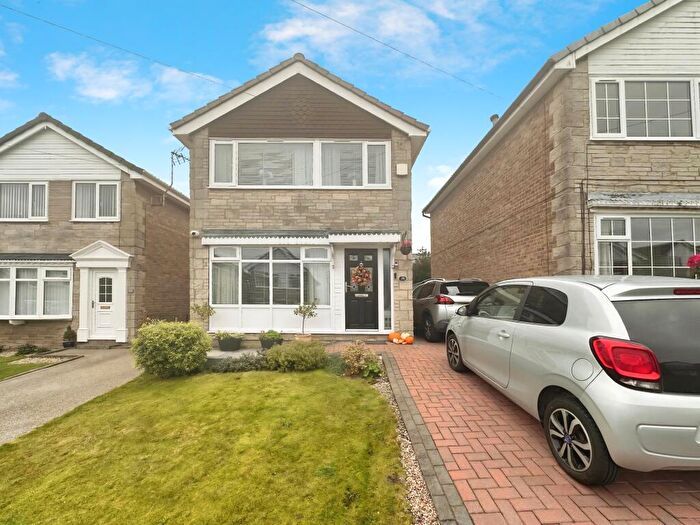
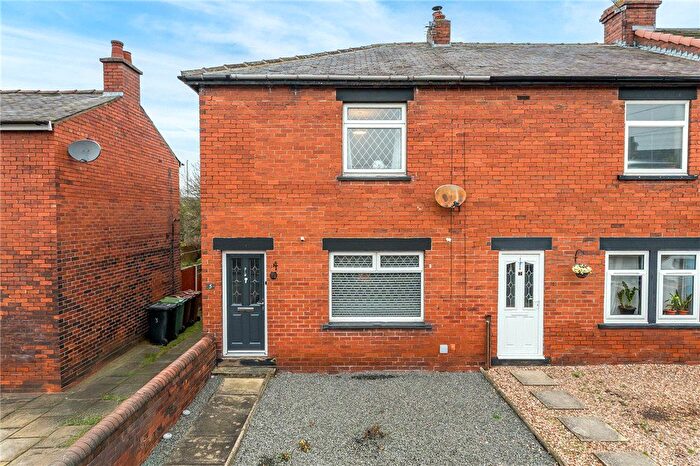
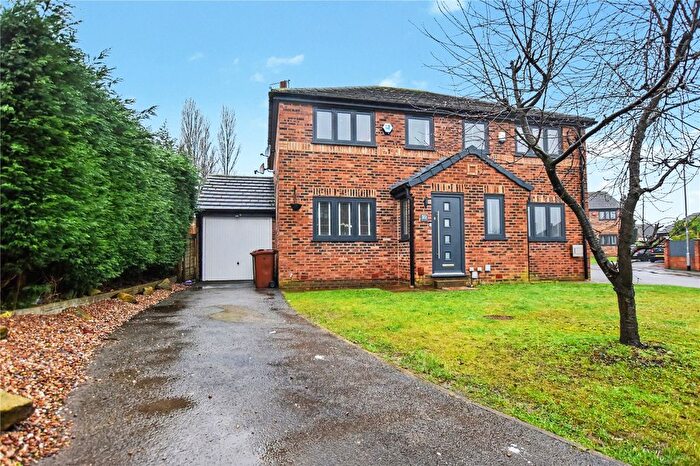
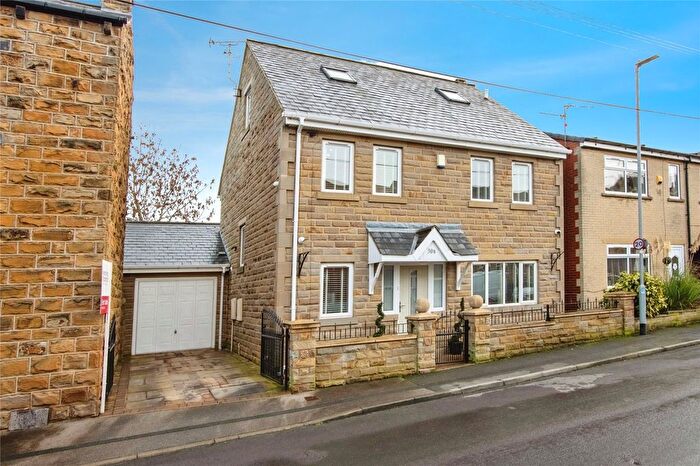
Properties for sale in Morley South
Previously listed properties in Morley South
Roads and Postcodes in Morley South
Navigate through our locations to find the location of your next house in Morley South, Wakefield for sale or to rent.
| Streets | Postcodes |
|---|---|
| Arthington Close | WF3 1BT |
| Aspen Court | WF3 1HH |
| Baghill Green | WF3 1DL |
| Baghill Road | WF3 1DE WF3 1DQ |
| Bedale | WF3 1AT |
| Bradford Road | WF3 1JZ |
| Church Lane | WF3 1BQ |
| Dawson Street | WF3 1LG |
| Dewsbury Road | WF3 1LD WF3 1LE WF3 1LF WF3 1LH WF3 1LN WF3 1LP WF3 1LT WF3 1LX WF3 1ND WF3 1LY WF3 1SH |
| Fairfield Avenue | WF3 1BG |
| Hesketh Avenue | WF3 1LR |
| Hesketh Lane | WF3 1AR WF3 1AS WF3 1AU |
| Highfield | WF3 1LA |
| Ken Syke Cottages | WF3 1DB |
| Kitson Street | WF3 1LQ |
| Lonsdale Rise | WF3 1AG |
| Manor Grange | WF3 1FP |
| Meadow Way | WF3 1BH |
| Oban Close | WF3 1JU |
| Oban Terrace | WF3 1JY |
| Poplar Crescent | WF3 1HX |
| Rein Gardens | WF3 1JR |
| Rein Mews | WF3 1JH |
| Rein Road | WF3 1HY WF3 1HZ WF3 1JA WF3 1JB WF3 1JD WF3 1JE WF3 1JG WF3 1JJ WF3 1JQ |
| Ryedale Way | WF3 1AJ WF3 1AL WF3 1AN WF3 1AP |
| Salisbury Mews | WF3 1WA |
| Scarborough Lane | WF3 1BF |
| Scarborough Street | WF3 1JT |
| St Marys Close | WF3 1BL |
| Sterling Court | WF3 1EL |
| Sterling Way | WF3 1BU |
| Sunnyside | WF3 1LJ |
| Sunnyside Avenue | WF3 1LL |
| Syke Avenue | WF3 1LU |
| Syke Close | WF3 1NA |
| Syke Gardens | WF3 1BJ |
| Syke Parade | WF3 1LZ |
| Syke Road | WF3 1BN WF3 1BW WF3 1DA WF3 1BP |
| Syke Terrace | WF3 1NB |
| The Warings | WF3 1FN |
| Thornefield Crescent | WF3 1LW |
| Tingley Crescent | WF3 1JF |
| Topcliffe Close | WF3 1DR |
| Topcliffe Lane | WF3 1SN WF3 1SP WF3 1WE LS27 0GP |
| Turnberry Close | WF3 1AH |
| Turnberry Drive | WF3 1AQ |
| Turnberry Gardens | WF3 1AD |
| Upper Green Avenue | WF3 1TB |
| Upper Green Close | WF3 1NQ |
| Upper Green Drive | WF3 1TD |
| Upper Green Way | WF3 1TA |
| West Lea Crescent | WF3 1DJ |
| West Lea Drive | WF3 1DH |
| Westerton Road | WF3 1AF WF3 1AW WF3 1BB WF3 1BD |
| Wharfedale Rise | WF3 1AX WF3 1AY WF3 1AZ WF3 1BA |
| Woodkirk Avenue | WF3 1JL WF3 1JN |
| Woodkirk Grove | WF3 1JW |
| Woodland View | WF3 1DN |
Transport near Morley South
- FAQ
- Price Paid By Year
- Property Type Price
Frequently asked questions about Morley South
What is the average price for a property for sale in Morley South?
The average price for a property for sale in Morley South is £261,197. This amount is 9% higher than the average price in Wakefield. There are 424 property listings for sale in Morley South.
What streets have the most expensive properties for sale in Morley South?
The streets with the most expensive properties for sale in Morley South are Upper Green Drive at an average of £595,550, Upper Green Way at an average of £466,666 and Syke Close at an average of £420,000.
What streets have the most affordable properties for sale in Morley South?
The streets with the most affordable properties for sale in Morley South are Church Lane at an average of £153,750, Fairfield Avenue at an average of £162,500 and Poplar Crescent at an average of £173,500.
Which train stations are available in or near Morley South?
Some of the train stations available in or near Morley South are Morley, Batley and Cottingley.
Property Price Paid in Morley South by Year
The average sold property price by year was:
| Year | Average Sold Price | Price Change |
Sold Properties
|
|---|---|---|---|
| 2025 | £280,818 | 15% |
49 Properties |
| 2024 | £239,548 | -8% |
40 Properties |
| 2023 | £259,077 | 11% |
45 Properties |
| 2022 | £230,896 | -5% |
40 Properties |
| 2021 | £242,841 | 16% |
84 Properties |
| 2020 | £205,200 | 2% |
52 Properties |
| 2019 | £200,267 | 3% |
64 Properties |
| 2018 | £194,684 | -5% |
67 Properties |
| 2017 | £205,223 | 13% |
53 Properties |
| 2016 | £178,951 | 11% |
73 Properties |
| 2015 | £160,025 | 2% |
54 Properties |
| 2014 | £157,016 | 8% |
73 Properties |
| 2013 | £144,688 | -7% |
53 Properties |
| 2012 | £154,533 | 8% |
45 Properties |
| 2011 | £141,404 | -12% |
37 Properties |
| 2010 | £158,673 | -5% |
40 Properties |
| 2009 | £166,160 | -3% |
42 Properties |
| 2008 | £170,635 | 8% |
31 Properties |
| 2007 | £157,402 | 4% |
77 Properties |
| 2006 | £150,942 | 6% |
89 Properties |
| 2005 | £141,642 | 0,1% |
57 Properties |
| 2004 | £141,535 | 14% |
69 Properties |
| 2003 | £121,854 | 15% |
115 Properties |
| 2002 | £103,734 | 20% |
105 Properties |
| 2001 | £83,092 | 9% |
87 Properties |
| 2000 | £76,000 | -1% |
133 Properties |
| 1999 | £76,667 | 2% |
94 Properties |
| 1998 | £74,910 | 18% |
96 Properties |
| 1997 | £61,168 | 9% |
63 Properties |
| 1996 | £55,386 | 2% |
61 Properties |
| 1995 | £54,007 | - |
39 Properties |
Property Price per Property Type in Morley South
Here you can find historic sold price data in order to help with your property search.
The average Property Paid Price for specific property types in the last three years are:
| Property Type | Average Sold Price | Sold Properties |
|---|---|---|
| Semi Detached House | £232,499.00 | 66 Semi Detached Houses |
| Detached House | £374,361.00 | 39 Detached Houses |
| Terraced House | £179,323.00 | 23 Terraced Houses |
| Flat | £155,166.00 | 6 Flats |

