
Houses for sale in Rothwell, Wakefield
House Prices in Rothwell
Properties in Rothwell have an average house price of £271k and had 36 Property Transactions within the last 3 years¹.
Rothwell is an area in Wakefield, Leeds with 303 households², where the most expensive property was sold for £850k.
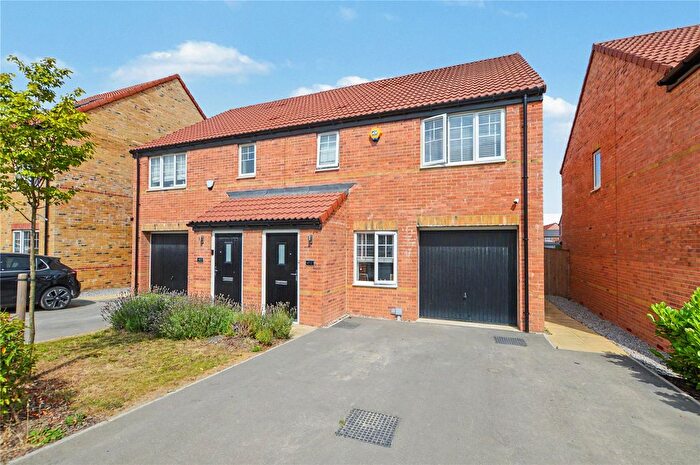
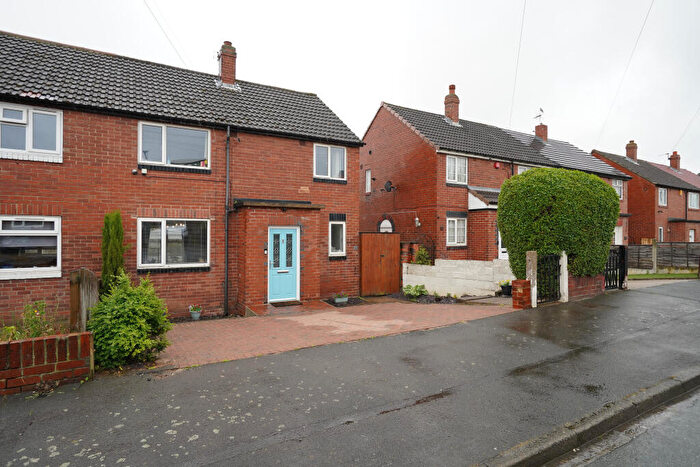
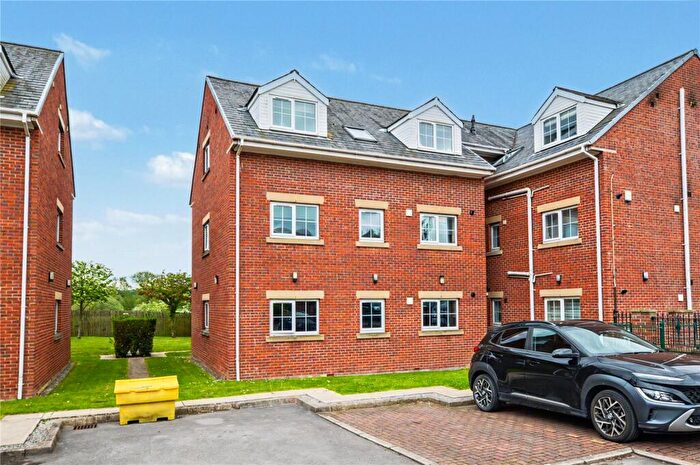
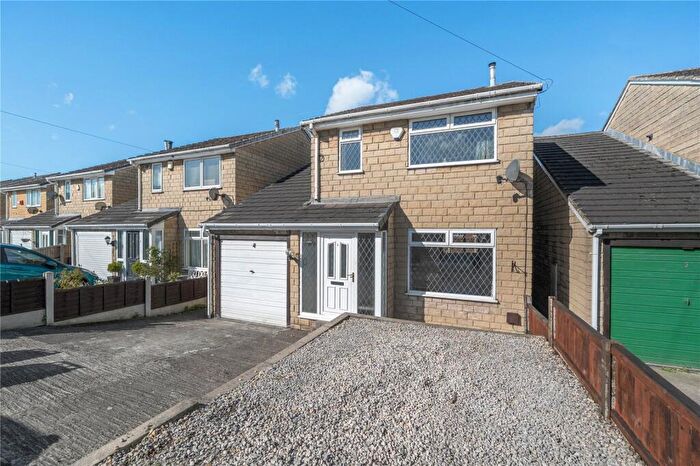
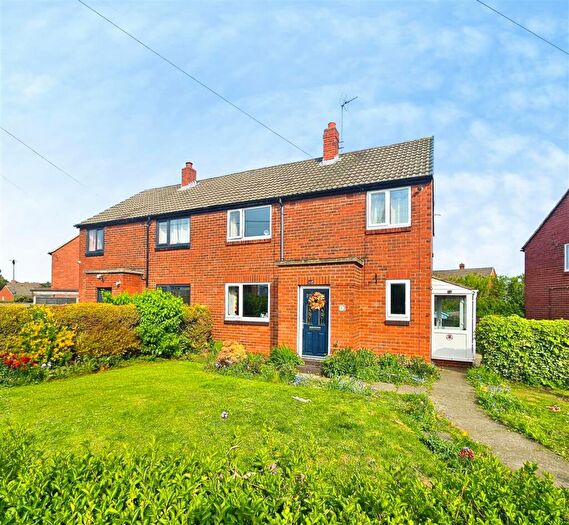
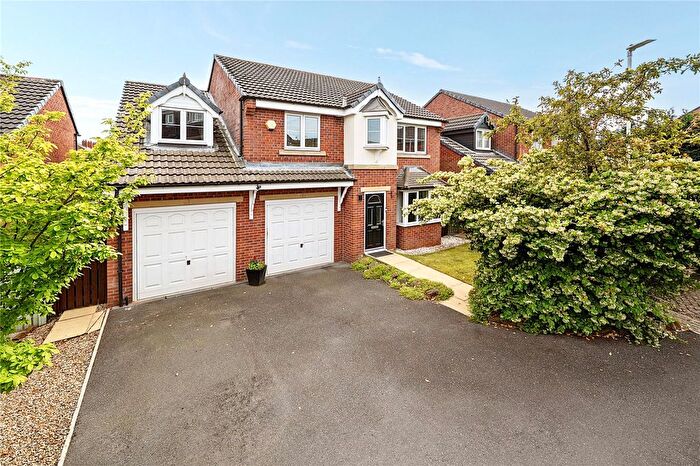
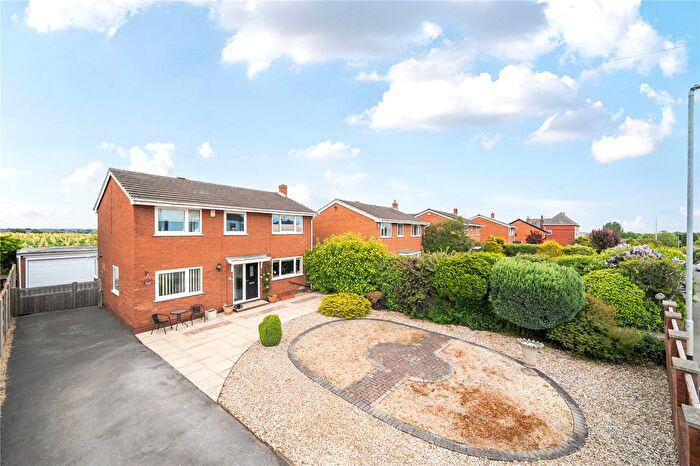
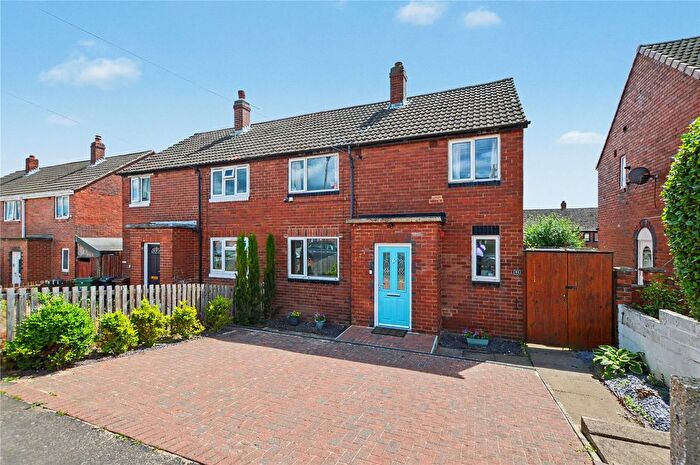
Properties for sale in Rothwell
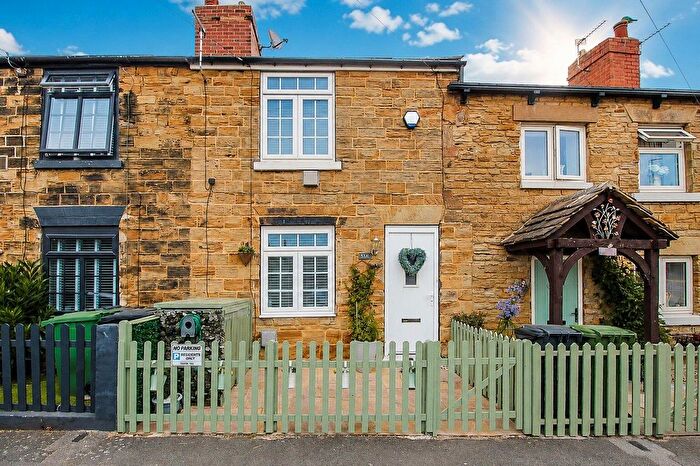
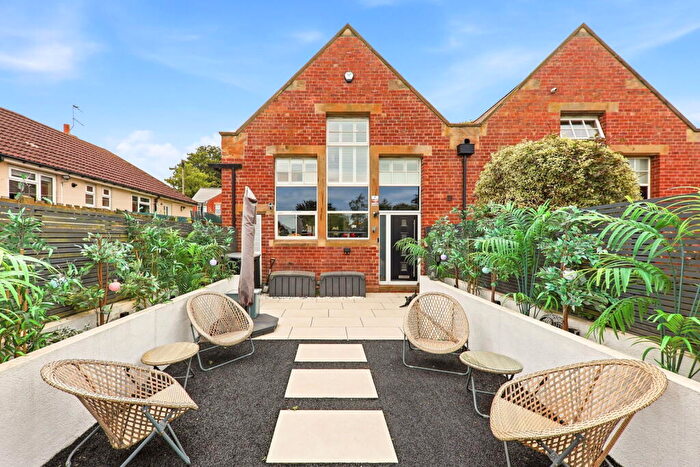
![]()
If you are looking to sell your house, let it out, or receive a property valuation, an expert can help you.
Click the button below to get started.
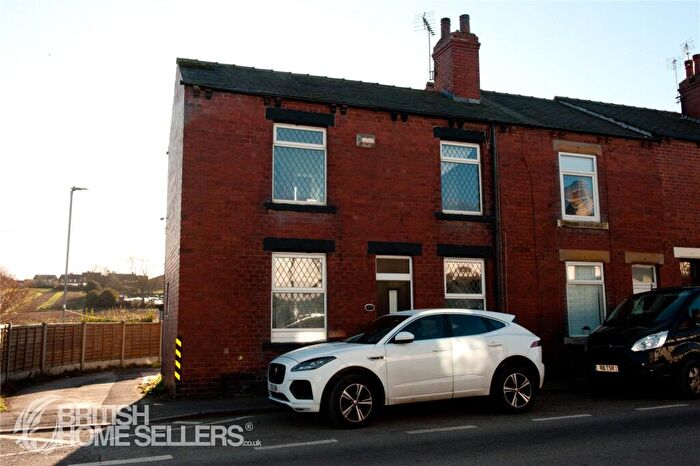
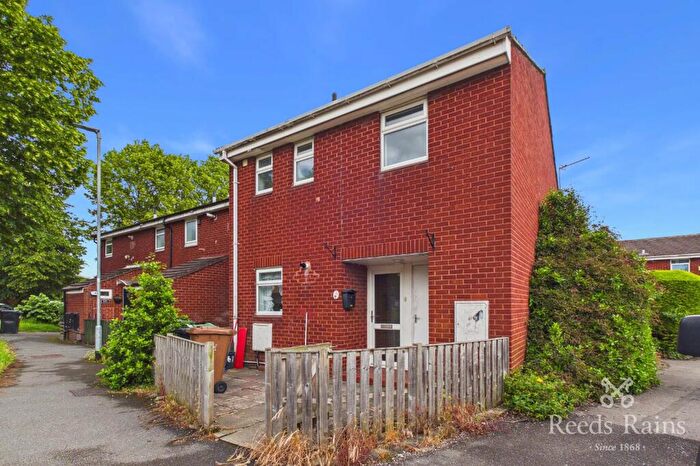
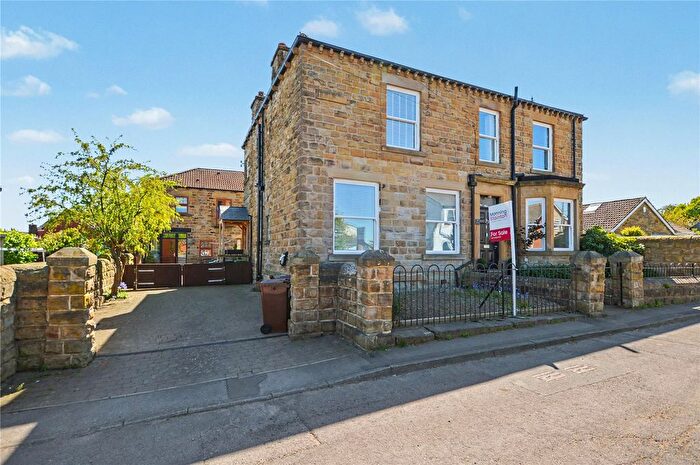
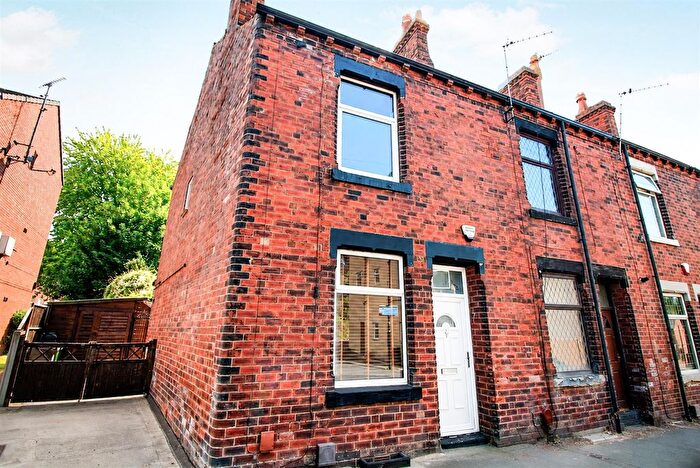
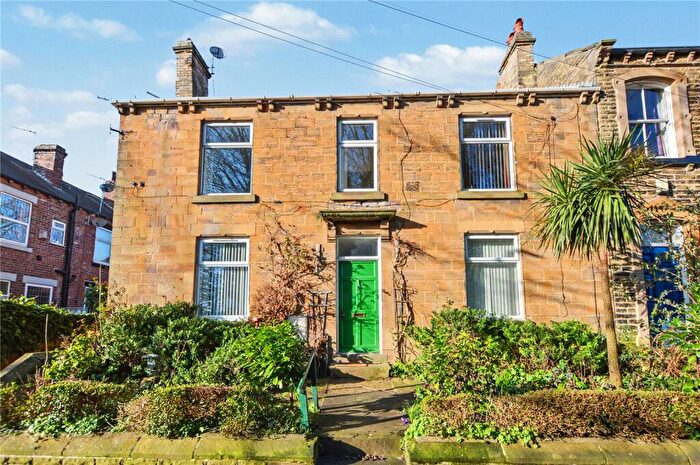
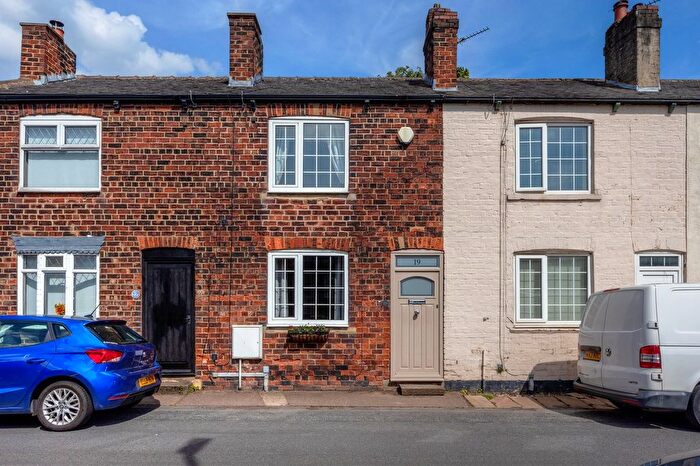
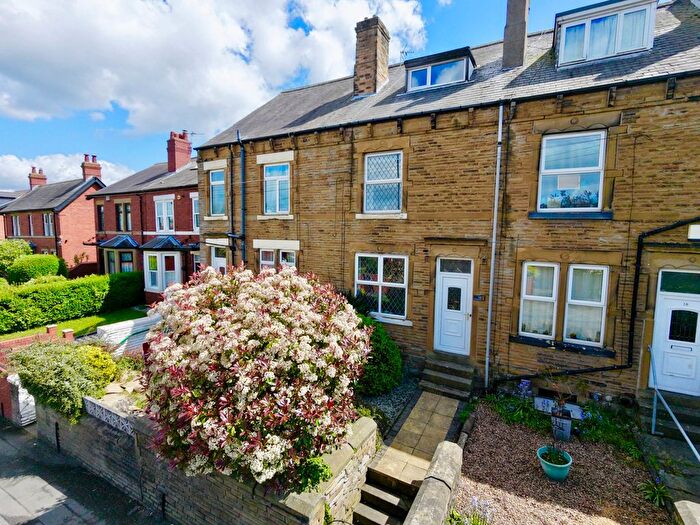
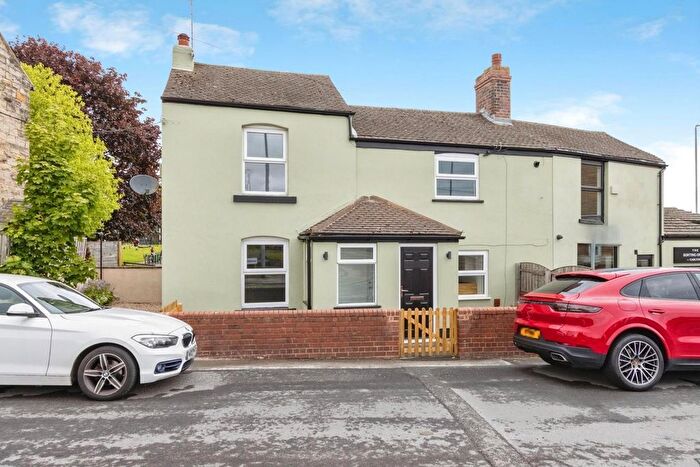
Previously listed properties in Rothwell
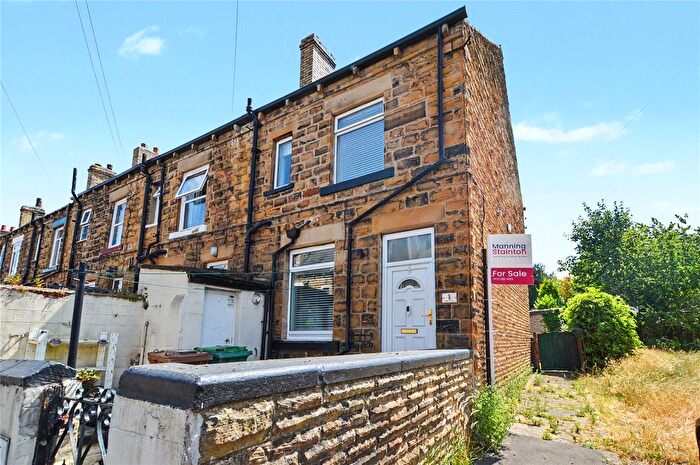
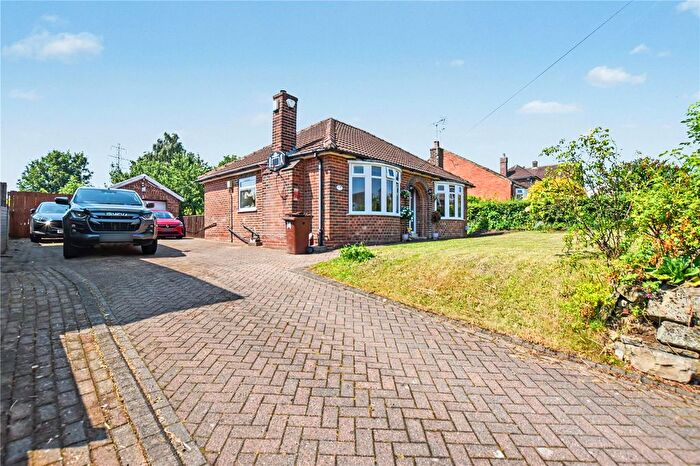
![]()
If you are looking to sell your house, let it out, or receive a property valuation, an expert can help you.
Click the button below to get started.
Roads and Postcodes in Rothwell
Navigate through our locations to find the location of your next house in Rothwell, Wakefield for sale or to rent.
| Streets | Postcodes |
|---|---|
| Albion Street | WF3 3TP |
| Amspool Court | WF3 3TW |
| Ashton Crescent | WF3 3RB |
| Carr Lane | WF3 3RT |
| Cemetery Lane | WF3 3QT |
| Chapel Street | WF3 3RN |
| Coronation Street | WF3 3RD |
| Dobsons Row | WF3 3QX |
| Farmer Street | WF3 3SY |
| Little Lane | WF3 3RS |
| Main Street | WF3 3RW |
| Nateby Rise | WF3 3TN |
| New Road | WF3 3RE |
| Ouzlewell Green | WF3 3SB |
| Pitfield Road | WF3 3QY WF3 3QZ |
| Primitive Street | WF3 3QS |
| Queen Street | WF3 3RF |
| Queens Drive | WF3 3RQ |
| Shayfield Drive | WF3 3FY |
| Shayfield Lane | WF3 3RH |
| Stainton Lane | WF3 3RP |
| The Grange | WF3 3TR |
| Town Street | WF3 3QU |
| Unity Street | WF3 3RA |
| Westfield Road | WF3 3RJ |
Property price trends in Rothwell
According to the latest Land Registry data, the average home in Rothwell sold for £281,285 in 2025. That figure comes from 393 sales logged over the past 30 years.
Prices have fallen back over the last three years. Compared with 2022, when the typical sale came in around £373,937, that's a fall of roughly 24.8%.
Looking back five years, average prices are up about 42.9% since 2020, a gain of around £84,508 in cash terms.
Zoom out to the past decade for the fuller picture. Back in 2015, homes here averaged £193,043, so the typical sold price has climbed about 45.7% since then, roughly 3.8% a year. Stretch the view to fifteen years and that annual pace eases back to about 3.6%.
Frequently asked questions about Rothwell
What is the average price for a property for sale in Rothwell?
The average price for a property for sale in Rothwell is £271,006. This amount is 13% higher than the average price in Wakefield. There are 371 property listings for sale in Rothwell.
What streets have the most expensive properties for sale in Rothwell?
The streets with the most expensive properties for sale in Rothwell are Shayfield Drive at an average of £437,500, The Grange at an average of £392,500 and Primitive Street at an average of £385,000.
What streets have the most affordable properties for sale in Rothwell?
The streets with the most affordable properties for sale in Rothwell are New Road at an average of £154,500, Main Street at an average of £158,666 and Unity Street at an average of £184,000.
Which train stations are available in or near Rothwell?
Some of the train stations available in or near Rothwell are Outwood, Woodlesford and Normanton.
Property Price Paid in Rothwell by Year
The average sold property price by year was:
| Year | Average Sold Price | Price Change |
Sold Properties
|
|---|---|---|---|
| 2025 | £281,285 | 14% |
14 Properties |
| 2024 | £242,107 | -25% |
14 Properties |
| 2023 | £303,593 | -23% |
8 Properties |
| 2022 | £373,937 | 11% |
16 Properties |
| 2021 | £334,055 | 41% |
9 Properties |
| 2020 | £196,777 | -29% |
7 Properties |
| 2019 | £253,683 | 17% |
16 Properties |
| 2018 | £210,230 | 19% |
13 Properties |
| 2017 | £170,700 | 25% |
5 Properties |
| 2016 | £128,045 | -51% |
5 Properties |
Property Price per Property Type in Rothwell
Here you can find historic sold price data in order to help with your property search.
The average Property Paid Price for specific property types in the last three years are:
| Property Type | Average Sold Price | Sold Properties |
|---|---|---|
| Semi Detached House | £218,615.00 | 13 Semi Detached Houses |
| Terraced House | £162,312.00 | 12 Terraced Houses |
| Detached House | £451,500.00 | 11 Detached Houses |
