
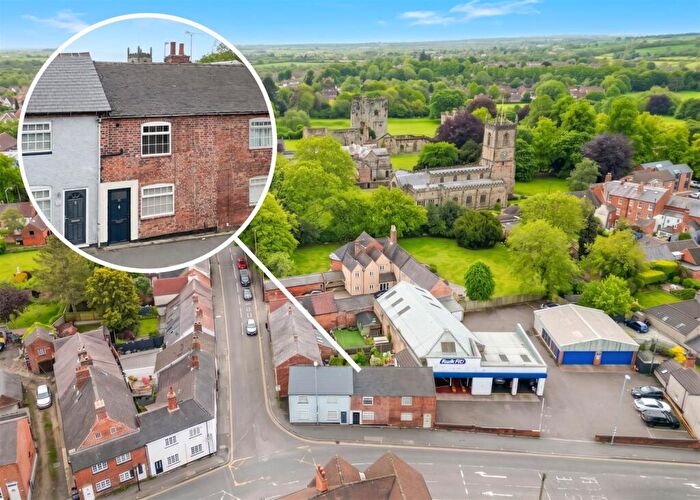
Houses for sale & to rent in Ashby-de-la-zouch, Leicestershire
House Prices in Ashby-de-la-zouch
Properties in Ashby-de-la-zouch have an average house price of £335k and had 697 Property Transactions within the last 3 years.¹
Ashby-de-la-zouch is an area in Leicestershire with 5,838 households², where the most expensive property was sold for £1.85M.
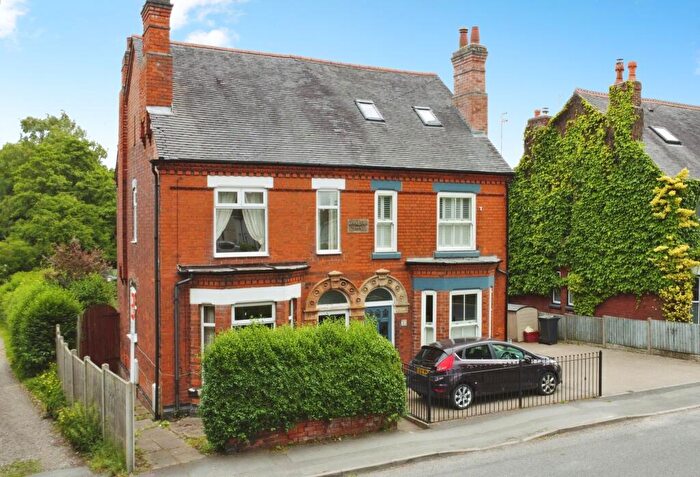
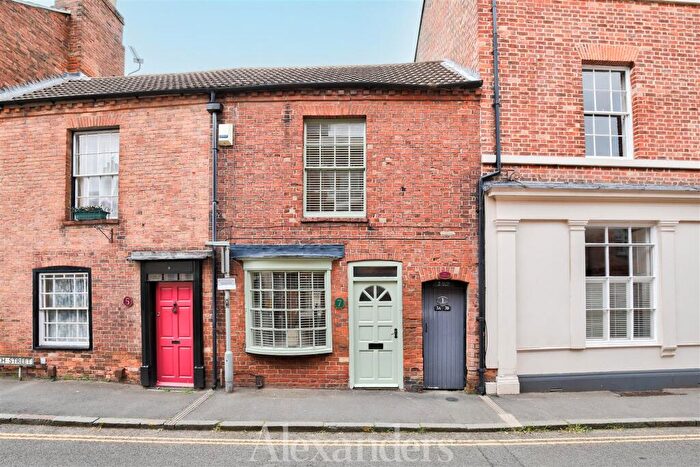
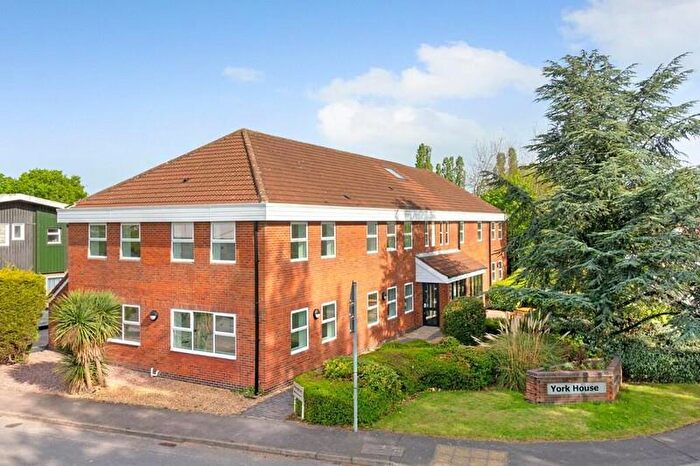
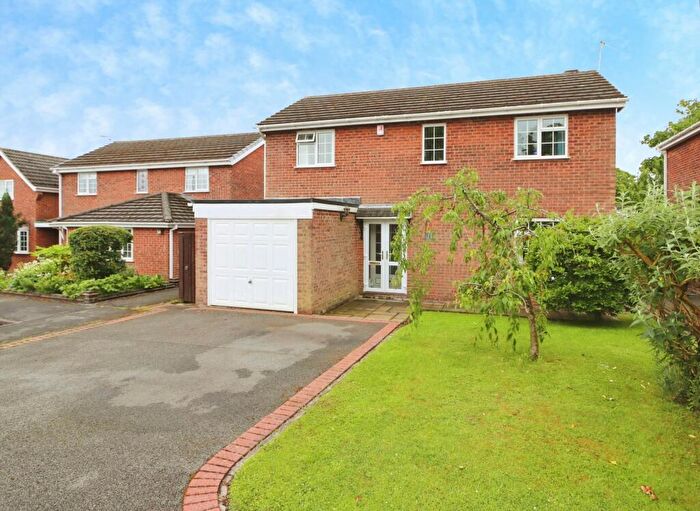
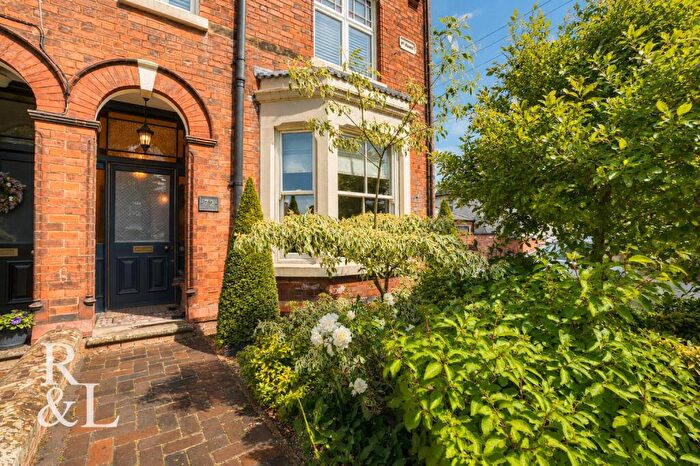
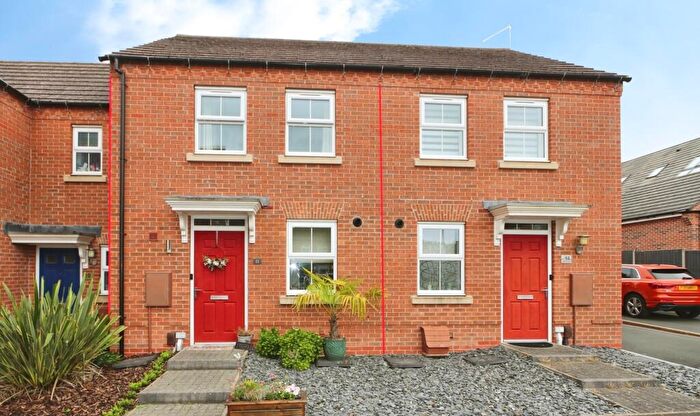
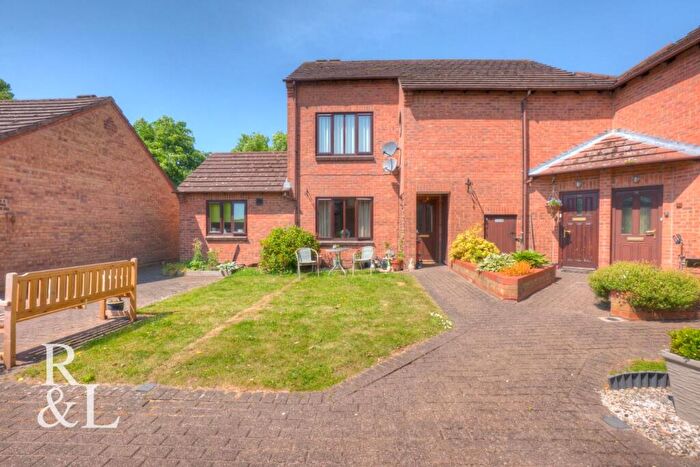
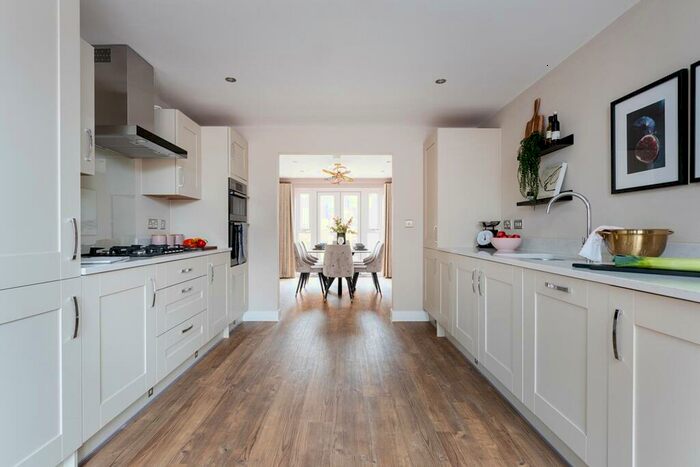
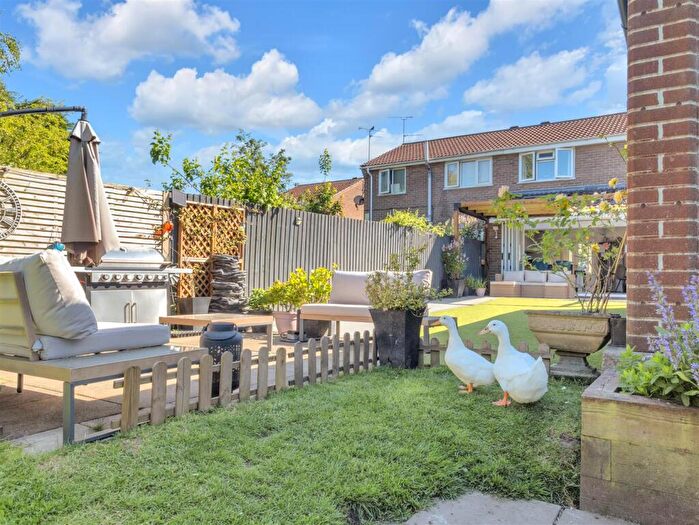
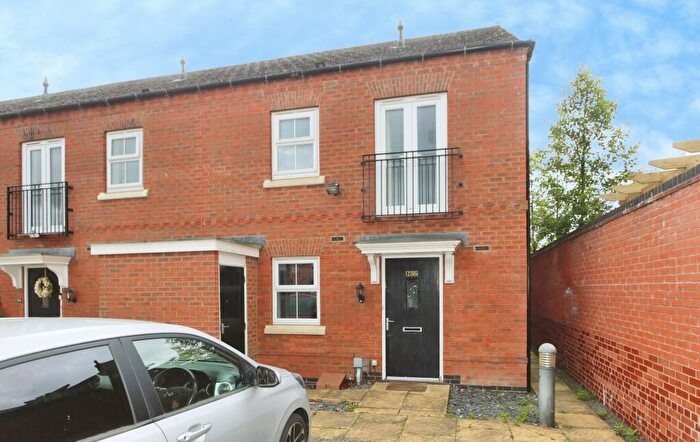
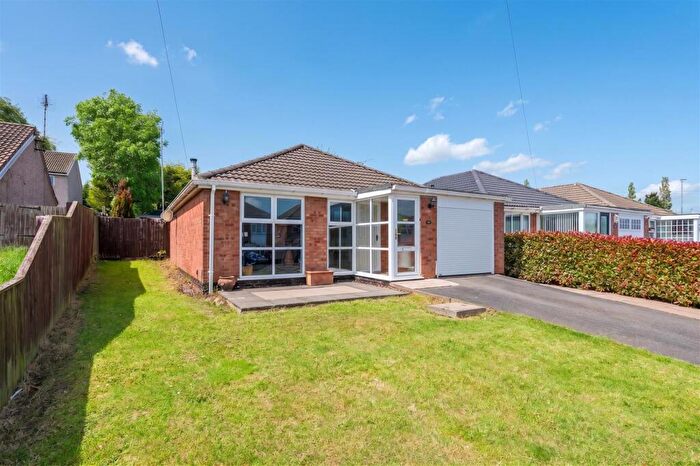
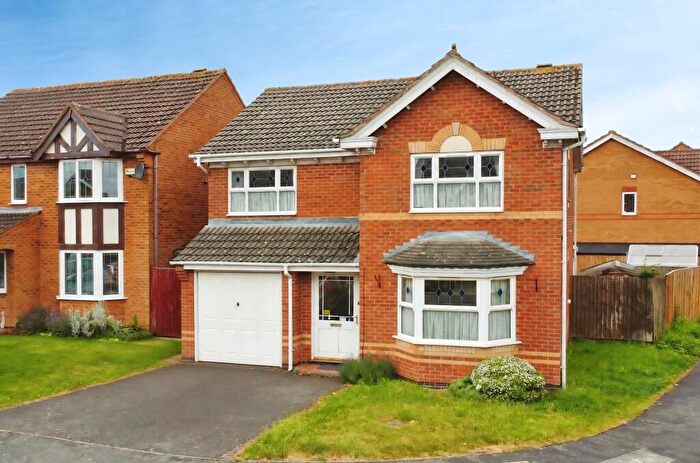
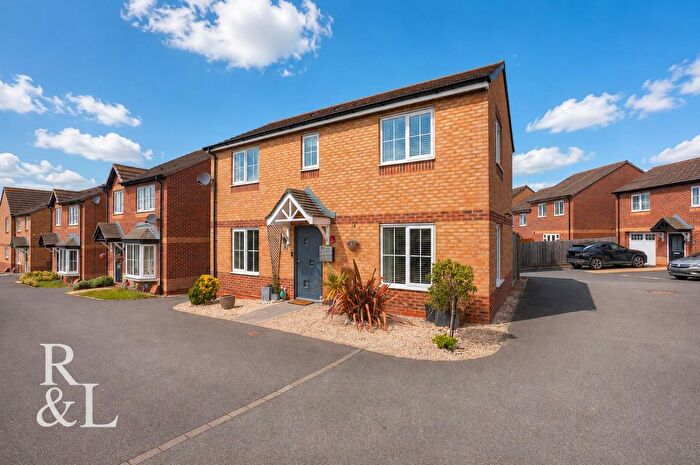
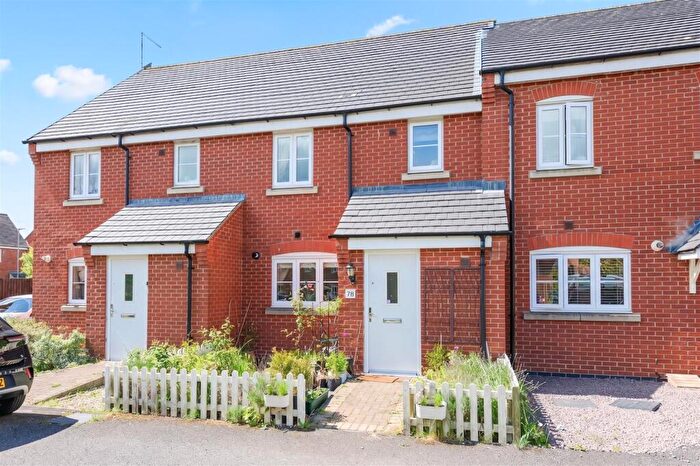
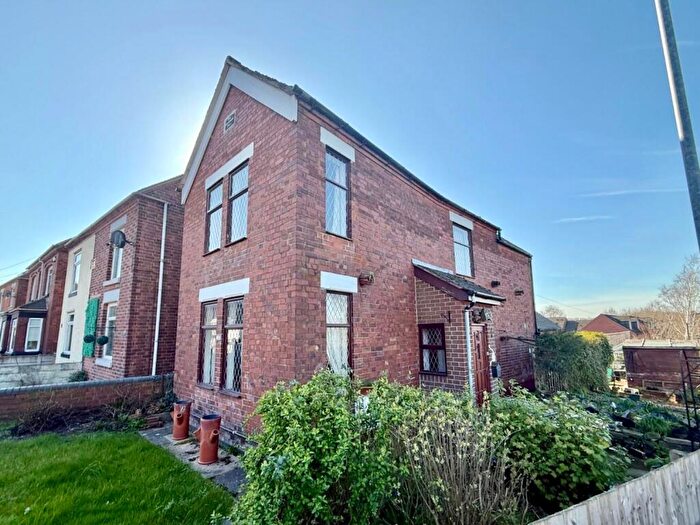
Properties for sale in Ashby-de-la-zouch
![]()
If you are looking to sell your house, let it out, or receive a property valuation, an expert can help you.
Click the button below to get started.


Neighbourhoods in Ashby-de-la-zouch
Navigate through our locations to find the location of your next house in Ashby-de-la-zouch, Leicestershire for sale or to rent.
Transport in Ashby-de-la-zouch
Please see below transportation links in this area:
-
 Burton-On-Trent Station
 -
Willington Station
-
Peartree Station
-
Polesworth Station
-
Spondon Station
-
Derby Station
-
Loughborough Station
-
East Midlands Parkway Station
-
Tamworth Low Level Station
-
Tutbury and Hatton Station
- FAQ
- Price Paid By Year
- Property Type Price
Frequently asked questions about Ashby-de-la-zouch
What is the average price for a property for sale in Ashby-de-la-zouch?
The average price for a property for sale in Ashby-de-la-zouch is £334,641. This amount is 10% higher than the average price in Leicestershire. There are 3,822 property listings for sale in Ashby-de-la-zouch.
What locations have the most expensive properties for sale in Ashby-de-la-zouch?
The locations with the most expensive properties for sale in Ashby-de-la-zouch are Ravenstone & Packington at an average of £643,750, Ravenstone And Packington at an average of £557,103 and Valley at an average of £381,100.
What locations have the most affordable properties for sale in Ashby-de-la-zouch?
The locations with the most affordable properties for sale in Ashby-de-la-zouch are Ashby Willesley at an average of £222,000, Ashby Money Hill at an average of £265,346 and Ashby Holywell at an average of £295,548.
Which train stations are available in or near Ashby-de-la-zouch?
Some of the train stations available in or near Ashby-de-la-zouch are Burton-On-Trent, Willington and Peartree.
Property Price Paid in Ashby-de-la-zouch by Year
The average sold property price by year was:
| Year | Average Sold Price | Price Change |
Sold Properties
|
|---|---|---|---|
| 2026 | £288,420 | -15% |
20 Properties |
| 2025 | £332,496 | 1% |
242 Properties |
| 2024 | £329,217 | -6% |
234 Properties |
| 2023 | £348,137 | 3% |
201 Properties |
| 2022 | £336,172 | 8% |
362 Properties |
| 2021 | £309,292 | 2% |
414 Properties |
| 2020 | £304,054 | 3% |
357 Properties |
| 2019 | £296,014 | 3% |
367 Properties |
| 2018 | £285,778 | 2% |
476 Properties |
| 2017 | £279,928 | 8% |
385 Properties |
| 2016 | £258,789 | 5% |
347 Properties |
| 2015 | £247,025 | 1% |
415 Properties |
| 2014 | £243,687 | 15% |
359 Properties |
| 2013 | £208,270 | 2% |
306 Properties |
| 2012 | £203,189 | -2% |
176 Properties |
| 2011 | £206,871 | 0,3% |
193 Properties |
| 2010 | £206,196 | 9% |
218 Properties |
| 2009 | £187,944 | -2% |
216 Properties |
| 2008 | £190,963 | -9% |
166 Properties |
| 2007 | £207,444 | 3% |
365 Properties |
| 2006 | £200,535 | -1% |
339 Properties |
| 2005 | £203,498 | 10% |
240 Properties |
| 2004 | £182,470 | 12% |
239 Properties |
| 2003 | £160,425 | 13% |
288 Properties |
| 2002 | £140,230 | 27% |
341 Properties |
| 2001 | £101,754 | 8% |
280 Properties |
| 2000 | £93,723 | 1% |
269 Properties |
| 1999 | £92,390 | 19% |
332 Properties |
| 1998 | £75,003 | 3% |
318 Properties |
| 1997 | £72,694 | 2% |
324 Properties |
| 1996 | £71,159 | -3% |
268 Properties |
| 1995 | £72,975 | - |
233 Properties |
Property Price per Property Type in Ashby-de-la-zouch
Here you can find historic sold price data in order to help with your property search.
The average Property Paid Price for specific property types in the last three years are:
| Property Type | Average Sold Price | Sold Properties |
|---|---|---|
| Semi Detached House | £261,304.00 | 177 Semi Detached Houses |
| Detached House | £441,897.00 | 325 Detached Houses |
| Terraced House | £247,725.00 | 125 Terraced Houses |
| Flat | £177,313.00 | 70 Flats |