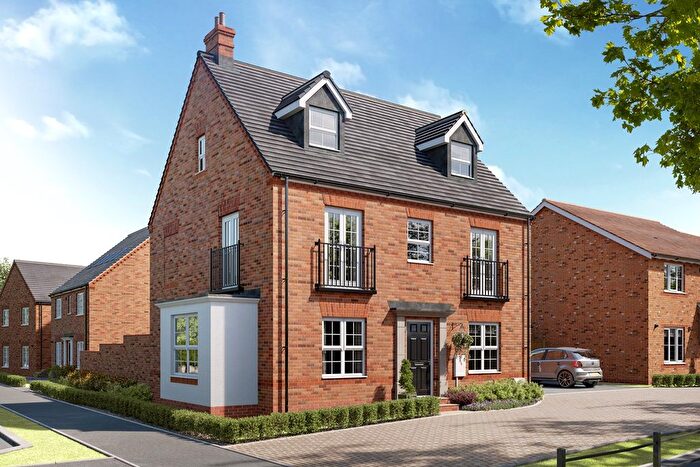
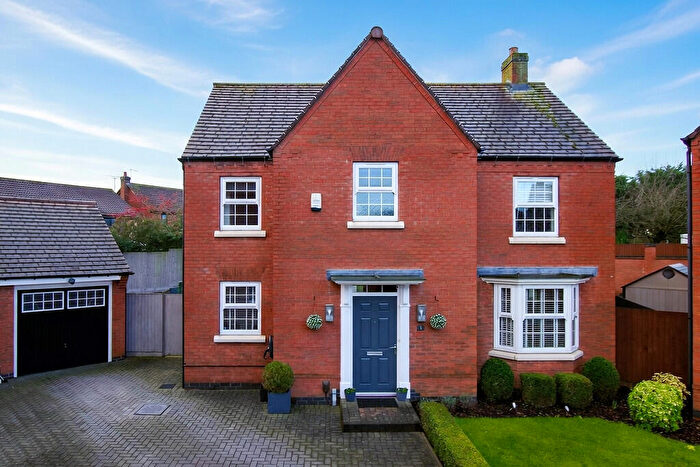
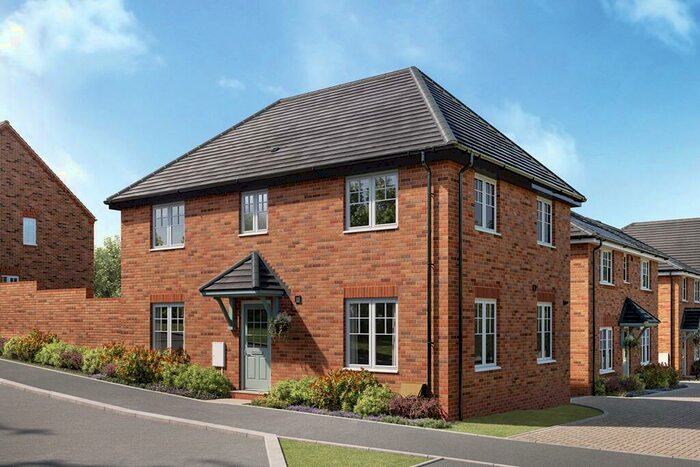
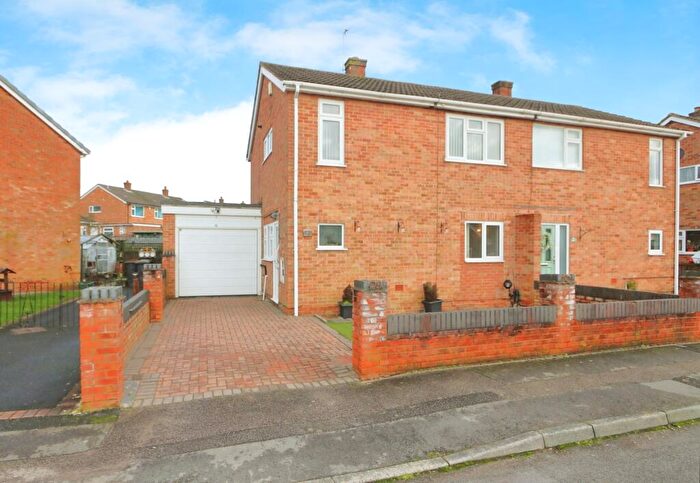
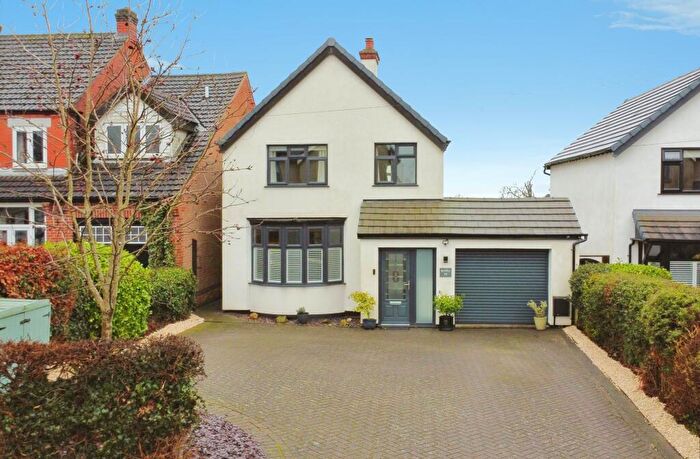
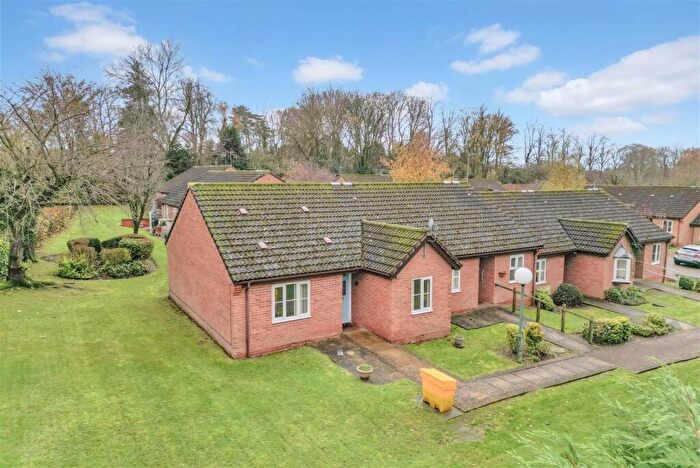
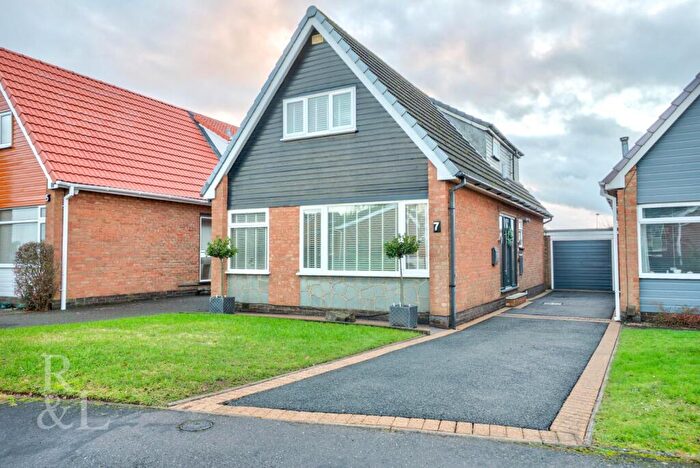
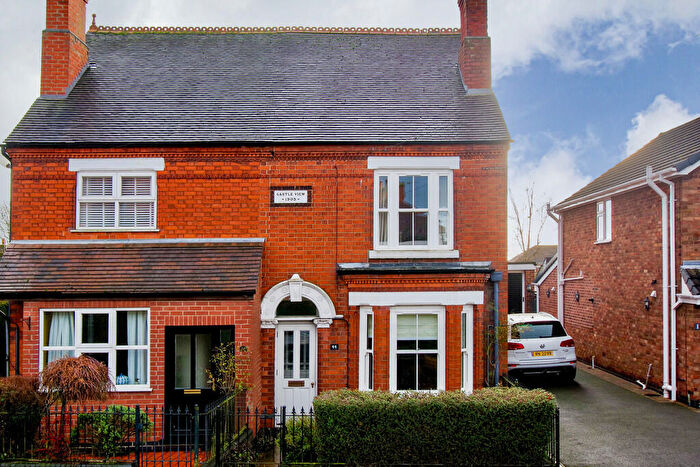
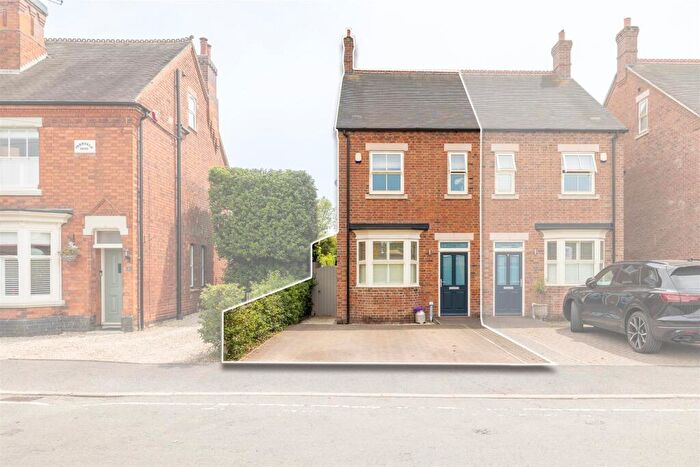
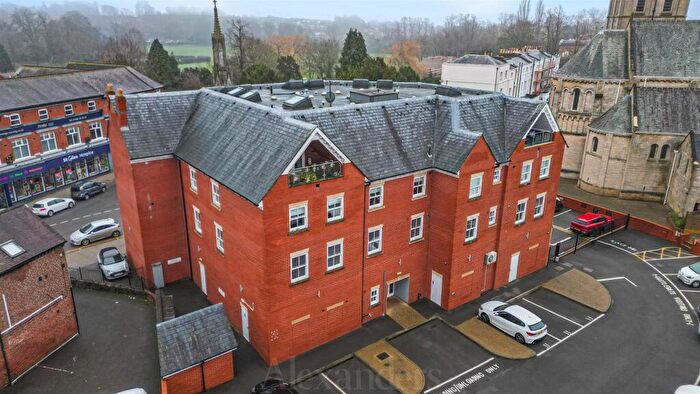
Houses for sale & to rent in Ashby Castle, Ashby-de-la-zouch
House Prices in Ashby Castle
Properties in Ashby Castle have an average house price of £369,227.00 and had 114 Property Transactions within the last 3 years¹.
Ashby Castle is an area in Ashby-de-la-zouch, Leicestershire with 1,034 households², where the most expensive property was sold for £1,225,000.00.
Properties for sale in Ashby Castle
Roads and Postcodes in Ashby Castle
Navigate through our locations to find the location of your next house in Ashby Castle, Ashby-de-la-zouch for sale or to rent.
| Streets | Postcodes |
|---|---|
| Abbotsford Road | LE65 1AE |
| Abney Court | LE65 1FZ |
| Alton Way | LE65 1ER |
| Bamburgh Close | LE65 1BY |
| Belvoir Drive | LE65 1WX |
| Berwick Road | LE65 1HL |
| Brendon Way | LE65 1EY |
| Cambrian Way | LE65 1DX LE65 1DY |
| Campbell Close | LE65 1FQ |
| Chapmans Meadows | LE65 1JE |
| Chiltern Rise | LE65 1EU |
| Church Yard | LE65 1AA |
| Clarence Place | LE65 1FR |
| Coniston Gardens | LE65 1FB |
| Corkscrew Lane | LE65 1TH |
| Cotswold Way | LE65 1ET |
| Cottage Row | LE65 1EN |
| Derwent Gardens | LE65 1HJ |
| Dunbar Way | LE65 1AQ |
| Elvaston Close | LE65 1BZ |
| Ennerdale Gardens | LE65 1FD |
| Hastings Way | LE65 1EP |
| Holland Crescent | LE65 1FS |
| Kelso Close | LE65 1HF |
| Kenilworth Drive | LE65 1XB |
| Leicester Road | LE65 1DB LE65 1DD LE65 1DE LE65 1DF LE65 1TQ LE65 1TR LE65 1DH |
| Leith Close | LE65 1HN |
| Lower Church Street | LE65 1AB |
| Lower Packington Road | LE65 1TS |
| Loweswater Grove | LE65 1HG |
| Manor Close | LE65 1EE |
| Market Street | LE65 1AP |
| Melrose Close | LE65 1AW |
| Mendip Close | LE65 1DZ |
| Mill Farm Lane | LE65 1GR |
| Moleyns Close | LE65 1GN |
| Mount Walk | LE65 1BG |
| Myring Close | LE65 1GY |
| Pennine Way | LE65 1EW LE65 1EZ |
| Pentland Road | LE65 1BA |
| Prior Park Lane | LE65 1BH |
| Prior Park Road | LE65 1BJ LE65 1BL |
| Priorfields | LE65 1EA |
| Rawdon Terrace | LE65 2GL |
| Rockingham Close | LE65 1WZ |
| Ruthyn Close | LE65 1FU |
| Rydal Gardens | LE65 1FJ |
| South Street | LE65 1BQ LE65 1BR |
| St Michaels Close | LE65 1ES |
| The Croft | LE65 1FP |
| The Gables | LE65 1EH |
| Thirlmere Gardens | LE65 1FN |
| Tudor Close | LE65 1TZ |
| Tutbury Close | LE65 1XD |
| Ulleswater Crescent | LE65 1FH |
| Union Passage | LE65 1BW |
| Upper Packington Road | LE65 1ED LE65 1EF LE65 1UL |
| Warwick Way | LE65 1WY LE65 1YZ |
| Weysford Lane | LE65 1GL |
| Windermere Avenue | LE65 1FA |
| Windmill Close | LE65 1EQ |
| Windsor Road | LE65 1TW |
| Wrekin Close | LE65 1EX |
Transport near Ashby Castle
-
Burton-On-Trent Station
-
Willington Station
-
Polesworth Station
-
Peartree Station
-
Loughborough Station
-
East Midlands Parkway Station
-
Tamworth Low Level Station
-
Spondon Station
-
Atherstone Station
-
Derby Station
- FAQ
- Price Paid By Year
- Property Type Price
Frequently asked questions about Ashby Castle
What is the average price for a property for sale in Ashby Castle?
The average price for a property for sale in Ashby Castle is £369,227. This amount is 11% higher than the average price in Ashby-de-la-zouch. There are 693 property listings for sale in Ashby Castle.
What streets have the most expensive properties for sale in Ashby Castle?
The streets with the most expensive properties for sale in Ashby Castle are Upper Packington Road at an average of £793,000, Manor Close at an average of £710,000 and Ennerdale Gardens at an average of £523,750.
What streets have the most affordable properties for sale in Ashby Castle?
The streets with the most affordable properties for sale in Ashby Castle are Union Passage at an average of £161,250, Tudor Close at an average of £214,888 and Elvaston Close at an average of £227,375.
Which train stations are available in or near Ashby Castle?
Some of the train stations available in or near Ashby Castle are Burton-On-Trent, Willington and Polesworth.
Property Price Paid in Ashby Castle by Year
The average sold property price by year was:
| Year | Average Sold Price | Price Change |
Sold Properties
|
|---|---|---|---|
| 2025 | £376,487 | -1% |
27 Properties |
| 2024 | £380,389 | 8% |
47 Properties |
| 2023 | £351,211 | -5% |
40 Properties |
| 2022 | £368,670 | 10% |
48 Properties |
| 2021 | £332,259 | 2% |
58 Properties |
| 2020 | £324,603 | 11% |
48 Properties |
| 2019 | £290,199 | -15% |
44 Properties |
| 2018 | £334,939 | 8% |
76 Properties |
| 2017 | £308,019 | 4% |
105 Properties |
| 2016 | £294,217 | 7% |
73 Properties |
| 2015 | £275,045 | 4% |
87 Properties |
| 2014 | £264,816 | 4% |
60 Properties |
| 2013 | £252,956 | 4% |
50 Properties |
| 2012 | £241,701 | 9% |
32 Properties |
| 2011 | £220,407 | -27% |
32 Properties |
| 2010 | £280,610 | 23% |
39 Properties |
| 2009 | £217,193 | -4% |
32 Properties |
| 2008 | £225,769 | -20% |
26 Properties |
| 2007 | £270,156 | 15% |
48 Properties |
| 2006 | £229,341 | 10% |
52 Properties |
| 2005 | £207,501 | 1% |
43 Properties |
| 2004 | £205,225 | 10% |
43 Properties |
| 2003 | £185,462 | 14% |
58 Properties |
| 2002 | £158,850 | 17% |
65 Properties |
| 2001 | £132,080 | 8% |
62 Properties |
| 2000 | £121,124 | 8% |
64 Properties |
| 1999 | £111,109 | 19% |
97 Properties |
| 1998 | £89,749 | 1% |
74 Properties |
| 1997 | £88,477 | 5% |
83 Properties |
| 1996 | £83,776 | -7% |
77 Properties |
| 1995 | £89,723 | - |
87 Properties |
Property Price per Property Type in Ashby Castle
Here you can find historic sold price data in order to help with your property search.
The average Property Paid Price for specific property types in the last three years are:
| Property Type | Average Sold Price | Sold Properties |
|---|---|---|
| Semi Detached House | £260,113.00 | 20 Semi Detached Houses |
| Detached House | £431,096.00 | 75 Detached Houses |
| Terraced House | £267,745.00 | 12 Terraced Houses |
| Flat | £192,064.00 | 7 Flats |

