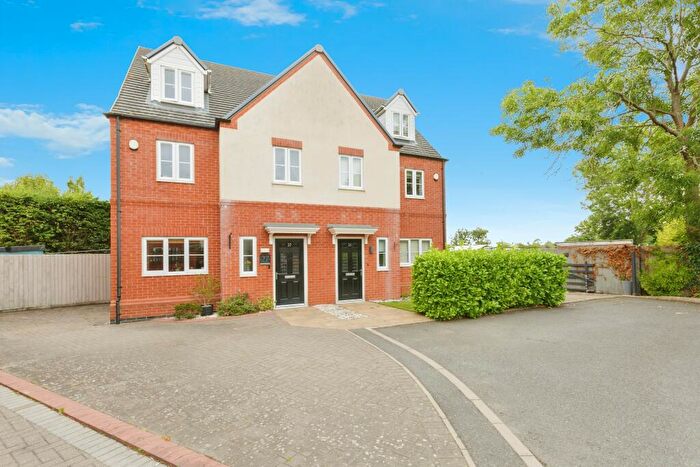
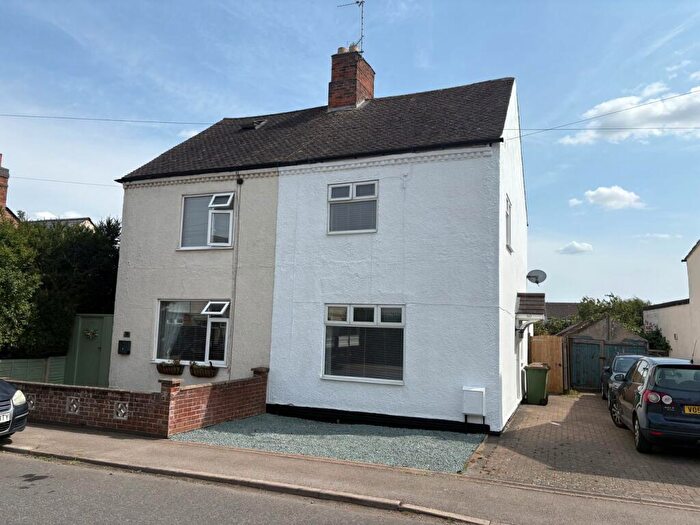
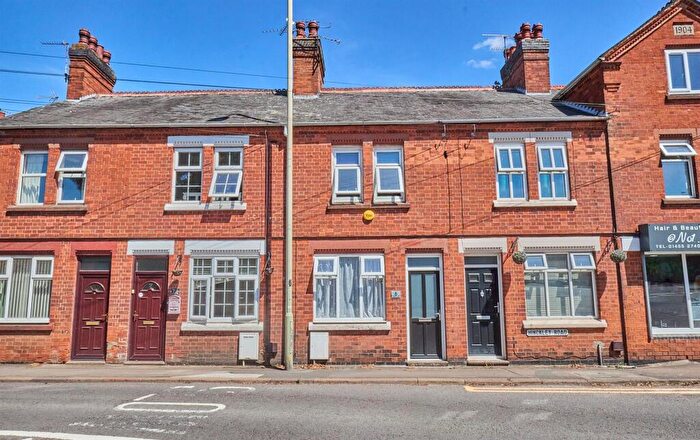
Houses for sale & to rent in Stanton And Flamville, Hinckley
House Prices in Stanton And Flamville
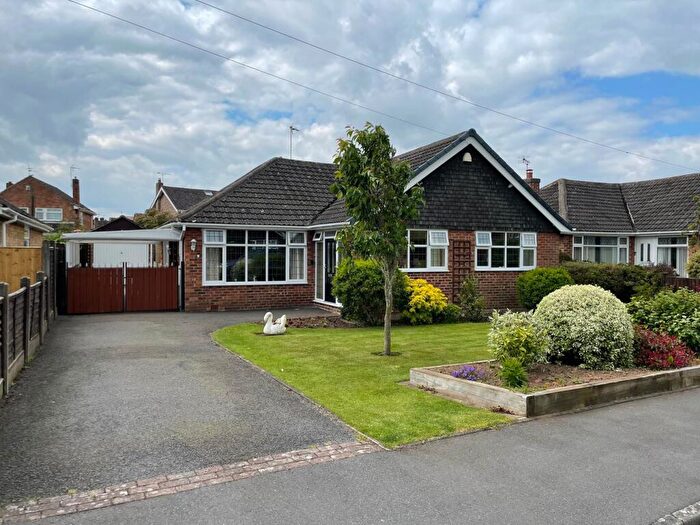
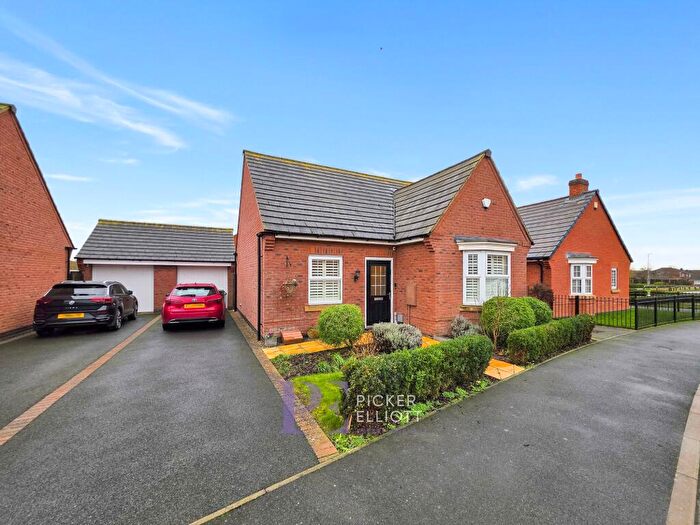
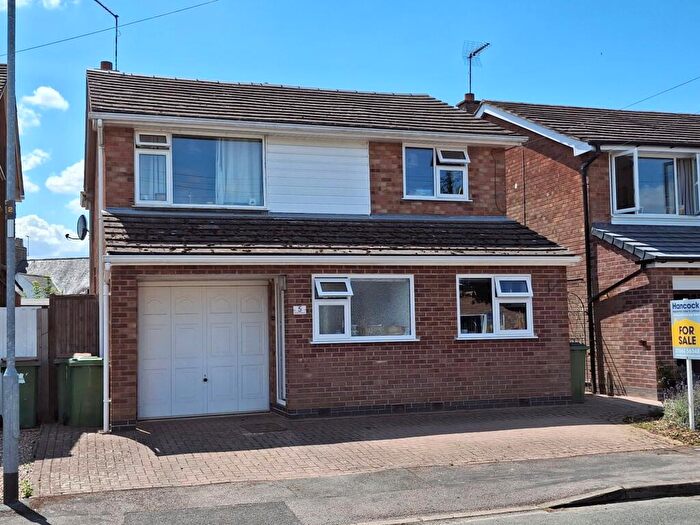
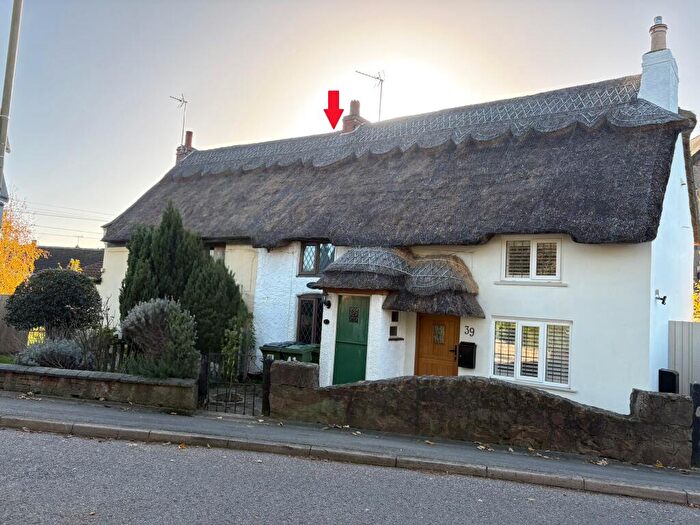
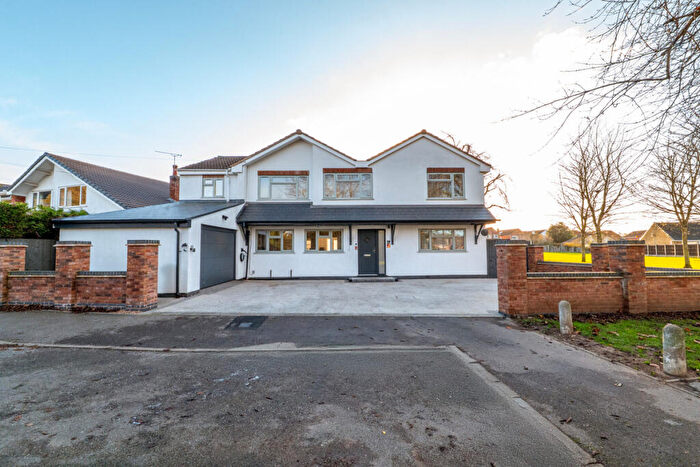
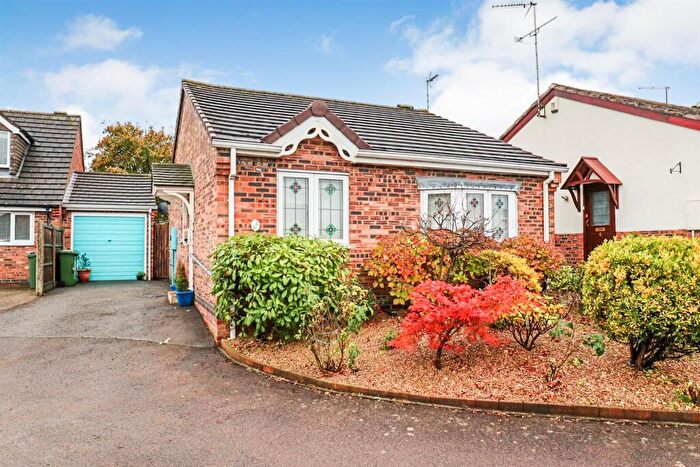
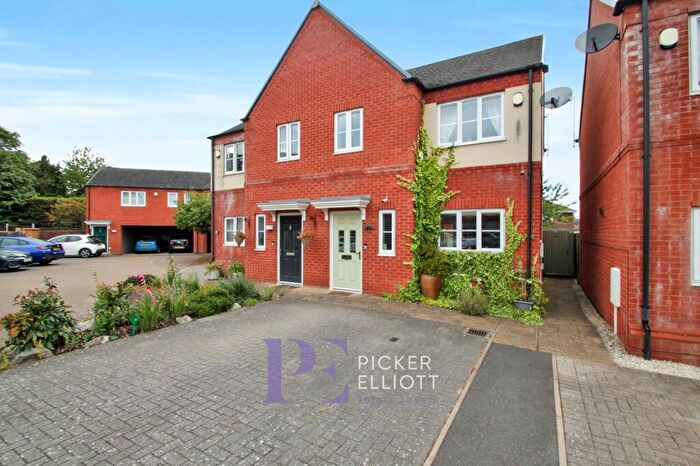
Properties in Stanton And Flamville have an average house price of £358,607.00 and had 42 Property Transactions within the last 3 years¹.
Stanton And Flamville is an area in Hinckley, Leicestershire with 512 households², where the most expensive property was sold for £825,000.00.
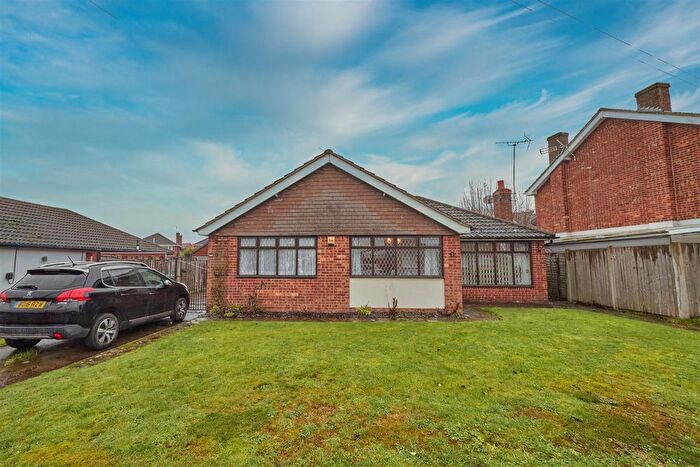
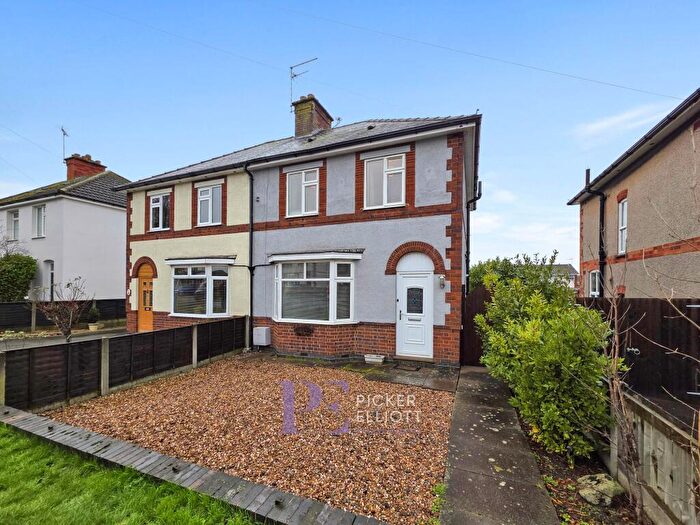
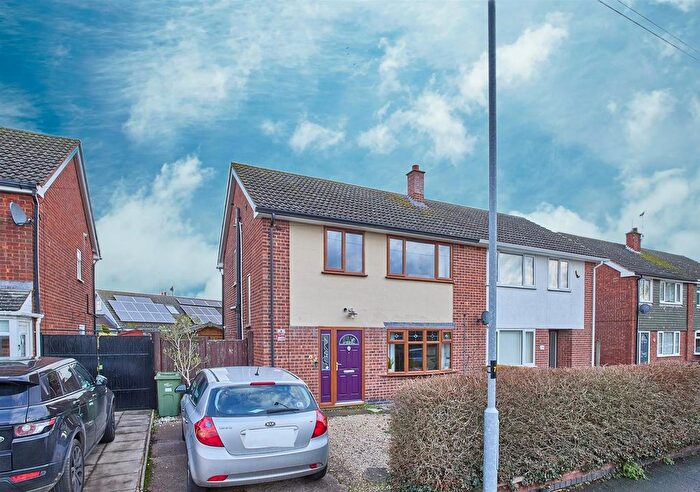
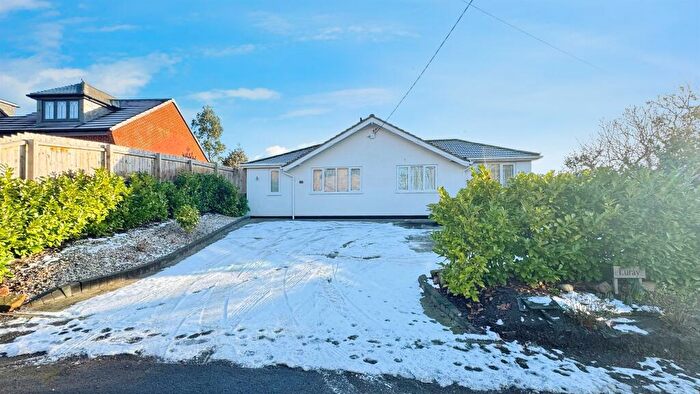
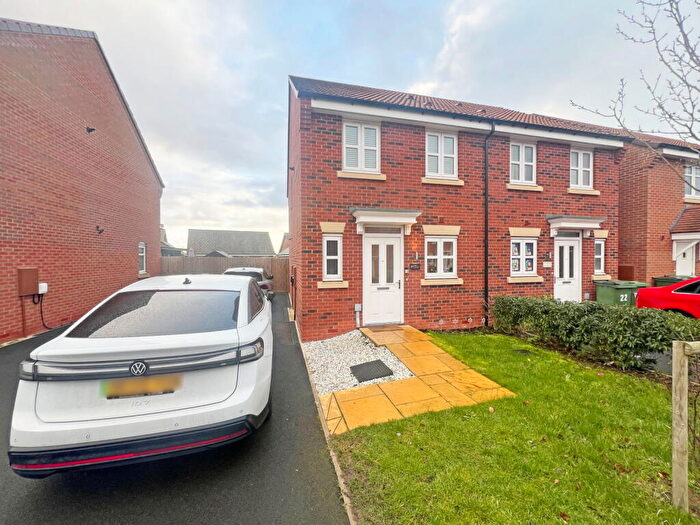
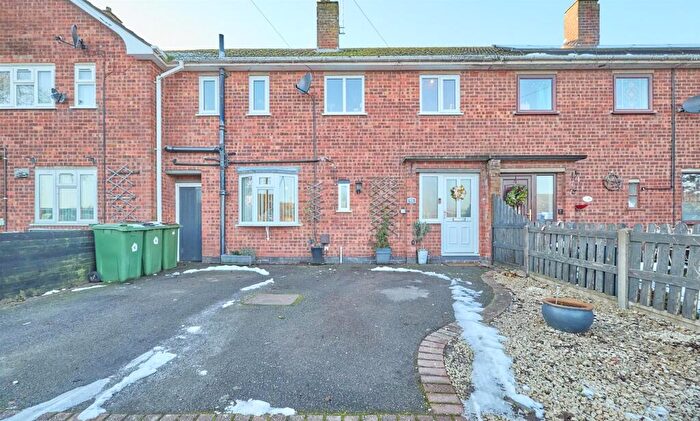
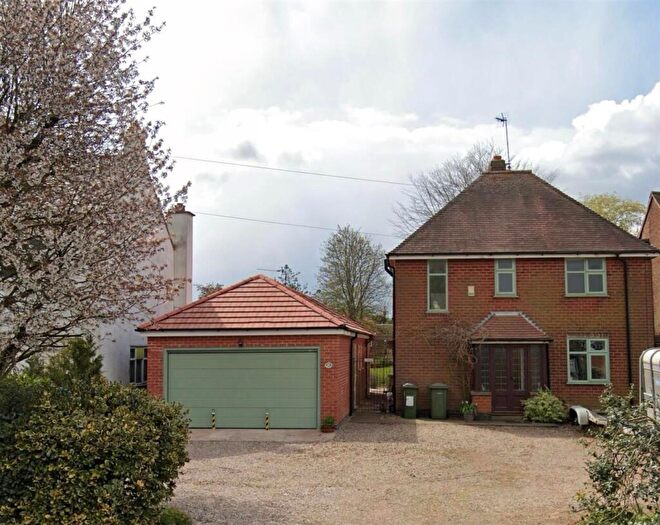
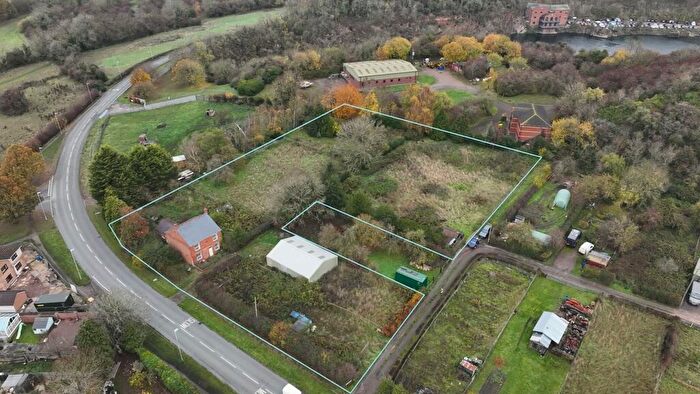
Properties for sale in Stanton And Flamville
Roads and Postcodes in Stanton And Flamville
Navigate through our locations to find the location of your next house in Stanton And Flamville, Hinckley for sale or to rent.
| Streets | Postcodes |
|---|---|
| Aston Lane | LE10 3AA LE10 3PA |
| Brookfield | LE10 3PB |
| Buckinghams Way | LE10 3PX |
| Bumble Bee Gardens | LE10 3PD |
| Bumble Bee Lane | LE10 3AE |
| Butler Close | LE10 3QE |
| Chapel Lane | LE10 3PE |
| Chapel Street | LE10 3PF |
| Coopers Close | LE10 3BD |
| Coventry Road | LE10 3AP LE10 3PG |
| Fosse Close | LE10 3PQ |
| Fosseway | LE10 3AB |
| Fox Hollies | LE10 3PH |
| Frolesworth Road | LE10 3AD |
| Halls Crescent | LE10 3PL |
| Henson Way | LE10 3PN |
| High Lees | LE10 3PW |
| Hinckley Road | LE10 3AF LE10 3AG |
| Holyoak Drive | LE10 3QA |
| Leicester Road | LE10 3PP LE10 3PR |
| Lychgate Lane | LE10 3AQ LE10 3AX |
| Manor House Close | LE10 3AU |
| Mill Lane | LE10 3PS |
| Park View | LE10 3PT |
| Parsons Lane | LE10 3PY |
| School Lane | LE10 3PU |
| Sharnbrook Gardens | LE10 3QD |
| Sharnford Mews | LE10 3BJ |
| Sharnford Road | LE10 3AW |
| St Helens Close | LE10 3NT |
| The Green | LE10 3AN LE10 3PJ |
| Willowbrook Close | LE10 3PZ |
Transport near Stanton And Flamville
-
Hinckley Station
-
Narborough Station
-
Nuneaton Station
-
Bermuda Park Station
-
Bedworth Station
-
South Wigston Station
-
Coventry Arena Station
- FAQ
- Price Paid By Year
- Property Type Price
Frequently asked questions about Stanton And Flamville
What is the average price for a property for sale in Stanton And Flamville?
The average price for a property for sale in Stanton And Flamville is £358,607. This amount is 33% higher than the average price in Hinckley. There are 455 property listings for sale in Stanton And Flamville.
What streets have the most expensive properties for sale in Stanton And Flamville?
The streets with the most expensive properties for sale in Stanton And Flamville are The Green at an average of £808,000, Lychgate Lane at an average of £805,000 and Holyoak Drive at an average of £588,000.
What streets have the most affordable properties for sale in Stanton And Flamville?
The streets with the most affordable properties for sale in Stanton And Flamville are St Helens Close at an average of £200,000, Fox Hollies at an average of £240,666 and Leicester Road at an average of £261,400.
Which train stations are available in or near Stanton And Flamville?
Some of the train stations available in or near Stanton And Flamville are Hinckley, Narborough and Nuneaton.
Property Price Paid in Stanton And Flamville by Year
The average sold property price by year was:
| Year | Average Sold Price | Price Change |
Sold Properties
|
|---|---|---|---|
| 2025 | £351,818 | 5% |
11 Properties |
| 2024 | £333,531 | -17% |
16 Properties |
| 2023 | £390,333 | 14% |
15 Properties |
| 2022 | £334,200 | -12% |
16 Properties |
| 2021 | £375,283 | 17% |
30 Properties |
| 2020 | £311,156 | -18% |
22 Properties |
| 2019 | £367,225 | 10% |
20 Properties |
| 2018 | £329,088 | 28% |
22 Properties |
| 2017 | £235,928 | -23% |
14 Properties |
| 2016 | £291,288 | 2% |
22 Properties |
| 2015 | £284,037 | 29% |
19 Properties |
| 2014 | £202,684 | -10% |
19 Properties |
| 2013 | £222,632 | 9% |
17 Properties |
| 2012 | £203,214 | -11% |
14 Properties |
| 2011 | £225,558 | -29% |
12 Properties |
| 2010 | £291,930 | 27% |
15 Properties |
| 2009 | £212,241 | 7% |
6 Properties |
| 2008 | £198,095 | -6% |
10 Properties |
| 2007 | £209,857 | -13% |
14 Properties |
| 2006 | £236,447 | -20% |
20 Properties |
| 2005 | £282,580 | 15% |
18 Properties |
| 2004 | £239,593 | 24% |
23 Properties |
| 2003 | £182,164 | 18% |
27 Properties |
| 2002 | £148,793 | 10% |
30 Properties |
| 2001 | £134,320 | -16% |
20 Properties |
| 2000 | £155,668 | 37% |
15 Properties |
| 1999 | £97,772 | -3% |
20 Properties |
| 1998 | £101,015 | 12% |
20 Properties |
| 1997 | £88,830 | 14% |
18 Properties |
| 1996 | £76,720 | -8% |
20 Properties |
| 1995 | £82,789 | - |
11 Properties |
Property Price per Property Type in Stanton And Flamville
Here you can find historic sold price data in order to help with your property search.
The average Property Paid Price for specific property types in the last three years are:
| Property Type | Average Sold Price | Sold Properties |
|---|---|---|
| Semi Detached House | £283,888.00 | 18 Semi Detached Houses |
| Detached House | £443,880.00 | 21 Detached Houses |
| Terraced House | £210,000.00 | 3 Terraced Houses |

