
Houses for sale in Hinckley, Leicestershire
House Prices in Hinckley
Properties in Hinckley have an average house price of £270k and had 2,455 Property Transactions within the last 3 years.¹
Hinckley is an area in Leicestershire with 22,914 households², where the most expensive property was sold for £1.25M.
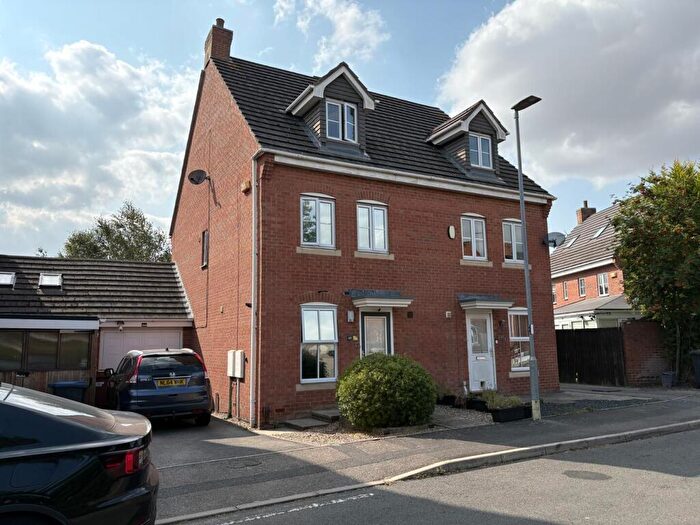
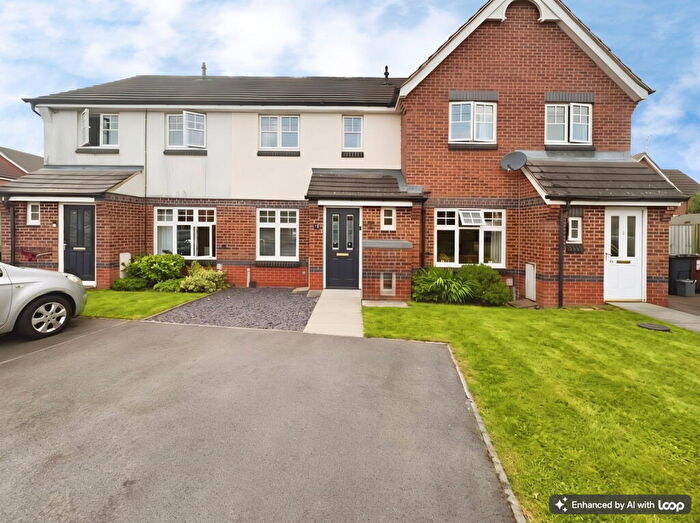
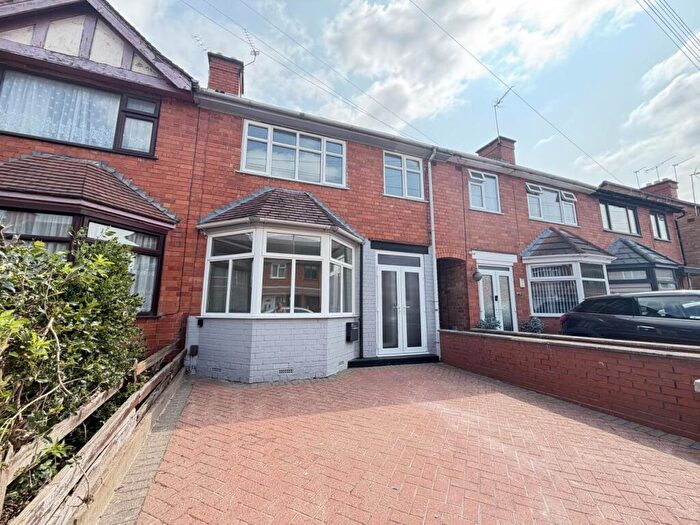
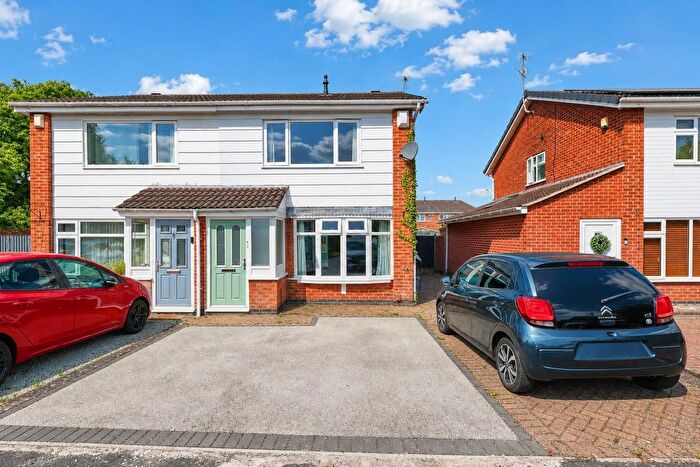
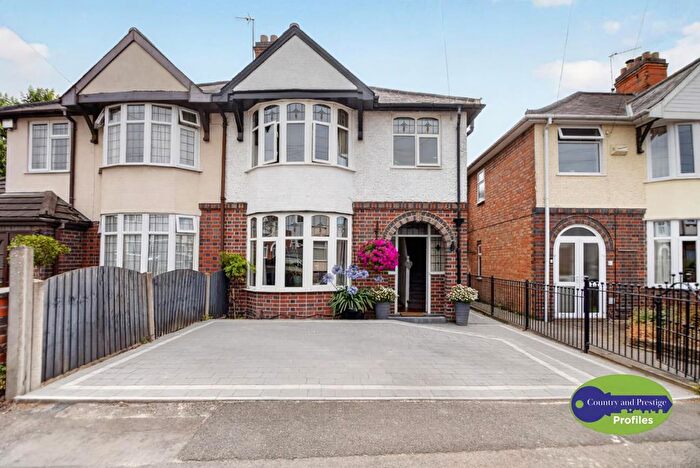
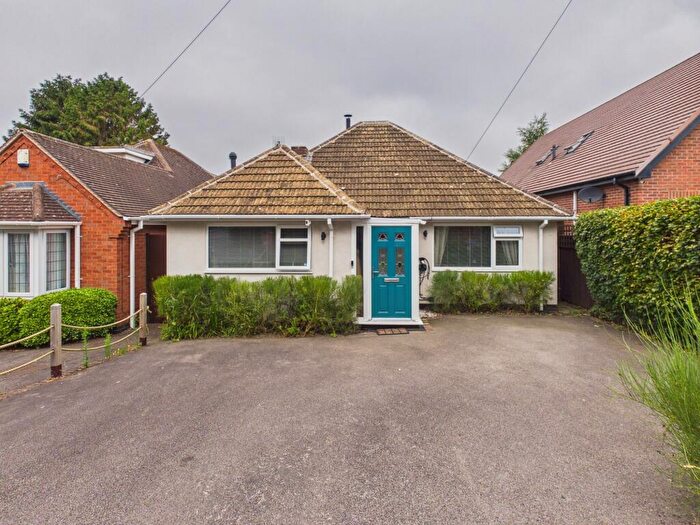
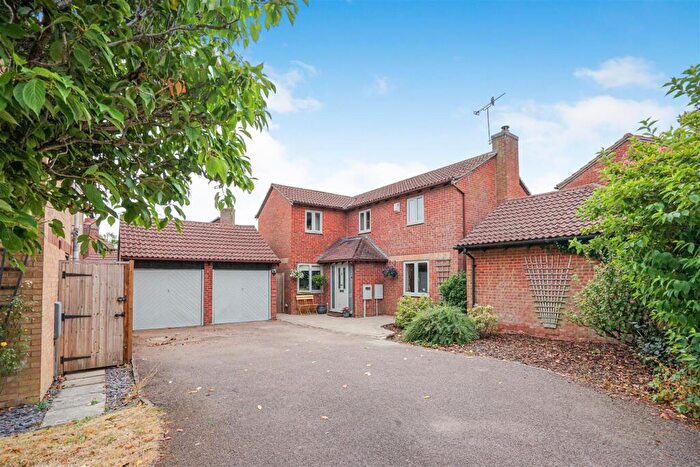
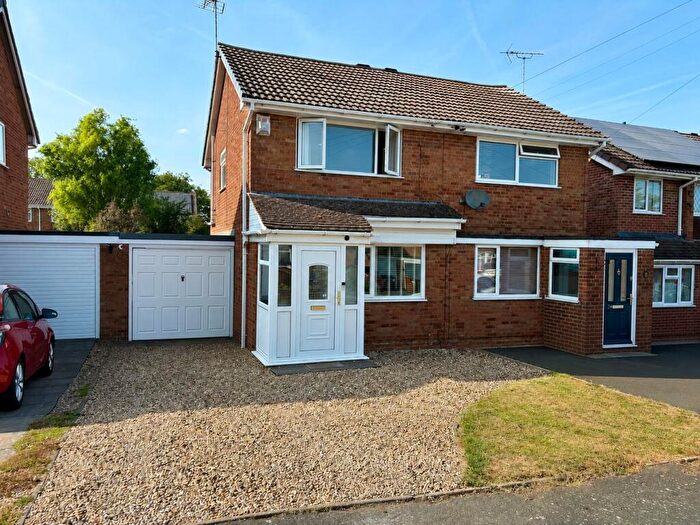
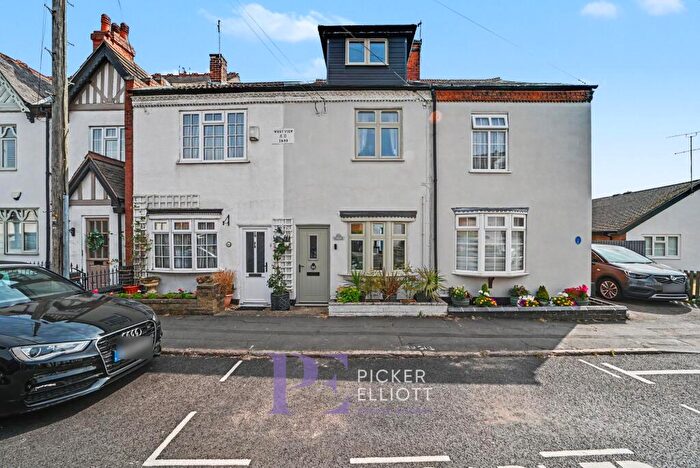
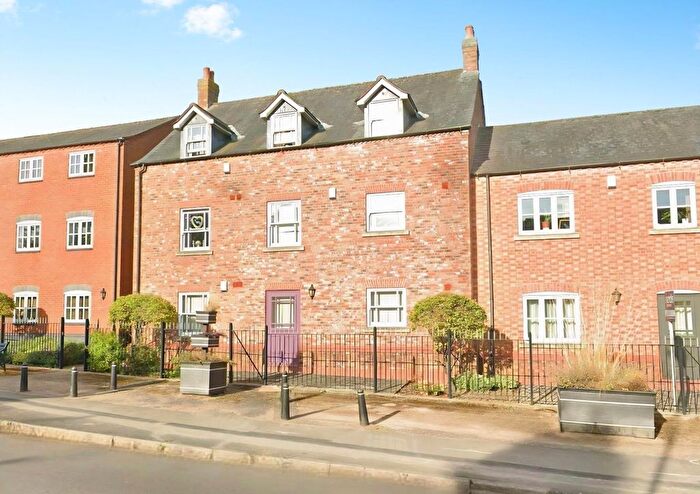
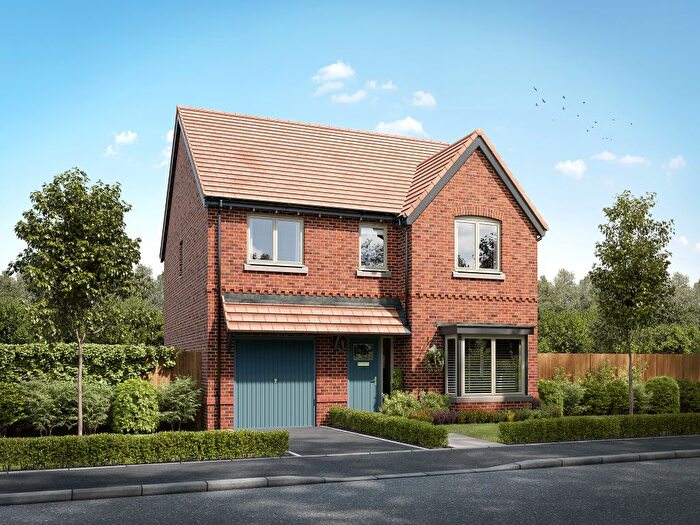
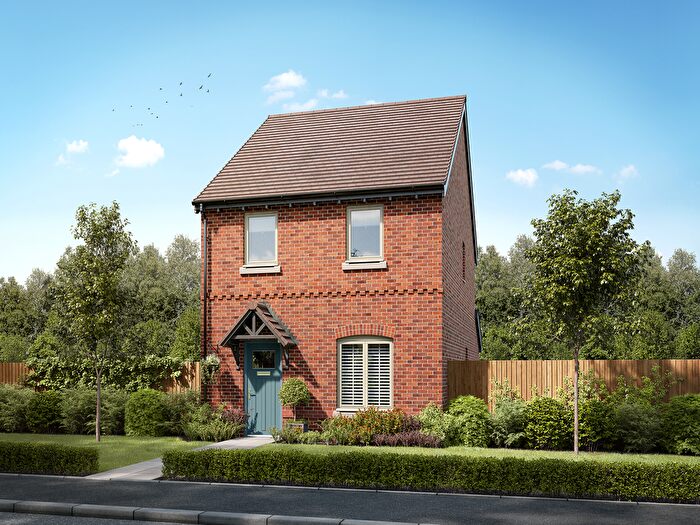
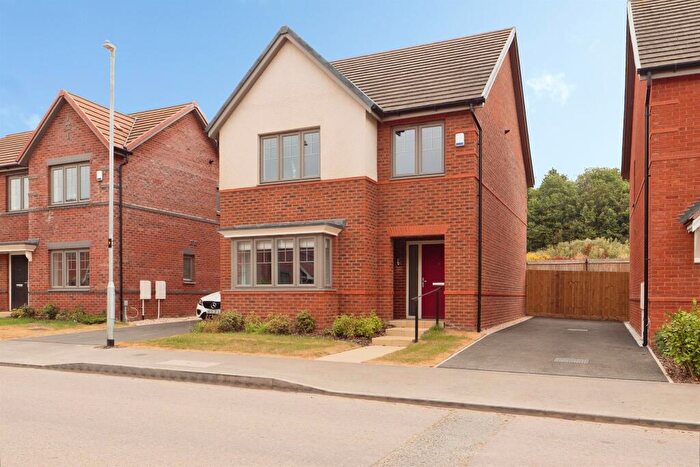
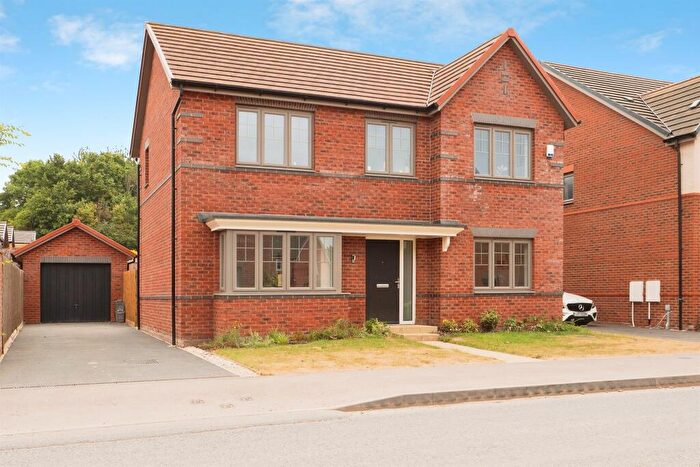
Properties for sale in Hinckley
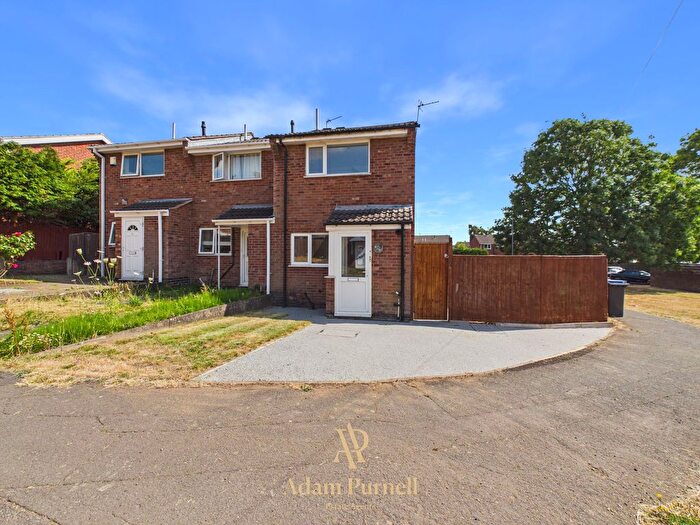
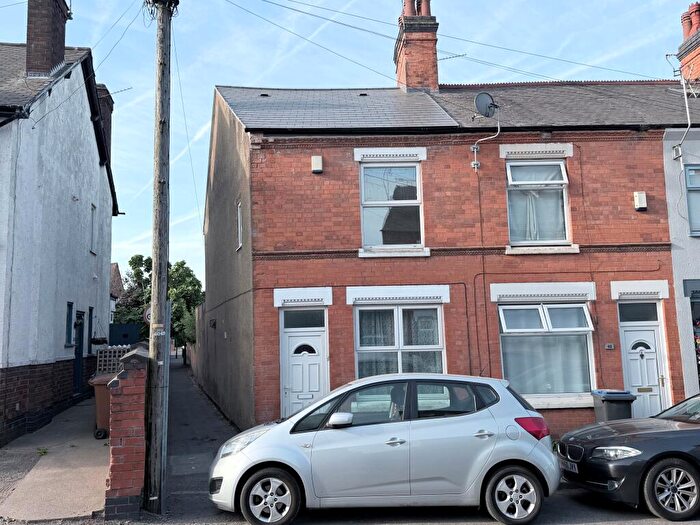
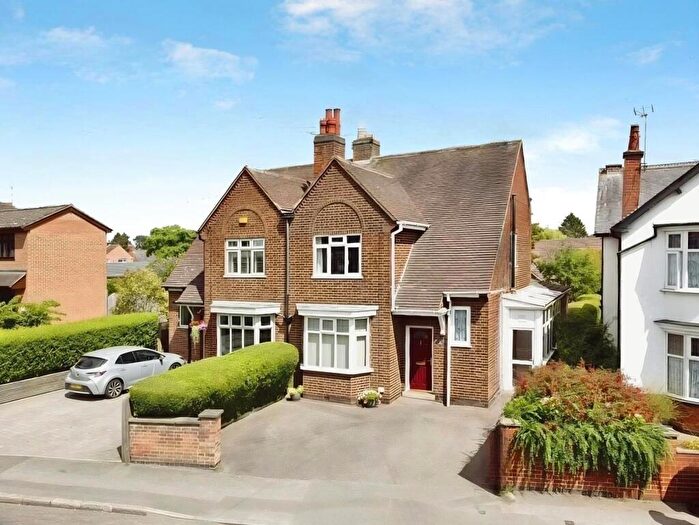
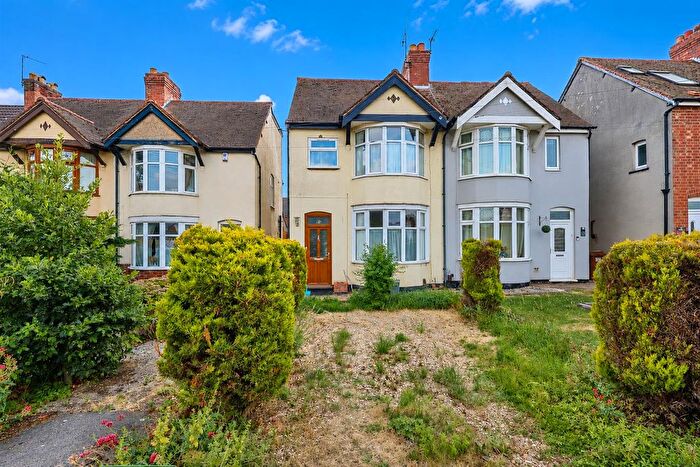
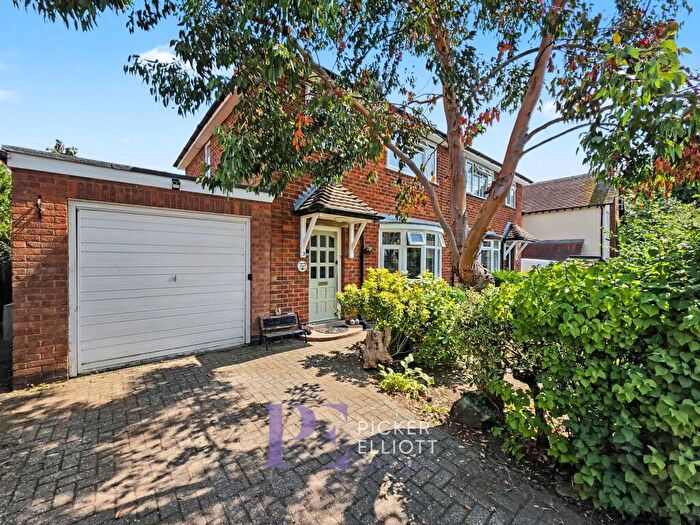
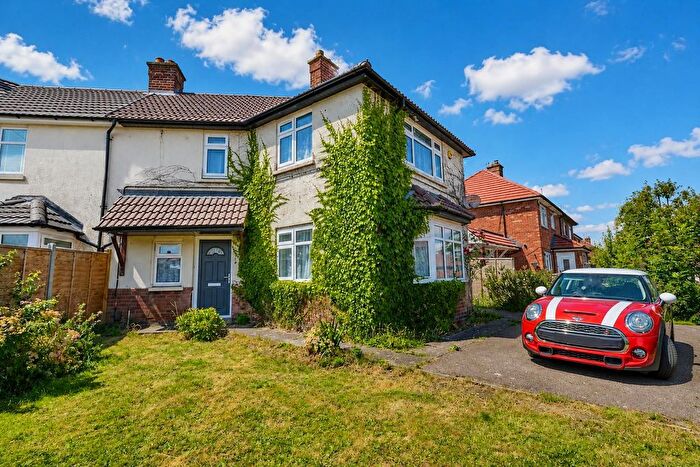
![]()
If you are looking to sell your house, let it out, or receive a property valuation, an expert can help you.
Click the button below to get started.


Neighbourhoods in Hinckley
Navigate through our locations to find the location of your next house in Hinckley, Leicestershire for sale or to rent.
Property price trends in Hinckley
According to the latest Land Registry data, the average home in Hinckley sold for £286,798 in 2026. That figure comes from a substantial record of 31,521 sales logged over the past 31 years.
Prices have continued to climb over the last three years. Compared with 2023, when the typical sale came in around £260,851, that's a rise of roughly 9.9%.
Looking back five years, average prices are up about 13.7% since 2021, a gain of around £34,456 in cash terms.
Zoom out to the past decade for the fuller picture. Back in 2016, homes here averaged £191,738, so the typical sold price has climbed about 49.6% since then, roughly 4.1% a year. Stretch the view to fifteen years and that annual pace eases back to about 3.8%.
Frequently asked questions about Hinckley
What is the average price for a property for sale in Hinckley?
The average price for a property for sale in Hinckley is £270,225. This amount is 11% lower than the average price in Leicestershire. There are 8,317 property listings for sale in Hinckley.
What locations have the most expensive properties for sale in Hinckley?
The locations with the most expensive properties for sale in Hinckley are Stanton And Flamville at an average of £352,533, Burbage St Catherines And Lash Hill at an average of £320,029 and Croft Hill at an average of £320,000.
What locations have the most affordable properties for sale in Hinckley?
The locations with the most affordable properties for sale in Hinckley are Hinckley Castle at an average of £224,757, Hinckley Trinity at an average of £238,250 and Hinckley Clarendon at an average of £241,866.
Which train stations are available in or near Hinckley?
Some of the train stations available in or near Hinckley are Hinckley, Nuneaton and Bermuda Park.
Property Price Paid in Hinckley by Year
The average sold property price by year was:
| Year | Average Sold Price | Price Change |
Sold Properties
|
|---|---|---|---|
| 2026 | £286,798 | 2% |
52 Properties |
| 2025 | £281,467 | 6% |
869 Properties |
| 2024 | £265,555 | 2% |
797 Properties |
| 2023 | £260,851 | -3% |
737 Properties |
| 2022 | £267,608 | 6% |
909 Properties |
| 2021 | £252,342 | 6% |
1,190 Properties |
| 2020 | £236,813 | 5% |
873 Properties |
| 2019 | £224,081 | 0,1% |
988 Properties |
| 2018 | £223,839 | 4% |
981 Properties |
| 2017 | £214,292 | 11% |
1,181 Properties |
Property Price per Property Type in Hinckley
Here you can find historic sold price data in order to help with your property search.
The average Property Paid Price for specific property types in the last three years are:
| Property Type | Average Sold Price | Sold Properties |
|---|---|---|
| Semi Detached House | £248,356.00 | 956 Semi Detached Houses |
| Detached House | £389,991.00 | 754 Detached Houses |
| Terraced House | £198,602.00 | 521 Terraced Houses |
| Flat | £127,010.00 | 224 Flats |
Transport in Hinckley
Please see below transportation links in this area:
