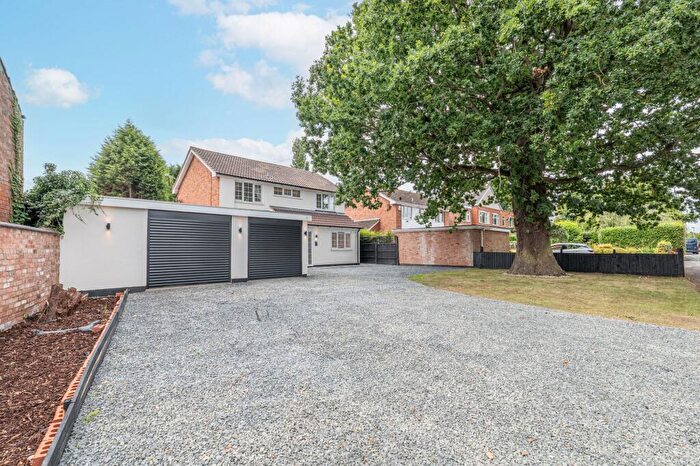
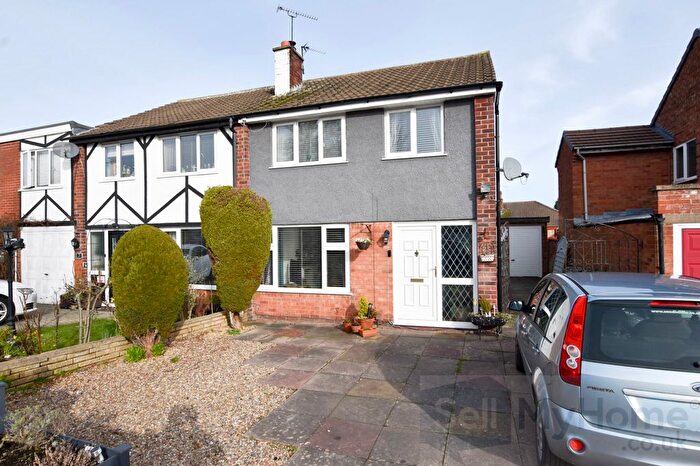
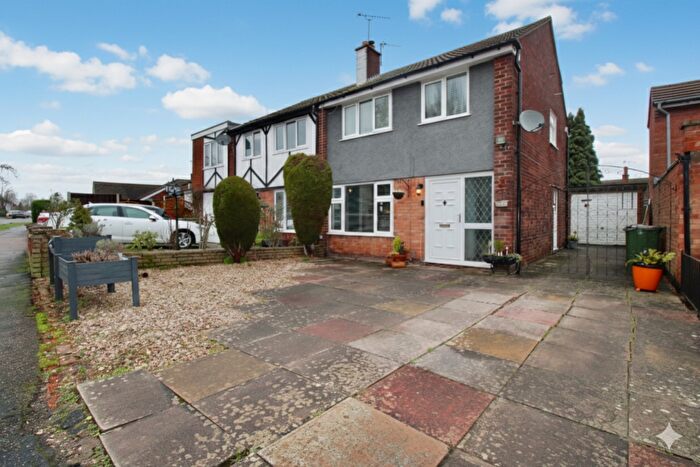
Houses for sale & to rent in Muxloe, Leicester
House Prices in Muxloe
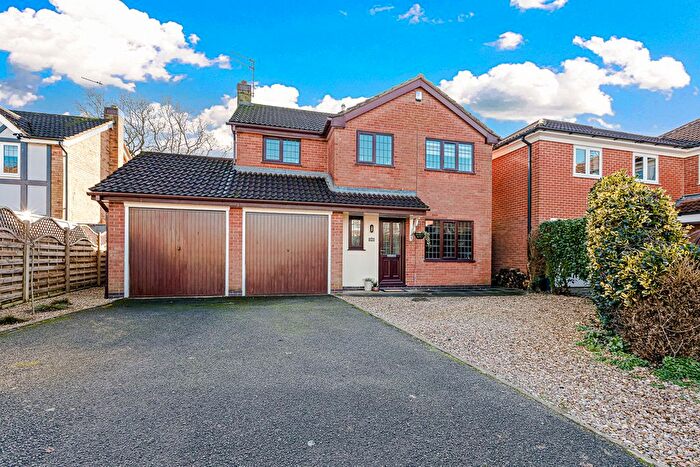
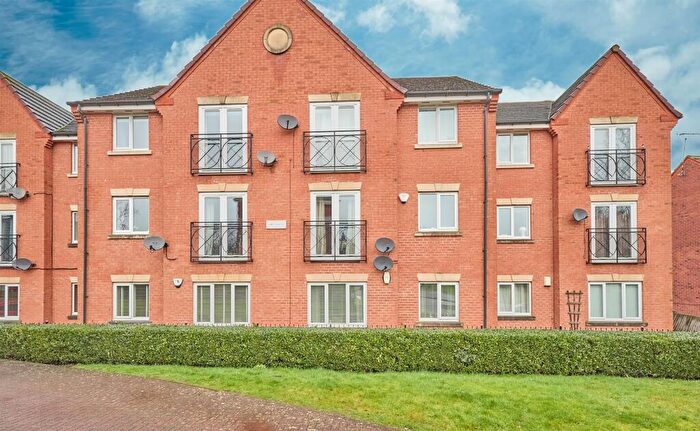
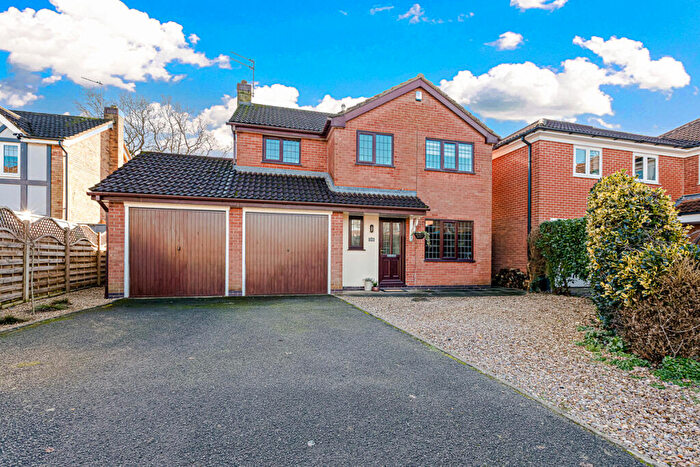
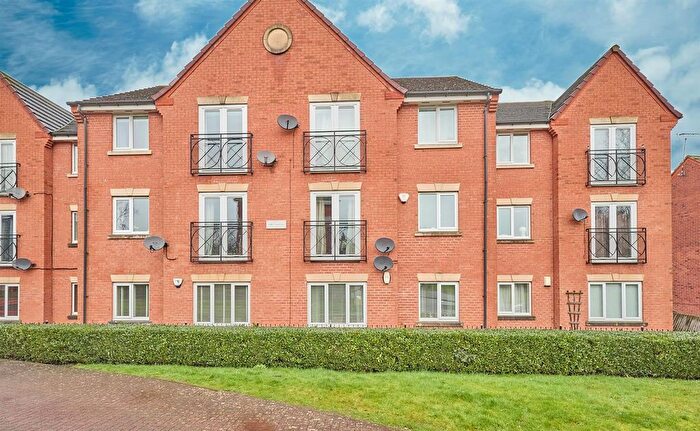
Properties in Muxloe have an average house price of £457,889.00 and had 187 Property Transactions within the last 3 years¹.
Muxloe is an area in Leicester, Leicestershire with 1,806 households², where the most expensive property was sold for £3,000,000.00.
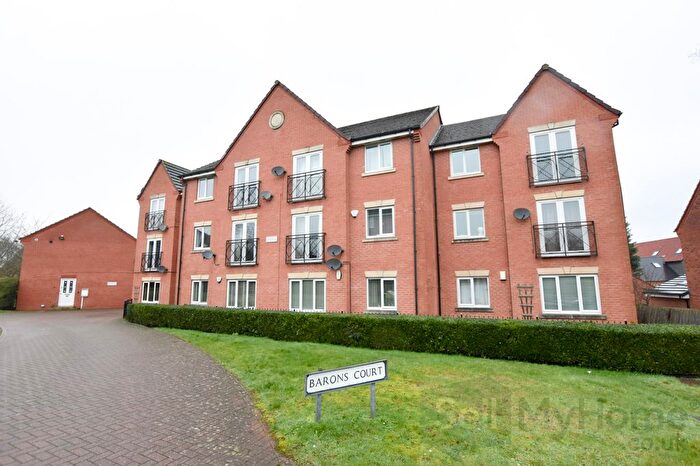
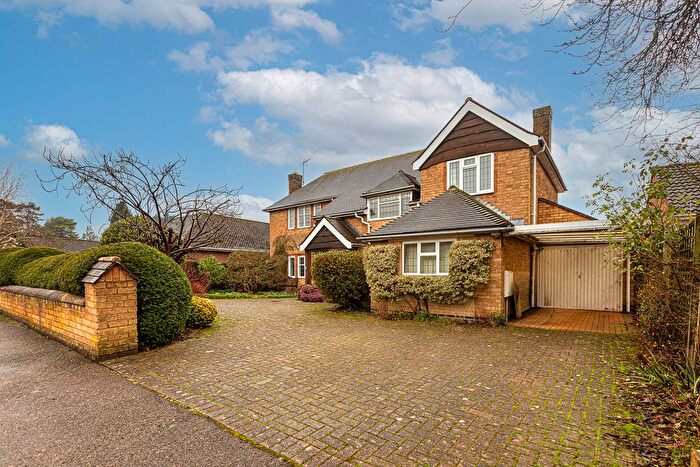
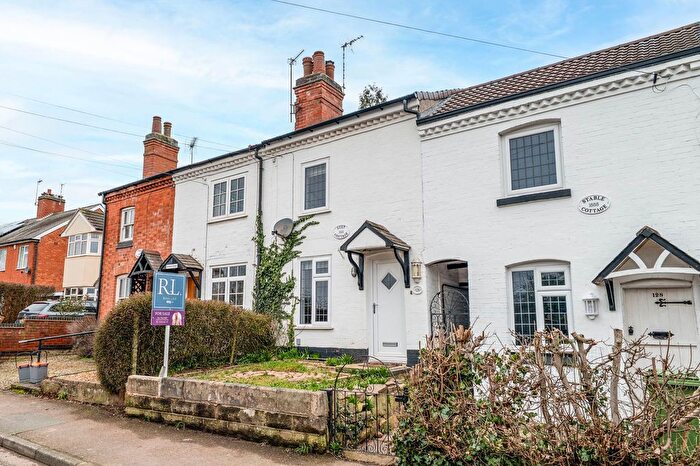
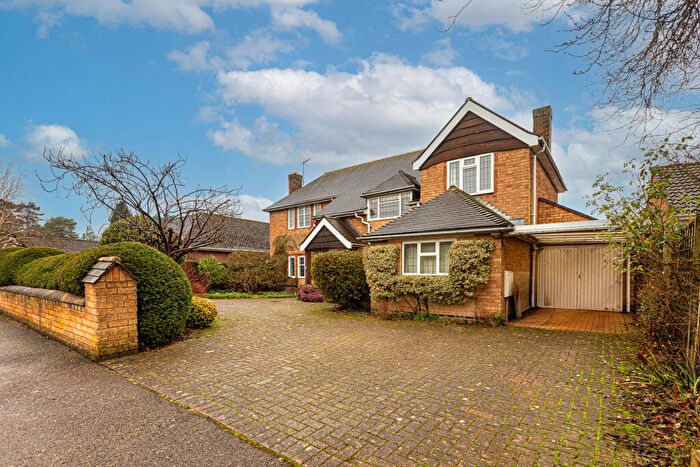
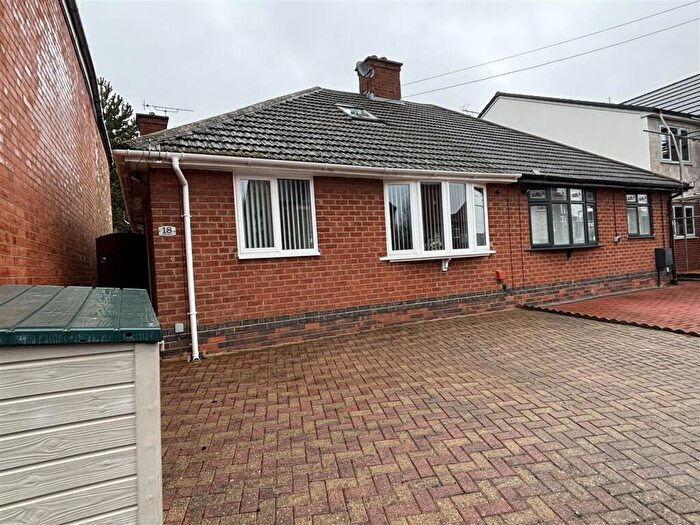
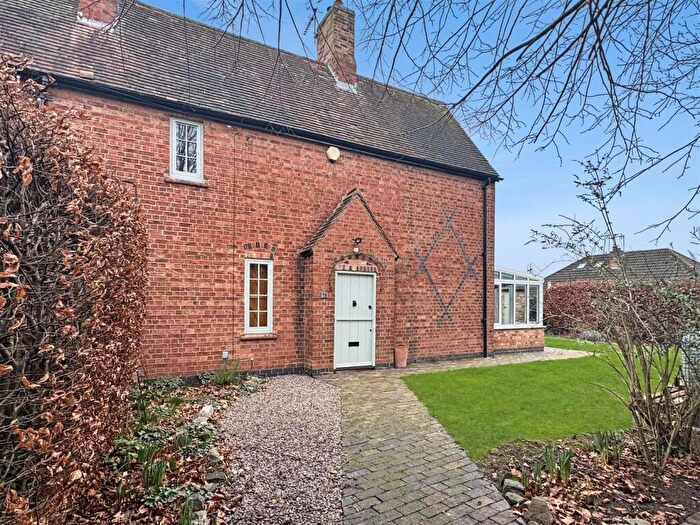
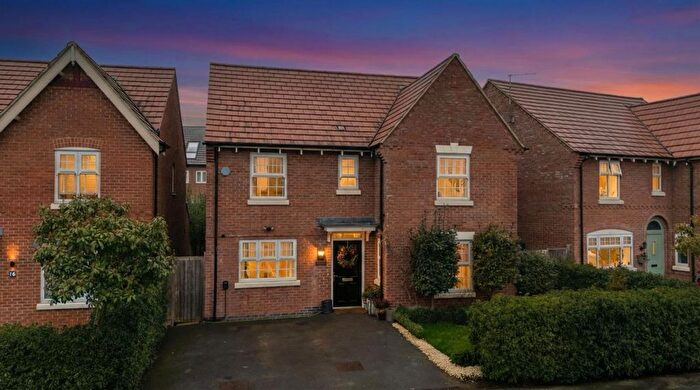
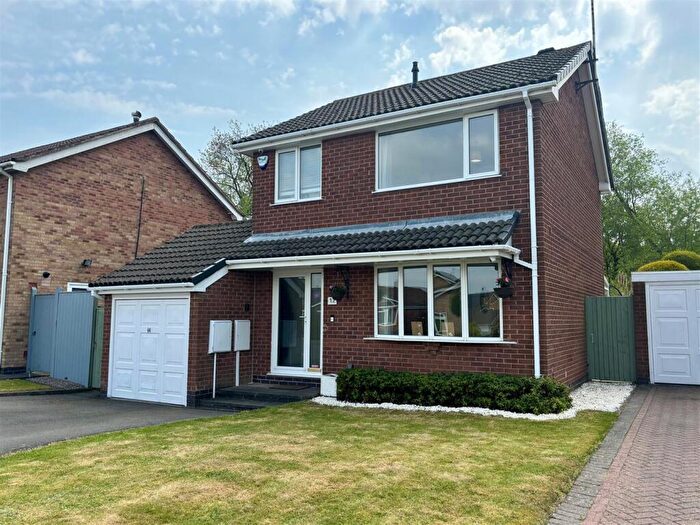
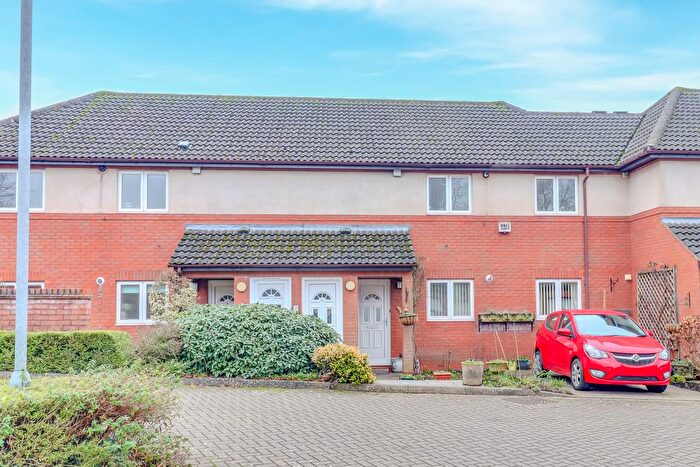
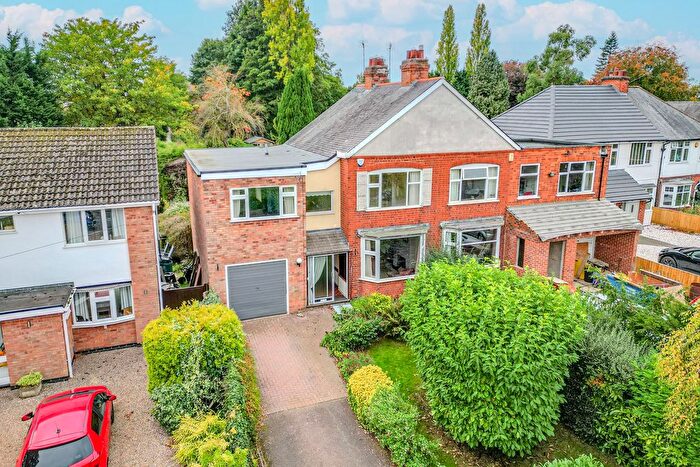
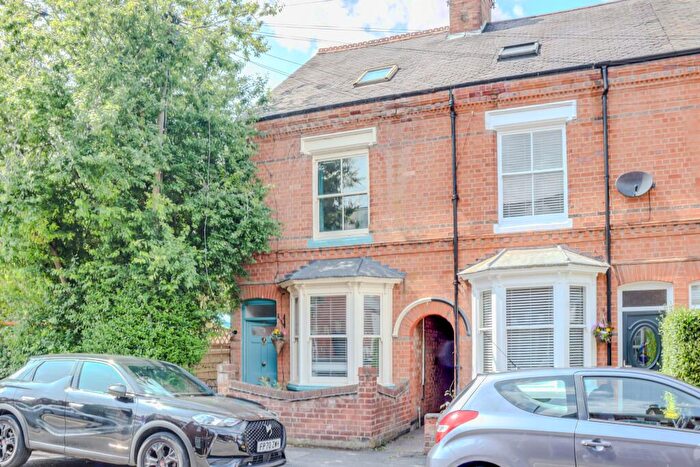
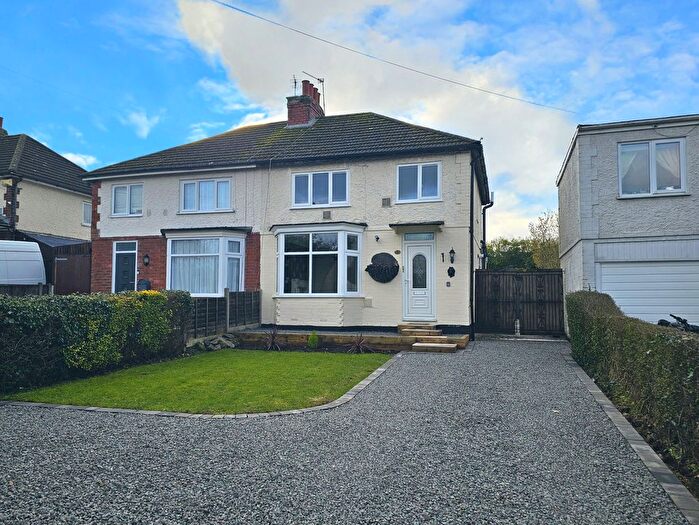
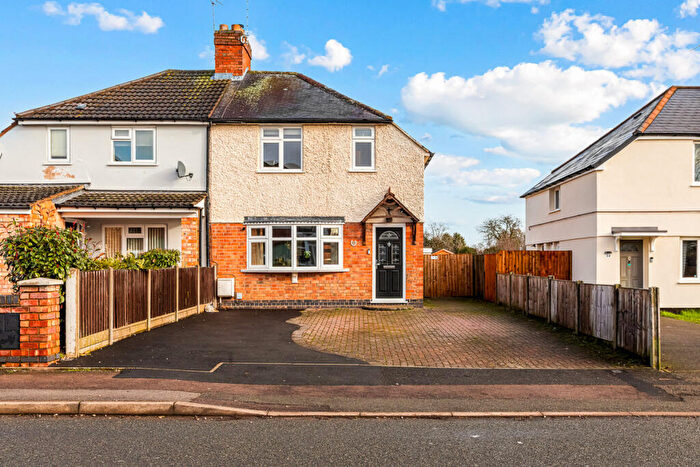
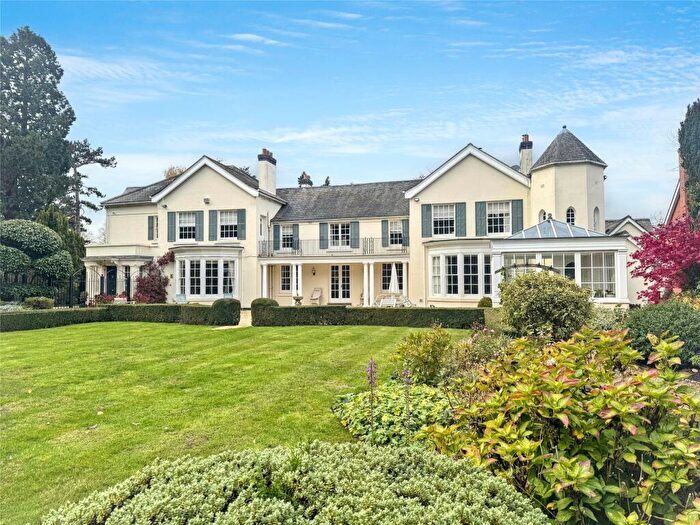
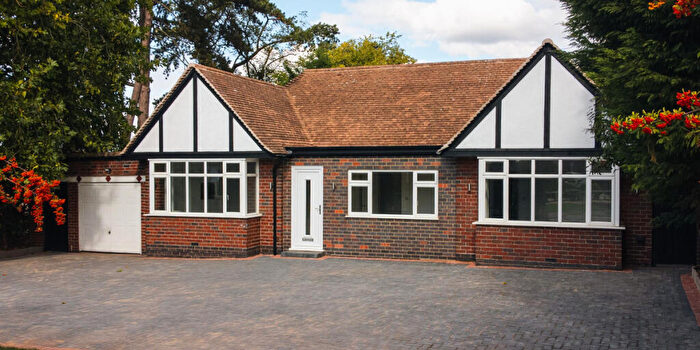
Properties for sale in Muxloe
Roads and Postcodes in Muxloe
Navigate through our locations to find the location of your next house in Muxloe, Leicester for sale or to rent.
| Streets | Postcodes |
|---|---|
| Abbot Close | LE9 2DQ |
| Armson Avenue | LE9 2DA LE9 2DB |
| Barbara Avenue | LE9 2HD LE9 2HE |
| Barns Close | LE9 2BA |
| Barry Close | LE9 2HF |
| Barry Drive | LE9 2HG LE9 2HH LE9 2HJ |
| Barwell Road | LE9 2AA |
| Bluebell Close | LE9 2AW |
| Carey Gardens | LE9 2AY |
| Carlyon Court | LE9 2AJ |
| Castle Road | LE9 2AB LE9 2AZ |
| Cherry Tree Avenue | LE9 2HN LE9 2HP |
| Cherry Tree Court | LE9 2LQ |
| Church Road | LE9 2AD |
| Court Close | LE9 2DD |
| Desford Road | LE9 2BB LE9 2BD |
| Enterprise Houses | LE9 2AE |
| Farley Way | LE9 2AF |
| Forest Drive | LE9 2EA |
| Forest Rise | LE9 2HQ |
| Fox Lane | LE9 2AG |
| Garfit Road | LE9 2DE |
| Glenfield Lane | LE9 2AH |
| Gullet Lane | LE9 2BL |
| Harene Crescent | LE9 2HS |
| Hastings Meadow Close | LE9 2DR |
| Hastings Road | LE9 2EE |
| Hawthorn Close | LE9 2HT |
| Hedgerow Lane | LE9 2BN |
| Hewitt Drive | LE9 2EB |
| Highland Avenue | LE9 2HU |
| Hinckley Road | LE9 9JE |
| Holmewood Drive | LE9 2EF |
| Holt Drive | LE9 2EX |
| Howards Court | LE9 2BY |
| Ladysmith Road | LE9 2BS LE9 2BH |
| Lime Grove | LE9 2DF |
| Linden Lane | LE9 2EG |
| Links Road | LE9 2BP |
| Main Street | LE9 2AL LE9 2AN LE9 2AP LE9 2AU |
| Martin Avenue | LE9 2JH |
| Maytree Close | LE9 2LB LE9 2LD |
| Maytree Drive | LE9 2LP |
| Oak Spinney Park | LE3 3AW LE3 3JZ |
| Oakcroft Avenue | LE9 2DG LE9 2DH |
| Pine Tree Grove | LE9 2JJ |
| Portland Road | LE9 2EH |
| Pretoria Road | LE9 2BT |
| Primrose Way | LE9 2AX |
| Princess Drive | LE9 2DJ |
| Ratby Lane | LE9 2AQ |
| Ratby Lane Forest East | LE3 3PZ |
| Roman Avenue | LE3 8JT |
| Rosendene Close | LE9 2EZ |
| Roundhill | LE9 2DY |
| Shepherd Close | LE9 2HX |
| Stamford Road | LE9 2ER |
| Station Close | LE9 2ES |
| Station Drive | LE9 2ET |
| Station Road | LE9 2EJ LE9 2EL LE9 2EN LE9 2EP |
| The Croft | LE9 2AR |
| The Fairway | LE9 2EU |
| The Huntings | LE9 2BX |
| The Keep | LE9 2DL |
| Towers Close | LE9 2EY |
| Towers Drive | LE9 2EW |
| Valjean Crescent | LE9 2JN |
| Vicarage Close | LE9 2AS |
| Walton Close | LE9 2DZ |
| Wentworth Green | LE9 2EQ |
| Wilshere Close | LE9 2DN |
| Woodlands Lane | LE9 2AT |
| LE9 2FA LE9 2FB LE9 2WN LE9 2WU |
Transport near Muxloe
-
Narborough Station
-
Leicester Station
-
South Wigston Station
-
Syston Station
-
Sileby Station
-
Barrow-Upon-Soar Station
-
Hinckley Station
- FAQ
- Price Paid By Year
- Property Type Price
Frequently asked questions about Muxloe
What is the average price for a property for sale in Muxloe?
The average price for a property for sale in Muxloe is £457,889. This amount is 47% higher than the average price in Leicester. There are 1,770 property listings for sale in Muxloe.
What streets have the most expensive properties for sale in Muxloe?
The streets with the most expensive properties for sale in Muxloe are Holmewood Drive at an average of £3,000,000, Stamford Road at an average of £1,758,333 and Roundhill at an average of £1,212,500.
What streets have the most affordable properties for sale in Muxloe?
The streets with the most affordable properties for sale in Muxloe are Carey Gardens at an average of £135,000, Bluebell Close at an average of £199,250 and Farley Way at an average of £211,250.
Which train stations are available in or near Muxloe?
Some of the train stations available in or near Muxloe are Narborough, Leicester and South Wigston.
Property Price Paid in Muxloe by Year
The average sold property price by year was:
| Year | Average Sold Price | Price Change |
Sold Properties
|
|---|---|---|---|
| 2025 | £495,842 | 11% |
48 Properties |
| 2024 | £443,727 | -1% |
73 Properties |
| 2023 | £445,951 | 2% |
66 Properties |
| 2022 | £435,786 | 10% |
72 Properties |
| 2021 | £392,489 | 5% |
83 Properties |
| 2020 | £370,914 | 7% |
80 Properties |
| 2019 | £345,566 | 7% |
62 Properties |
| 2018 | £322,992 | -6% |
74 Properties |
| 2017 | £341,371 | 16% |
88 Properties |
| 2016 | £287,868 | -17% |
61 Properties |
| 2015 | £336,024 | 21% |
66 Properties |
| 2014 | £267,017 | 11% |
77 Properties |
| 2013 | £238,815 | -19% |
75 Properties |
| 2012 | £285,306 | -9% |
65 Properties |
| 2011 | £310,536 | 18% |
61 Properties |
| 2010 | £255,032 | 8% |
61 Properties |
| 2009 | £233,965 | -16% |
45 Properties |
| 2008 | £270,366 | -4% |
50 Properties |
| 2007 | £282,064 | -9% |
109 Properties |
| 2006 | £306,300 | 27% |
91 Properties |
| 2005 | £222,673 | 1% |
76 Properties |
| 2004 | £219,959 | 4% |
81 Properties |
| 2003 | £211,290 | 29% |
92 Properties |
| 2002 | £150,900 | 20% |
71 Properties |
| 2001 | £121,368 | -6% |
80 Properties |
| 2000 | £128,232 | 3% |
83 Properties |
| 1999 | £124,007 | 12% |
85 Properties |
| 1998 | £109,520 | 10% |
70 Properties |
| 1997 | £98,101 | 14% |
81 Properties |
| 1996 | £84,003 | -9% |
82 Properties |
| 1995 | £91,304 | - |
61 Properties |
Property Price per Property Type in Muxloe
Here you can find historic sold price data in order to help with your property search.
The average Property Paid Price for specific property types in the last three years are:
| Property Type | Average Sold Price | Sold Properties |
|---|---|---|
| Semi Detached House | £328,042.00 | 35 Semi Detached Houses |
| Detached House | £551,342.00 | 122 Detached Houses |
| Terraced House | £236,595.00 | 27 Terraced Houses |
| Flat | £164,000.00 | 3 Flats |

