
Houses for sale in Leicester, Leicestershire
House Prices in Leicester
Properties in Leicester have an average house price of £314k and had 11,218 Property Transactions within the last 3 years.¹
Leicester is an area in Leicestershire with 106,961 households², where the most expensive property was sold for £29M.
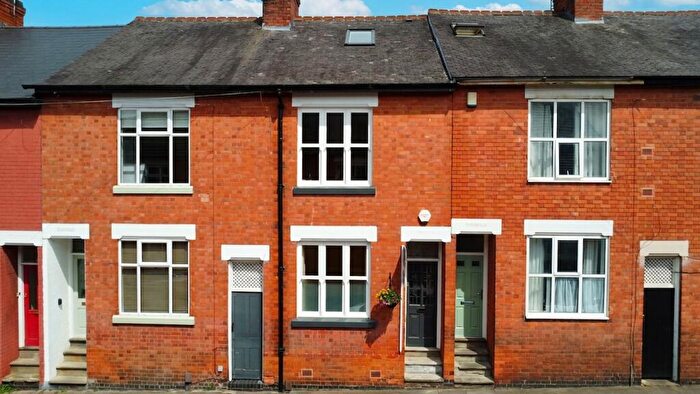
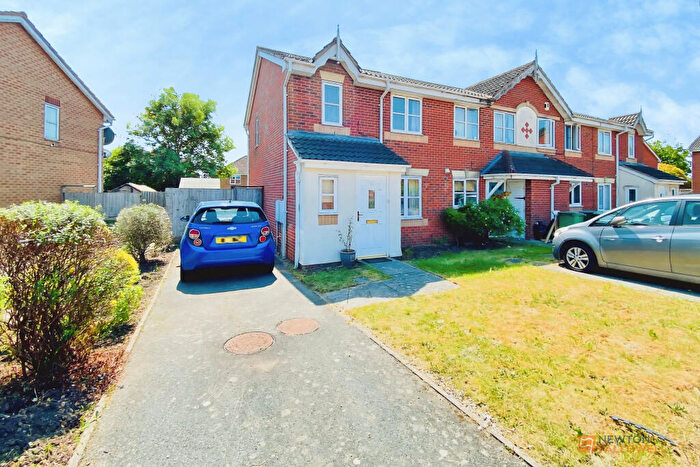
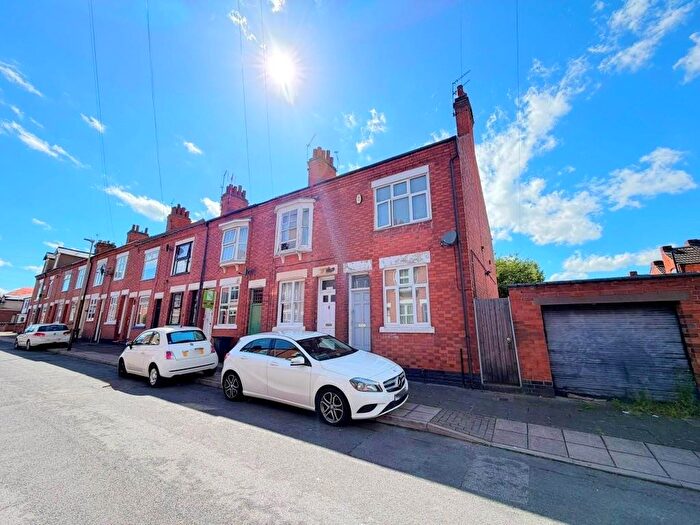
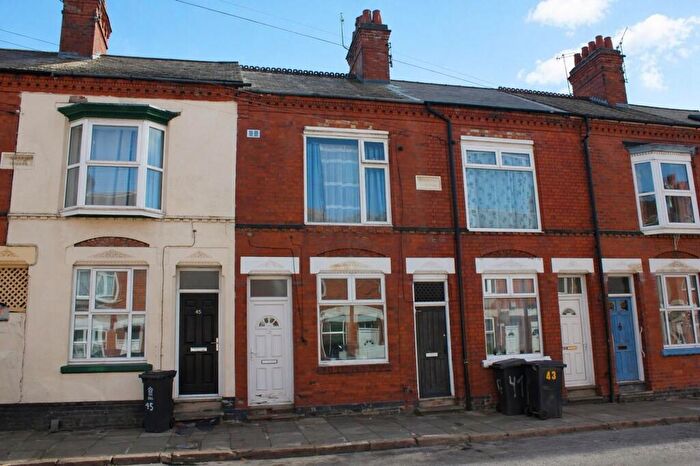
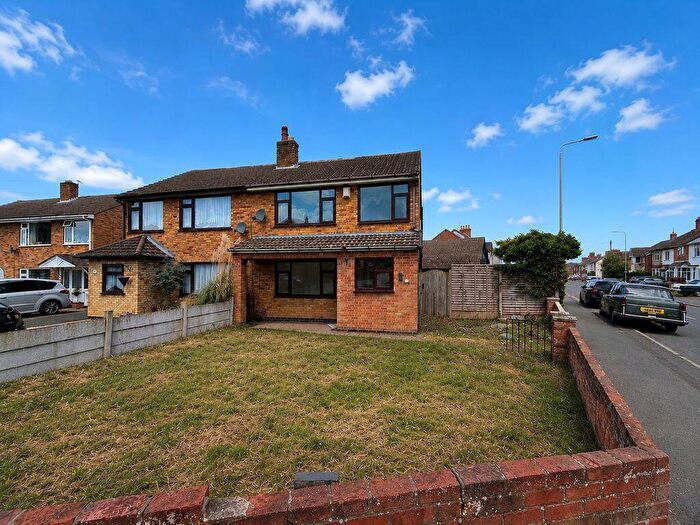
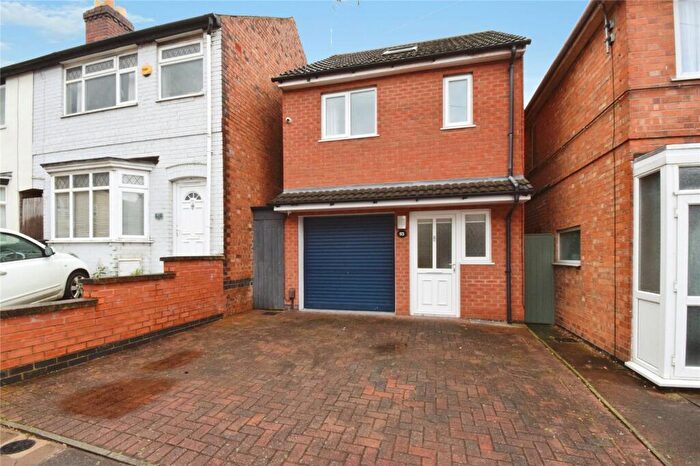
Properties for sale in Leicester
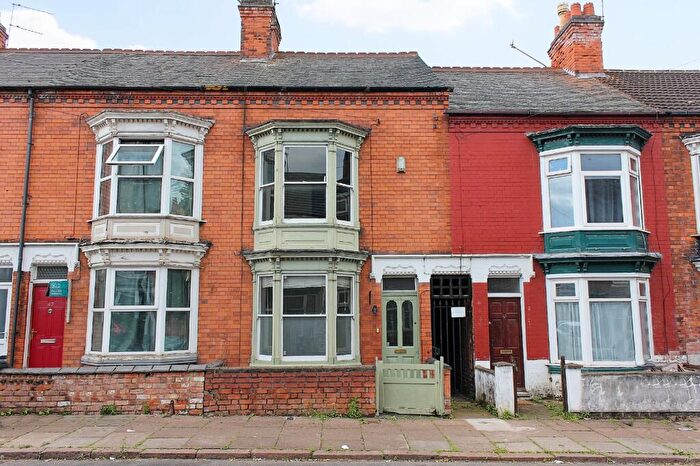
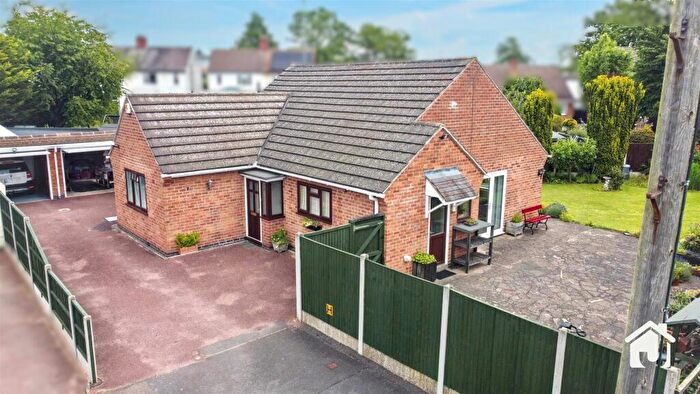
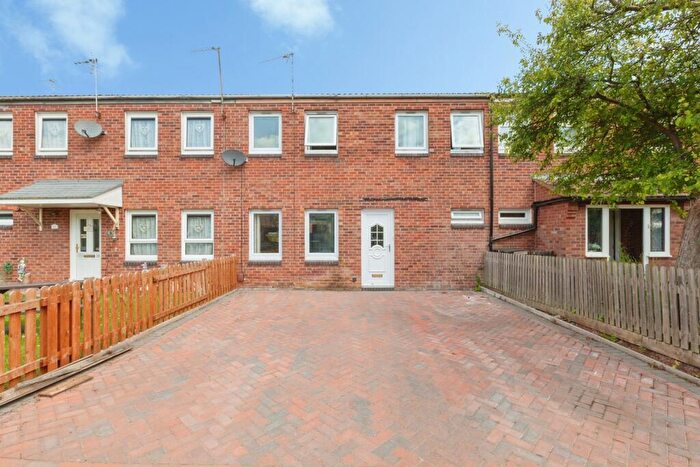
![]()
If you are looking to sell your house, let it out, or receive a property valuation, an expert can help you.
Click the button below to get started.


Neighbourhoods in Leicester
Navigate through our locations to find the location of your next house in Leicester, Leicestershire for sale or to rent.
- Anstey
- Barwell
- Billesdon
- Birstall Wanlip
- Birstall Watermead
- Blaby South
- Broughton Astley-astley
- Broughton Astley-broughton
- Broughton Astley-primethorpe
- Broughton Astley-sutton
- Cosby With South Whetstone
- Countesthorpe
- Croft Hill
- Dunton
- Earl Shilton
- East Goscote
- Ellis
- Enderby And St Johns
- Fairestone
- Fleckney
- Forest
- Forest Bradgate
- Gaddesby
- Glen
- Groby
- Hinckley De Montfort
- Kibworth
- Lubenham
- Millfield
- Mountsorrel
- Muxloe
- Narborough And Littlethorpe
- Newbold Verdon With Desford And Peckleton
- Normanton
- North Whetstone
- Oadby Brocks Hill
- Oadby Grange
- Oadby St Peters
- Oadby Uplands
- Oadby Woodlands
- Pastures
- Peatling
- Queniborough
- Ratby, Bagworth And Thornton
- Ravenhurst And Fosse
- Rothley And Thurcaston
- Saxondale
- Stanton And Flamville
- Syston East
- Syston West
- Thurmaston
- Thurnby And Houghton
- Tilton
- Wigston St Wolstans
- Winstanley
- Wreake Villages
- Braunstone Park & Rowley Fields
- Western
- Troon
- Billesdon & Tilton
- Thurnby & Houghton
- Kibworths
- Broughton Astley-Primethorpe & Sutton
- Broughton Astley South & Leire
- Market Harborough-Great Bowden & Arden
- Castle
- Stoneygate
- Knighton
- Eyres Monsell
- Aylestone
- Abbey
- Rushey Mead
- Belgrave
- Thurncourt
- Beaumont Leys
- Thorpe Astley & St Mary's
- Leicester Forest & Lubbesthorpe
- Saffron
- Glen Parva
- Westcotes
- Evington
- Spinney Hills
- Syston
- Fosse Stoney Cove
- Fosse Normanton
- Enderby
- Fosse
- Glenfield Ellis
- Birstall West
- Humberstone & Hamilton
- North Evington
- South Charnwood
- Wreake Valley
- Rothley Brook
- Blaby
- Cosby & South Whetstone
- Kirby Muxloe
- Fosse Highcross
Property price trends in Leicester
According to the latest Land Registry data, the average home in Leicester sold for £299,973 in 2026. That figure comes from a substantial record of 143,117 sales logged over the past 31 years.
Prices have softened over the last three years. Compared with 2023, when the typical sale came in around £307,418, that's a fall of roughly 2.4%.
Looking back five years, average prices are up about 2.5% since 2021, a gain of around £7,227 in cash terms.
Zoom out to the past decade for the fuller picture. Back in 2016, homes here averaged £224,163, so the typical sold price has climbed about 33.8% since then, roughly 3% a year. Stretch the view to fifteen years and that annual pace holds at about 3%.
Frequently asked questions about Leicester
What is the average price for a property for sale in Leicester?
The average price for a property for sale in Leicester is £313,600. This amount is 3% higher than the average price in Leicestershire. There are more than 10,000 property listings for sale in Leicester.
What locations have the most expensive properties for sale in Leicester?
The locations with the most expensive properties for sale in Leicester are Forest Bradgate at an average of £1,079,761, Hinckley De Montfort at an average of £795,000 and Mountsorrel at an average of £731,666.
What locations have the most affordable properties for sale in Leicester?
The locations with the most affordable properties for sale in Leicester are Braunstone Park & Rowley Fields at an average of £140,500, Castle at an average of £167,220 and Western at an average of £197,875.
Which train stations are available in or near Leicester?
Some of the train stations available in or near Leicester are Leicester, South Wigston and Narborough.
Property Price Paid in Leicester by Year
The average sold property price by year was:
| Year | Average Sold Price | Price Change |
Sold Properties
|
|---|---|---|---|
| 2026 | £299,973 | -7% |
293 Properties |
| 2025 | £322,274 | 3% |
3,739 Properties |
| 2024 | £311,633 | 1% |
3,792 Properties |
| 2023 | £307,418 | -1% |
3,394 Properties |
| 2022 | £310,036 | 6% |
4,213 Properties |
| 2021 | £292,746 | 7% |
5,559 Properties |
| 2020 | £272,065 | 5% |
4,433 Properties |
| 2019 | £257,504 | 3% |
5,155 Properties |
| 2018 | £248,906 | 4% |
5,343 Properties |
| 2017 | £239,640 | 6% |
5,378 Properties |
Property Price per Property Type in Leicester
Here you can find historic sold price data in order to help with your property search.
The average Property Paid Price for specific property types in the last three years are:
| Property Type | Average Sold Price | Sold Properties |
|---|---|---|
| Semi Detached House | £272,414.00 | 4,529 Semi Detached Houses |
| Terraced House | £227,027.00 | 1,979 Terraced Houses |
| Detached House | £430,404.00 | 4,027 Detached Houses |
| Flat | £148,867.00 | 683 Flats |
Transport in Leicester
Please see below transportation links in this area:
