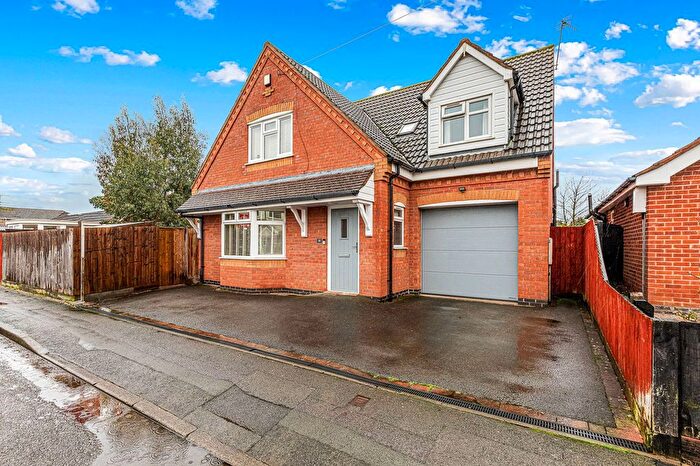
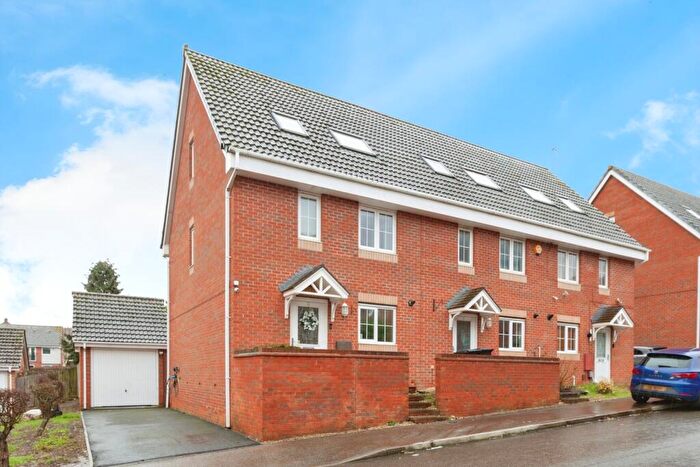
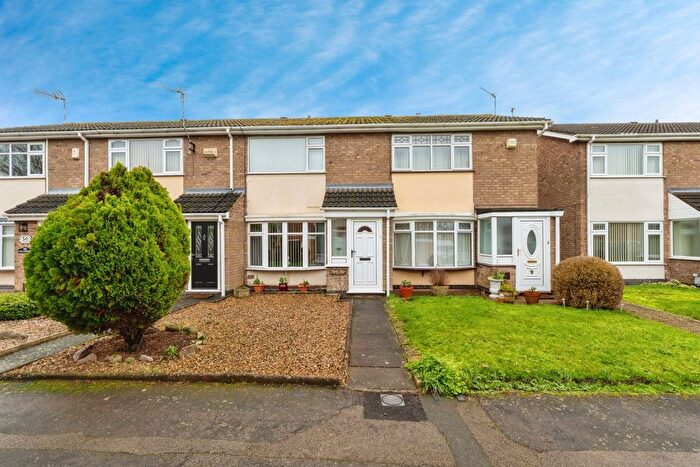
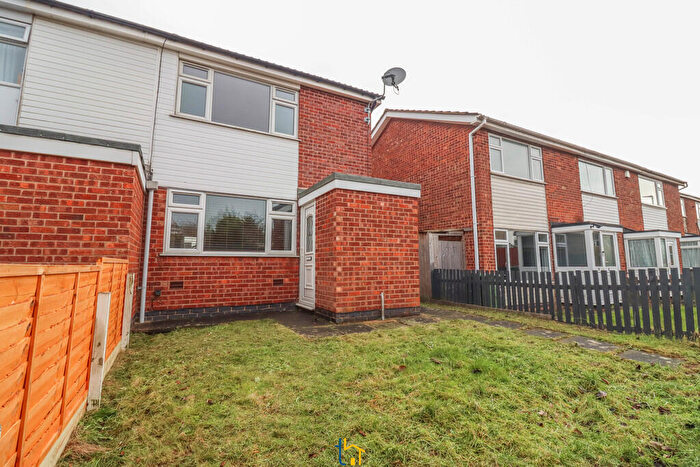
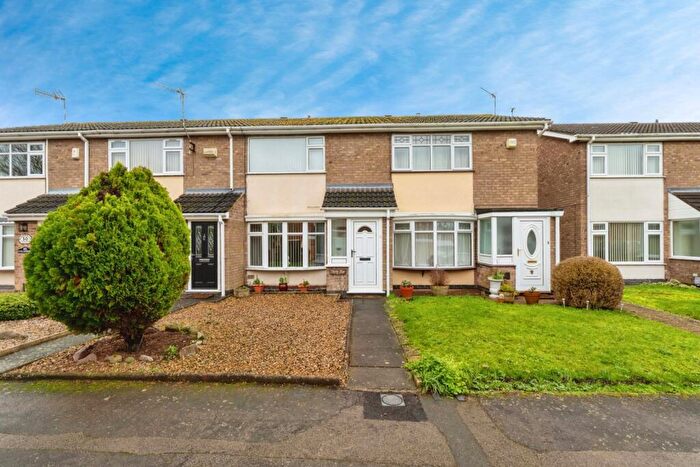
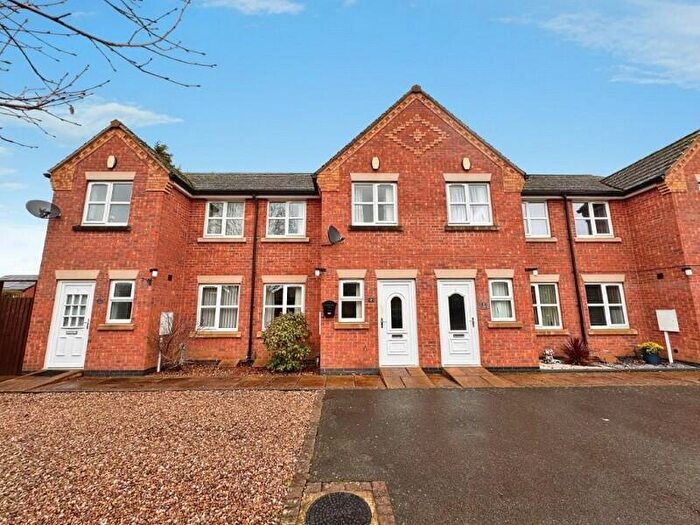
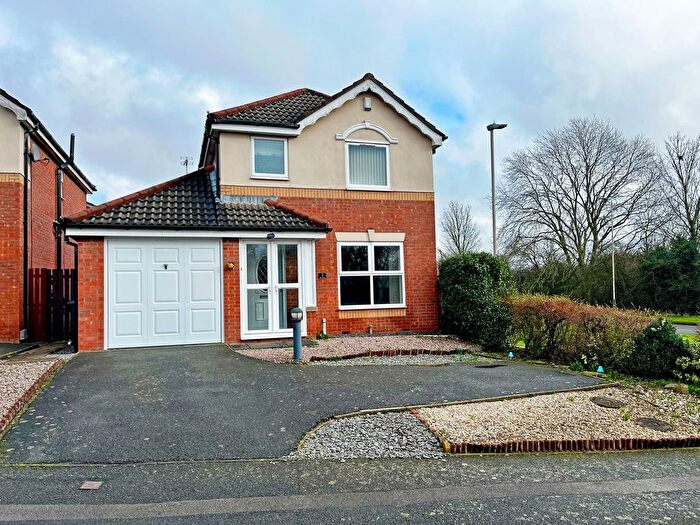
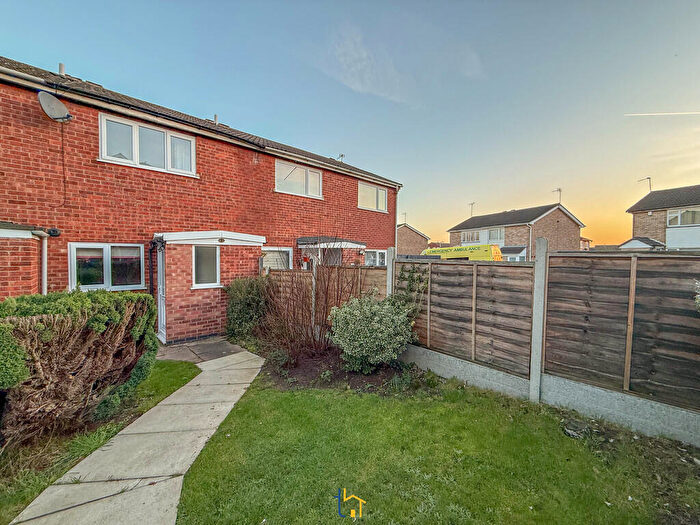
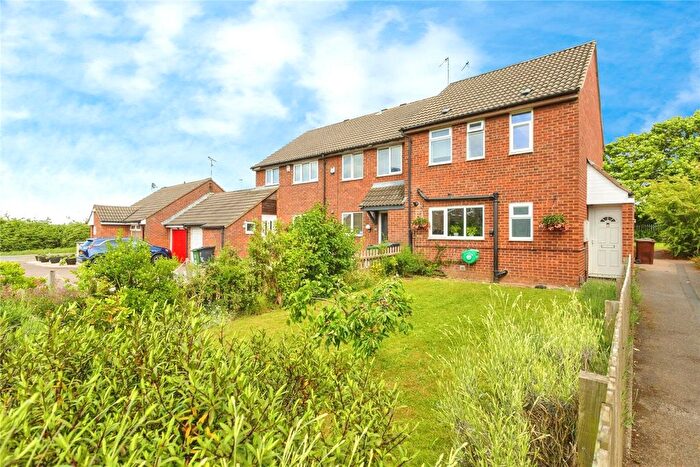
Houses for sale & to rent in Queniborough, Leicester
House Prices in Queniborough
Properties in Queniborough have an average house price of £357,659.00 and had 174 Property Transactions within the last 3 years¹.
Queniborough is an area in Leicester, Leicestershire with 1,300 households², where the most expensive property was sold for £1,160,000.00.
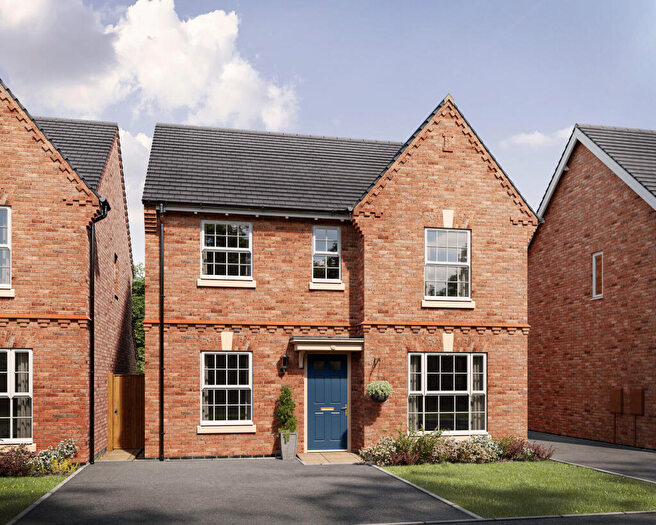
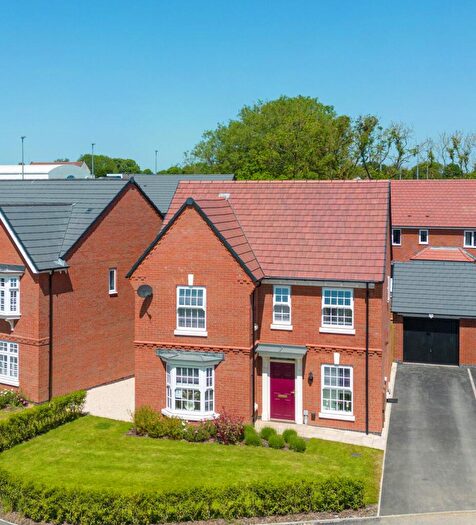
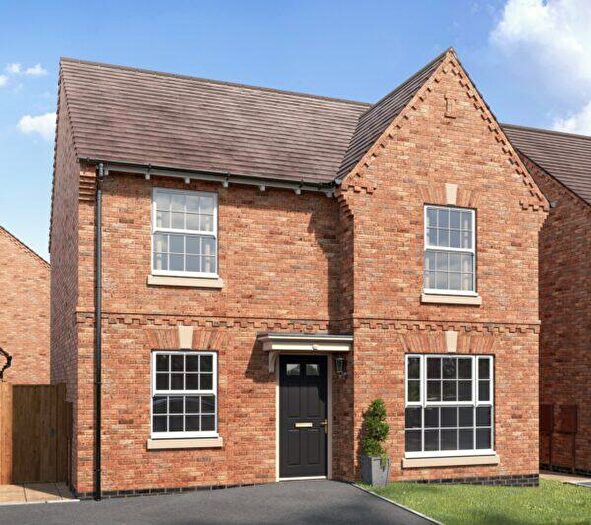
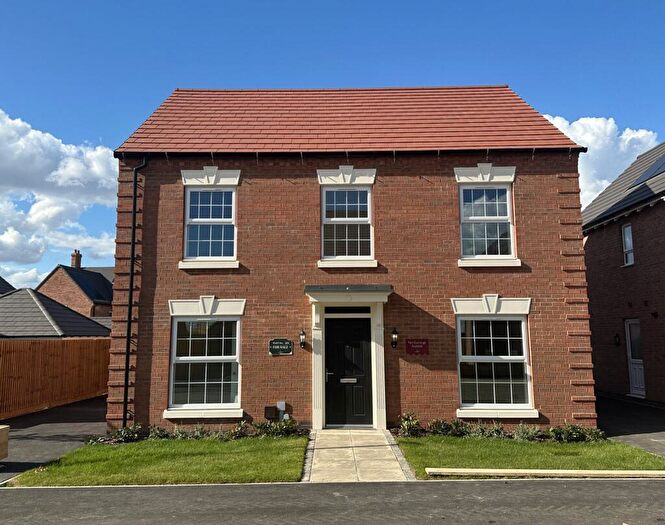
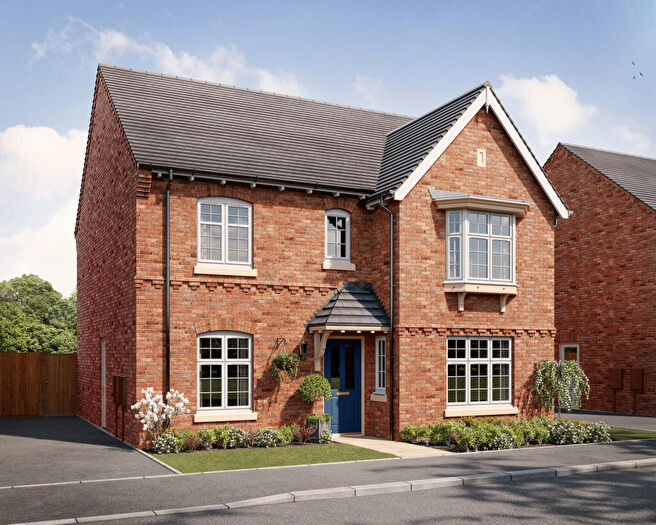
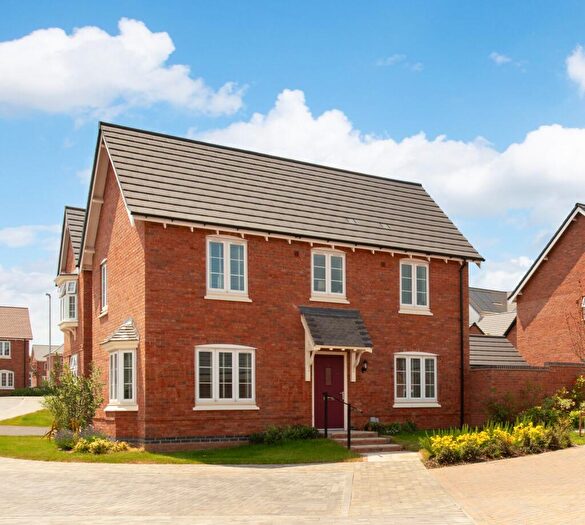
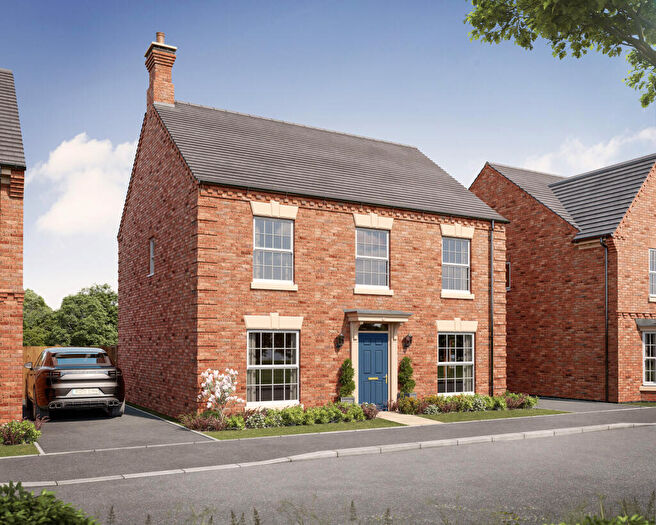
Properties for sale in Queniborough
Roads and Postcodes in Queniborough
Navigate through our locations to find the location of your next house in Queniborough, Leicester for sale or to rent.
| Streets | Postcodes |
|---|---|
| Alfred Belshaw Road | LE7 2DU LE7 2FR |
| Avenue Close | LE7 3DS |
| Avenue Road | LE7 3FA LE7 3FB |
| Barkby Holt Lane | LE7 3QA LE7 3BR |
| Barkby Lane | LE7 2BB |
| Barkby Road | LE7 3BQ LE7 3FD LE7 3FE |
| Barsby Road | LE7 3AA |
| Beeby Road | LE7 3QB LE7 3BP LE7 3RD |
| Beechwood Avenue | LE7 3DU |
| Bluebell Close | LE7 3UY |
| Boonton Meadows Way | LE7 3GB |
| Brookside | LE7 3QD |
| Campion Avenue | LE7 3GD |
| Chapel Close | LE7 3AE |
| Chestnut Close | LE7 3DW |
| Coppice Lane | LE7 3DR |
| Cornfield Close | LE7 2FG |
| Croxton Road | LE7 3BH |
| Curzon Close | LE7 3TY |
| Daisy Close | LE7 3AD |
| Dobney Avenue | LE7 3FF |
| Drovers Road | LE7 2FS |
| Ervin Way | LE7 3TT |
| Frederick Close | LE7 3TW |
| Gascoigne Avenue | LE7 3FG |
| Glebe Road | LE7 3FH |
| Green Hedge Lane | LE7 3AF |
| Hall Farm Close | LE7 3TZ |
| Hamilton Lane | LE7 3RA LE7 9SF |
| Harebell Close | LE7 3GE |
| Home Close | LE7 3RQ |
| Hungarton Lane | LE7 3BJ |
| Jellis Close | LE7 2FH |
| King Street | LE7 3QE LE7 3QF |
| Kings Lane | LE7 3RE |
| Laurel Bank Close | LE7 3FZ |
| Link Road | LE7 3FJ |
| Maclaren Todd Close | LE7 2FL |
| Main Street | LE7 3BL LE7 3DA LE7 3DB LE7 3QG LE7 3RJ LE7 3RL |
| Manor Farm Mews | LE7 3EA |
| Marsden Avenue | LE7 3FL |
| Melton Road | LE7 3FN LE7 3FP |
| Mere Lane | LE7 3DE |
| Michael Close | LE7 3UL |
| Millstone Lane | LE7 2FN |
| New Street | LE7 3FS |
| New Zealand Lane | LE7 3FT LE7 3FU |
| Nursery Close | LE7 3DX |
| Park Lane | LE7 3AH |
| Peggs Lane | LE7 3DF |
| Pendleton Close | LE7 3AB |
| Porritt Way | LE7 2FP |
| Primrose Way | LE7 3UJ |
| Queen Street | LE7 3QH |
| Queniborough Hall Drive | LE7 3DZ |
| Queniborough Road | LE7 3DG LE7 3QJ |
| Rearsby Road | LE7 3DH |
| Ridgemere Lane | LE7 3RR |
| Rupert Crescent | LE7 3TU |
| School Lane | LE7 3QL LE7 3RT LE7 3DJ |
| Scraptoft Road | LE7 3BN |
| South Croxton Road | LE7 3RX LE7 3RU LE7 3RW |
| Spring Court | LE7 3AG |
| Syston Road | LE7 3FX LE7 3RS |
| Teasel Close | LE7 3GF |
| The Banks | LE7 3DQ |
| The Dovecotes | LE7 3WP |
| The Ridings | LE7 3DT |
| The Ringway | LE7 3DL LE7 3DN LE7 3DP |
| Three Turns Lane | LE7 3RB |
| Twyford Road | LE7 3RZ |
| Vicarage Lane | LE7 3QN |
| Wallace Healey Close | LE7 2FQ |
| Watchcrete Avenue | LE7 3FY |
| Wetherby Close | LE7 3FR |
| William Close | LE7 3TX |
| Willowbrook Close | LE7 3FW |
| LE7 3RN |
Transport near Queniborough
-
Syston Station
-
Sileby Station
-
Barrow-Upon-Soar Station
-
Leicester Station
-
Melton Mowbray Station
-
Loughborough Station
-
South Wigston Station
- FAQ
- Price Paid By Year
- Property Type Price
Frequently asked questions about Queniborough
What is the average price for a property for sale in Queniborough?
The average price for a property for sale in Queniborough is £357,659. This amount is 15% higher than the average price in Leicester. There are 4,731 property listings for sale in Queniborough.
What streets have the most expensive properties for sale in Queniborough?
The streets with the most expensive properties for sale in Queniborough are Croxton Road at an average of £1,160,000, Hall Farm Close at an average of £745,000 and Harebell Close at an average of £625,000.
What streets have the most affordable properties for sale in Queniborough?
The streets with the most affordable properties for sale in Queniborough are Hungarton Lane at an average of £135,000, Barkby Lane at an average of £136,083 and Spring Court at an average of £202,333.
Which train stations are available in or near Queniborough?
Some of the train stations available in or near Queniborough are Syston, Sileby and Barrow-Upon-Soar.
Property Price Paid in Queniborough by Year
The average sold property price by year was:
| Year | Average Sold Price | Price Change |
Sold Properties
|
|---|---|---|---|
| 2025 | £363,347 | 0,1% |
57 Properties |
| 2024 | £362,926 | 4% |
56 Properties |
| 2023 | £347,508 | 6% |
61 Properties |
| 2022 | £328,038 | -5% |
59 Properties |
| 2021 | £345,913 | 1% |
66 Properties |
| 2020 | £343,070 | 7% |
59 Properties |
| 2019 | £318,801 | 6% |
103 Properties |
| 2018 | £299,287 | -5% |
99 Properties |
| 2017 | £313,262 | 17% |
136 Properties |
| 2016 | £259,347 | 5% |
110 Properties |
| 2015 | £247,153 | -5% |
48 Properties |
| 2014 | £260,224 | 12% |
59 Properties |
| 2013 | £228,348 | -14% |
33 Properties |
| 2012 | £259,270 | 8% |
32 Properties |
| 2011 | £237,484 | 20% |
46 Properties |
| 2010 | £189,051 | -1% |
41 Properties |
| 2009 | £191,693 | -41% |
41 Properties |
| 2008 | £269,500 | 4% |
27 Properties |
| 2007 | £258,876 | 9% |
47 Properties |
| 2006 | £236,077 | -7% |
71 Properties |
| 2005 | £253,737 | 10% |
39 Properties |
| 2004 | £227,169 | 4% |
53 Properties |
| 2003 | £218,899 | 15% |
58 Properties |
| 2002 | £186,398 | 20% |
52 Properties |
| 2001 | £148,231 | 19% |
45 Properties |
| 2000 | £120,434 | 22% |
50 Properties |
| 1999 | £93,725 | 10% |
58 Properties |
| 1998 | £84,170 | -12% |
43 Properties |
| 1997 | £94,043 | 13% |
45 Properties |
| 1996 | £82,048 | 17% |
33 Properties |
| 1995 | £68,415 | - |
56 Properties |
Property Price per Property Type in Queniborough
Here you can find historic sold price data in order to help with your property search.
The average Property Paid Price for specific property types in the last three years are:
| Property Type | Average Sold Price | Sold Properties |
|---|---|---|
| Semi Detached House | £303,102.00 | 44 Semi Detached Houses |
| Detached House | £418,712.00 | 100 Detached Houses |
| Terraced House | £266,431.00 | 22 Terraced Houses |
| Flat | £145,431.00 | 8 Flats |

