
Houses for sale & to rent in Forest Bradgate, Loughborough
House Prices in Forest Bradgate
Properties in Forest Bradgate have an average house price of £481k and had 68 Property Transactions within the last 3 years¹.
Forest Bradgate is an area in Loughborough, Leicestershire with 912 households², where the most expensive property was sold for £2.96M.
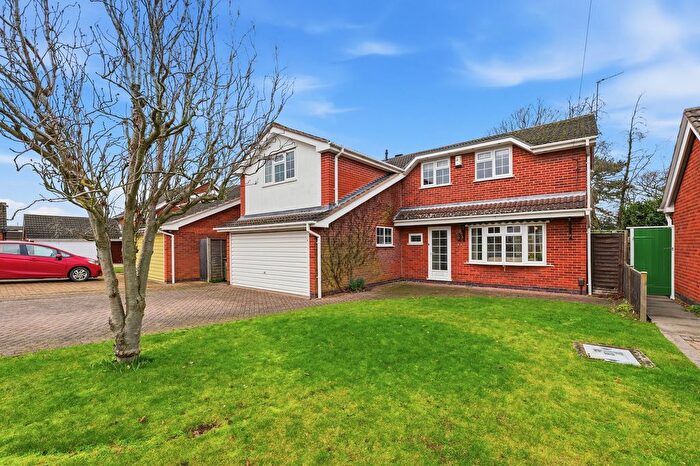
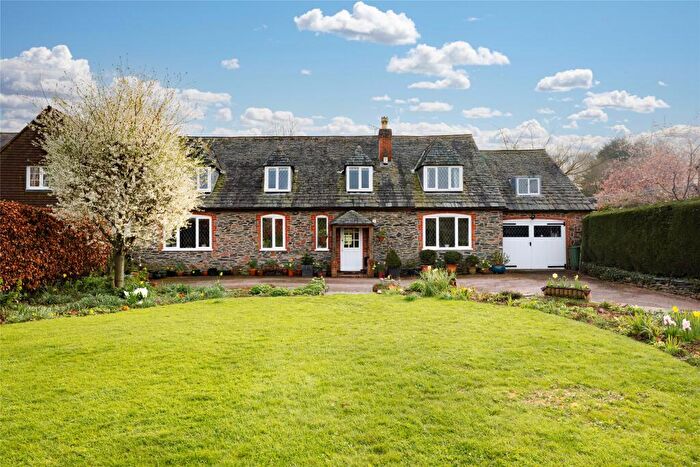
Properties for sale in Forest Bradgate
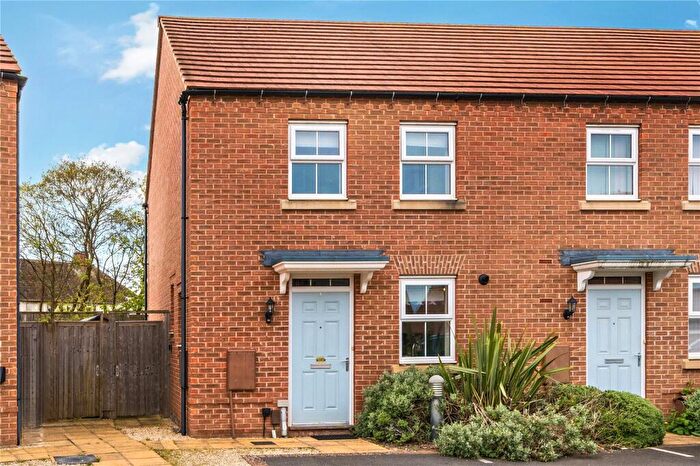
![]()
If you are looking to sell your house, let it out, or receive a property valuation, an expert can help you.
Click the button below to get started.

Roads and Postcodes in Forest Bradgate
Navigate through our locations to find the location of your next house in Forest Bradgate, Loughborough for sale or to rent.
| Streets | Postcodes |
|---|---|
| Beacon Road | LE12 8RN LE12 8RW LE12 8SP LE12 8SR LE12 8XA |
| Beaumanor Drive | LE12 8TX |
| Beaumanor Gardens | LE12 8UR |
| Birdhill Road | LE12 8RP LE12 8RR |
| Brand Hill | LE12 8SS LE12 8ST LE12 8SU LE12 8SX |
| Brand Lane | LE12 8TY |
| Breakback Road | LE12 8TA |
| Briscoe Lane | LE12 8UF |
| Brook Road | LE12 8RS |
| Charley Road | LE12 8TB LE12 8SY |
| Charnwood Rise | LE12 8QT |
| Church Hill | LE12 8RT |
| Deans Lane | LE12 8TE |
| Fenny Copse Lane | LE12 8WB |
| Forest Road | LE12 8RU LE12 8TZ LE12 8UA LE12 8WD |
| Forest Rock Close | LE12 8SA LE12 8SZ |
| Garats Hay | LE12 8UZ |
| Hastings Road | LE12 8QU |
| Herrick Road | LE12 8RX |
| Hill Rise | LE12 8QX |
| Homefarm Close | LE12 8UD |
| Joe Moores Lane | LE12 8TF |
| Lady Martin Drive | LE12 8WX |
| Main Street | LE12 8RY LE12 8RZ |
| Maplewell Road | LE12 8QY LE12 8QZ LE12 8RA LE12 8RG |
| Maytree Lane | LE12 8UQ |
| Mill Road | LE12 8RD |
| Nanhill Drive | LE12 8TL |
| Paterson Drive | LE12 8RL |
| Perry Close | LE12 8SB |
| Rawlins Close | LE12 8SD |
| Roecliffe Road | LE12 8TN |
| Rushey Lane | LE12 8UW |
| School Lane | LE12 8UJ |
| Shepshed Road | LE12 8TW |
| Swithland | LE12 8ZY |
| Swithland Road | LE12 8JL |
| The Drive | LE12 8RE |
| Tuckett Road | LE12 8SE |
| Vicary Lane | LE12 8UL LE12 8UN |
| Victoria Road | LE12 8RF |
| Waterloo Spinney Lane | LE12 8UP |
| Windmill Rise | LE12 8SF LE12 8SG |
| LE12 8YX LE12 8ZP LE12 8ZQ LE12 8FU LE12 8XR |
Transport near Forest Bradgate

- FAQ
- Price Paid By Year
- Property Type Price
Frequently asked questions about Forest Bradgate
What is the average price for a property for sale in Forest Bradgate?
The average price for a property for sale in Forest Bradgate is £481,350. This amount is 70% higher than the average price in Loughborough. There are 1,559 property listings for sale in Forest Bradgate.
What streets have the most expensive properties for sale in Forest Bradgate?
The streets with the most expensive properties for sale in Forest Bradgate are Forest Rock Close at an average of £750,000, Roecliffe Road at an average of £700,250 and Rawlins Close at an average of £649,975.
What streets have the most affordable properties for sale in Forest Bradgate?
The streets with the most affordable properties for sale in Forest Bradgate are Garats Hay at an average of £220,000, Maytree Lane at an average of £290,000 and Birdhill Road at an average of £302,283.
Which train stations are available in or near Forest Bradgate?
Some of the train stations available in or near Forest Bradgate are Barrow-Upon-Soar, Loughborough and Sileby.
Property Price Paid in Forest Bradgate by Year
The average sold property price by year was:
| Year | Average Sold Price | Price Change |
Sold Properties
|
|---|---|---|---|
| 2025 | £576,411 | 28% |
24 Properties |
| 2024 | £415,295 | -7% |
23 Properties |
| 2023 | £445,054 | -42% |
21 Properties |
| 2022 | £632,572 | 17% |
35 Properties |
| 2021 | £526,698 | 12% |
46 Properties |
| 2020 | £466,008 | 9% |
38 Properties |
| 2019 | £423,236 | 9% |
40 Properties |
| 2018 | £383,636 | -21% |
34 Properties |
| 2017 | £463,294 | -22% |
39 Properties |
| 2016 | £563,510 | 32% |
37 Properties |
| 2015 | £385,464 | 15% |
42 Properties |
| 2014 | £326,711 | -11% |
47 Properties |
| 2013 | £364,037 | 31% |
32 Properties |
| 2012 | £251,823 | -36% |
29 Properties |
| 2011 | £343,385 | 15% |
30 Properties |
| 2010 | £290,387 | -6% |
28 Properties |
| 2009 | £308,924 | -11% |
20 Properties |
| 2008 | £341,783 | -16% |
21 Properties |
| 2007 | £397,590 | 16% |
43 Properties |
| 2006 | £335,358 | 16% |
42 Properties |
| 2005 | £282,916 | 2% |
37 Properties |
| 2004 | £275,919 | 7% |
49 Properties |
| 2003 | £255,721 | 33% |
33 Properties |
| 2002 | £170,562 | 4% |
40 Properties |
| 2001 | £164,158 | 5% |
34 Properties |
| 2000 | £155,653 | 22% |
27 Properties |
| 1999 | £120,768 | -14% |
33 Properties |
| 1998 | £138,025 | 14% |
37 Properties |
| 1997 | £118,968 | 19% |
52 Properties |
| 1996 | £96,714 | -25% |
35 Properties |
| 1995 | £120,618 | - |
36 Properties |
Property Price per Property Type in Forest Bradgate
Here you can find historic sold price data in order to help with your property search.
The average Property Paid Price for specific property types in the last three years are:
| Property Type | Average Sold Price | Sold Properties |
|---|---|---|
| Semi Detached House | £426,928.00 | 21 Semi Detached Houses |
| Detached House | £698,684.00 | 21 Detached Houses |
| Terraced House | £352,258.00 | 25 Terraced Houses |
| Flat | £287,500.00 | 1 Flat |