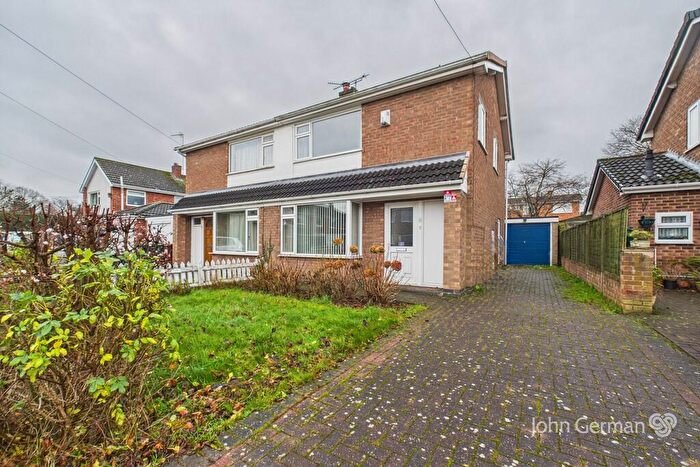
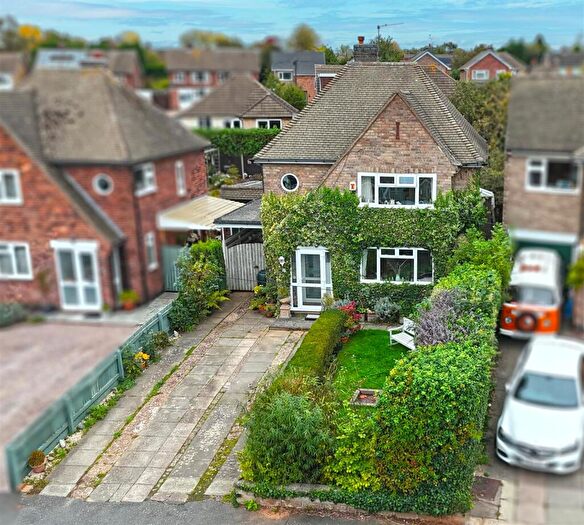
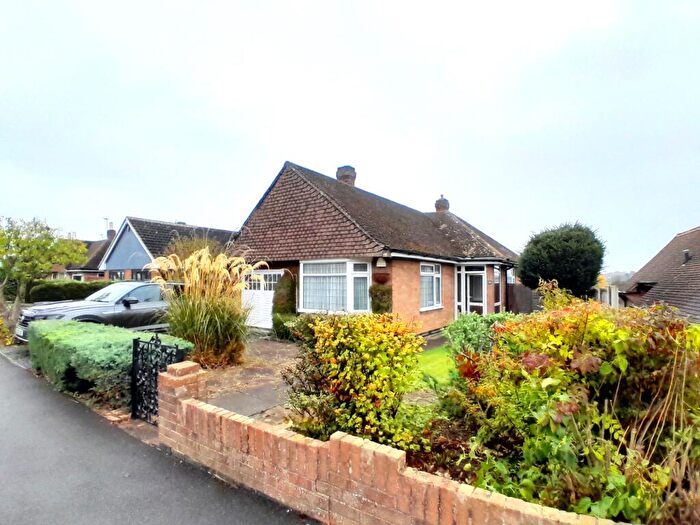
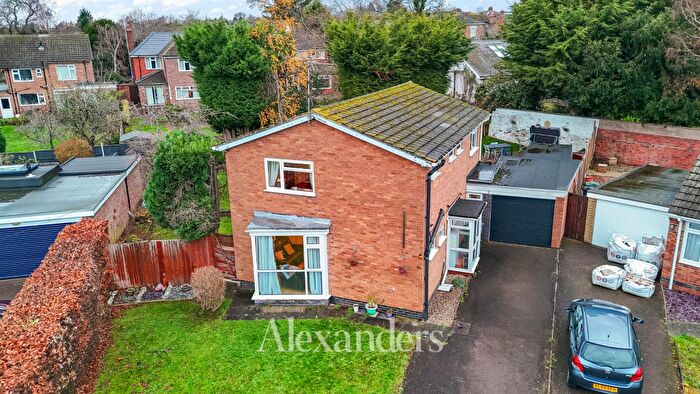
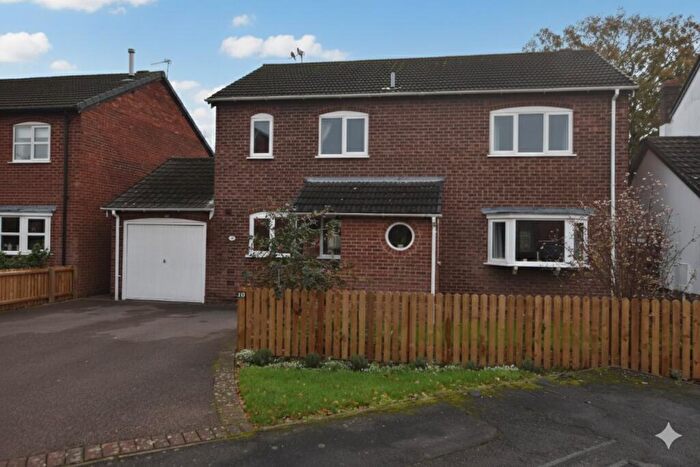
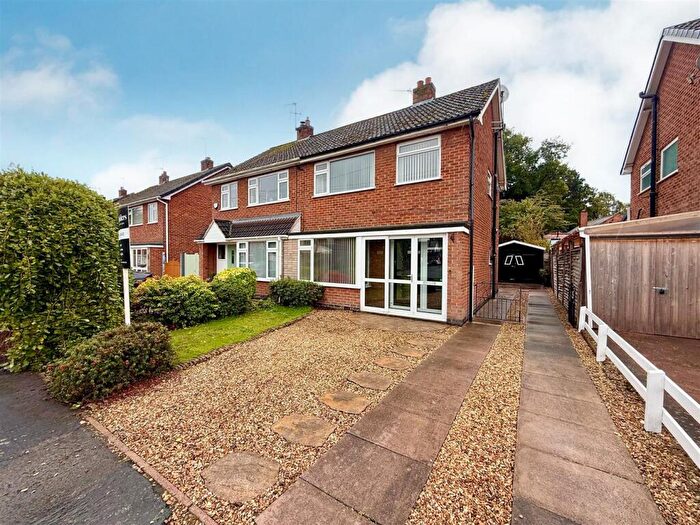
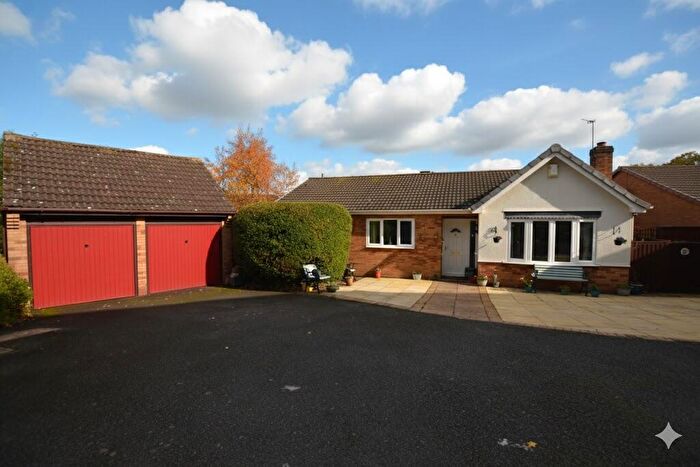
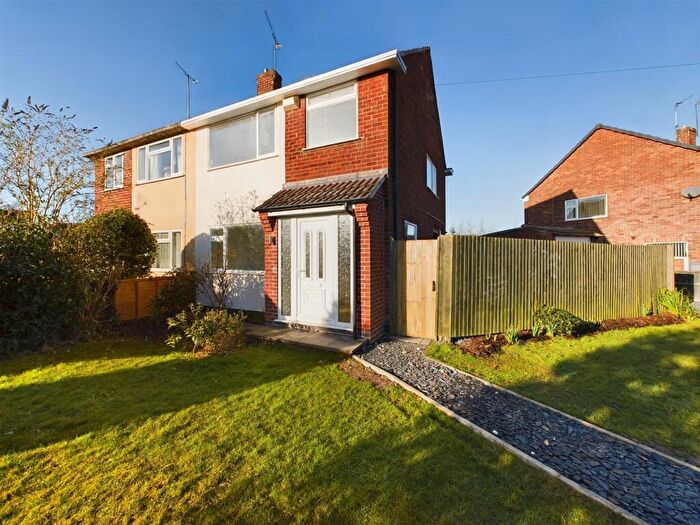
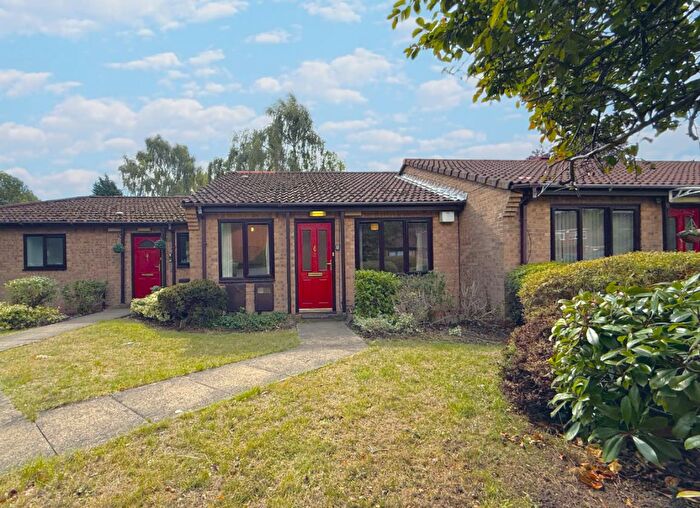
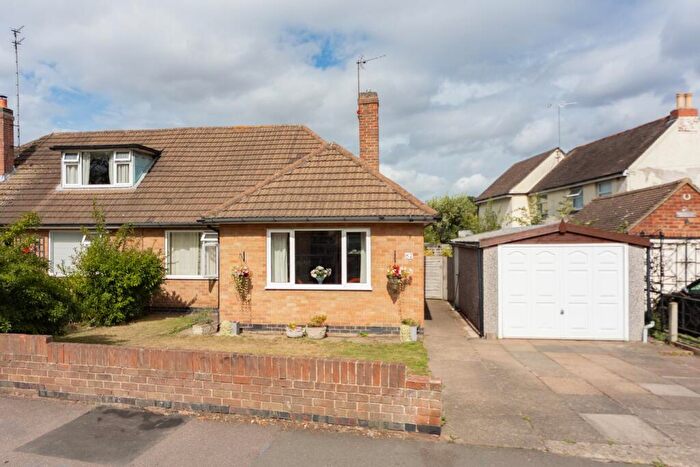
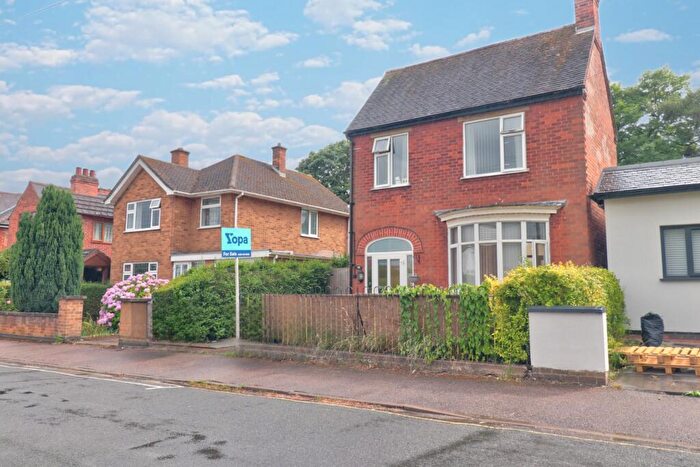
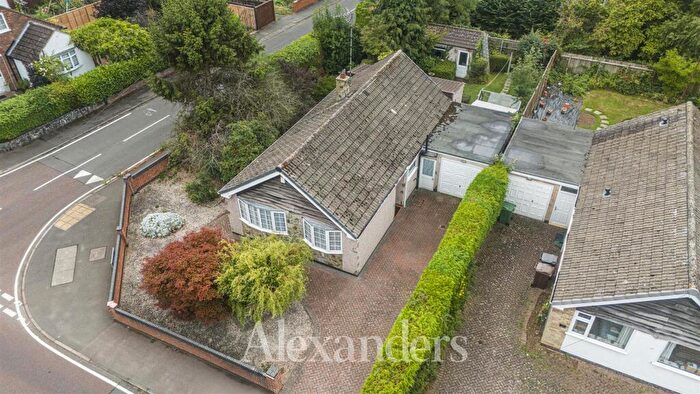
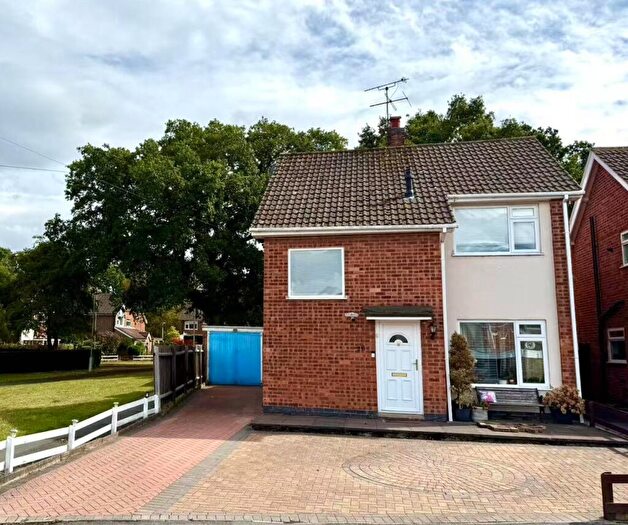
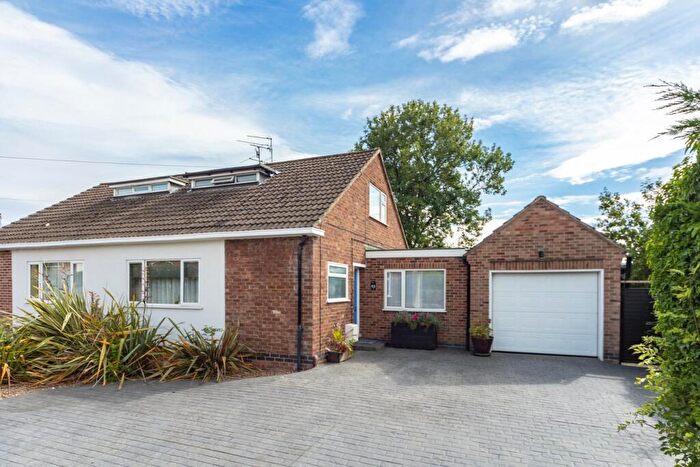
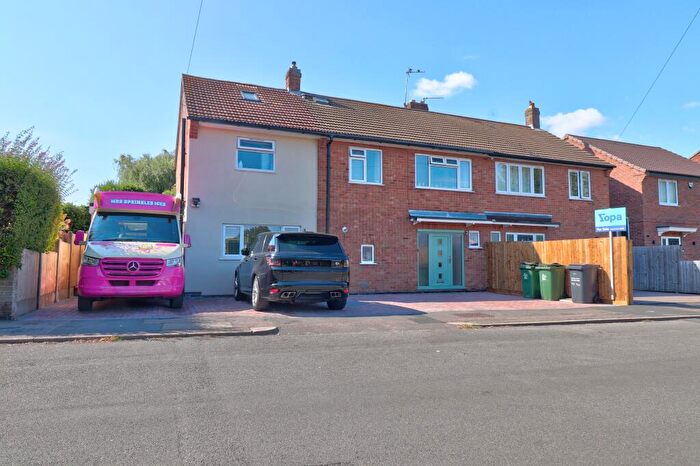
Houses for sale & to rent in Loughborough Nanpantan, Loughborough
House Prices in Loughborough Nanpantan
Properties in Loughborough Nanpantan have an average house price of £376,490.00 and had 166 Property Transactions within the last 3 years¹.
Loughborough Nanpantan is an area in Loughborough, Leicestershire with 1,571 households², where the most expensive property was sold for £1,700,000.00.
Properties for sale in Loughborough Nanpantan
Roads and Postcodes in Loughborough Nanpantan
Navigate through our locations to find the location of your next house in Loughborough Nanpantan, Loughborough for sale or to rent.
| Streets | Postcodes |
|---|---|
| Ambleside Close | LE11 3SH |
| Ashby Road | LE11 3AQ LE11 3GB LE11 3GR LE11 3QU LE11 3TS |
| Ashleigh Drive | LE11 3HN LE11 3HW |
| Avocet Close | LE11 3BF |
| Benscliffe Drive | LE11 3JP |
| Berkeley Road | LE11 3SJ |
| Borrowdale Way | LE11 3RG |
| Charley Drive | LE11 3HR |
| Chichester Close | LE11 3SL |
| Compton Close | LE11 3SF |
| Coniston Crescent | LE11 3RH LE11 3RQ |
| Derwent Drive | LE11 3RJ |
| Dulverton Close | LE11 3SN |
| Exmoor Close | LE11 3SW |
| Fairmount Drive | LE11 3JR |
| Foden Close | LE11 3YJ |
| Forest Road | LE11 3HS LE11 3HT |
| Frederick Street | LE11 3TL |
| Guildford Way | LE11 3SE |
| Highfields Drive | LE11 3JS LE11 3JT |
| Holywell Drive | LE11 3JU LE11 3JX LE11 3JY LE11 3JZ |
| Holywell Way | LE11 3UZ |
| Keswick Avenue | LE11 3RL |
| Kirkstone Drive | LE11 3RN LE11 3RW |
| Langdale Avenue | LE11 3RP |
| Leconfield Road | LE11 3SP LE11 3SQ |
| Longcliffe Gardens | LE11 3YQ |
| Loughborough Technology Park | LE11 3NG |
| Loweswater Drive | LE11 3RR LE11 3RS |
| Ludlow Close | LE11 3TB |
| Mardale Way | LE11 3SR LE11 3SS |
| Martindale Close | LE11 3RF |
| Montague Drive | LE11 3SB |
| Mountfields Drive | LE11 3JD LE11 3JE |
| Nanpantan Road | LE11 3ST LE11 3YB LE11 3YD |
| Nicolson Road | LE11 3SD |
| Oaklands Avenue | LE11 3JF |
| Oakwood Drive | LE11 3QF |
| Patterdale Drive | LE11 3RT |
| Ronald West Court | LE11 3RE |
| Rydal Avenue | LE11 3RU LE11 3RX |
| Shepherds Close | LE11 3LA |
| Snells Nook Lane | LE11 3YA |
| Spinney Hill Drive | LE11 3LB LE11 3LD |
| Thirlmere Drive | LE11 3SX LE11 3SY |
| Tynedale Road | LE11 3TA |
| Westmorland Avenue | LE11 3RY |
| Wythburn Close | LE11 3SZ |
| LE11 3TD LE11 3TG LE11 3TU LE11 3UE LE11 3UG |
Transport near Loughborough Nanpantan
-
Loughborough Station
-
Barrow-Upon-Soar Station
-
Sileby Station
-
East Midlands Parkway Station
-
Syston Station
-
Long Eaton Station
-
Leicester Station
- FAQ
- Price Paid By Year
- Property Type Price
Frequently asked questions about Loughborough Nanpantan
What is the average price for a property for sale in Loughborough Nanpantan?
The average price for a property for sale in Loughborough Nanpantan is £376,490. This amount is 33% higher than the average price in Loughborough. There are 544 property listings for sale in Loughborough Nanpantan.
What streets have the most expensive properties for sale in Loughborough Nanpantan?
The streets with the most expensive properties for sale in Loughborough Nanpantan are Shepherds Close at an average of £563,166, Nanpantan Road at an average of £540,576 and Holywell Drive at an average of £512,333.
What streets have the most affordable properties for sale in Loughborough Nanpantan?
The streets with the most affordable properties for sale in Loughborough Nanpantan are Keswick Avenue at an average of £230,000, Thirlmere Drive at an average of £231,125 and Patterdale Drive at an average of £236,000.
Which train stations are available in or near Loughborough Nanpantan?
Some of the train stations available in or near Loughborough Nanpantan are Loughborough, Barrow-Upon-Soar and Sileby.
Property Price Paid in Loughborough Nanpantan by Year
The average sold property price by year was:
| Year | Average Sold Price | Price Change |
Sold Properties
|
|---|---|---|---|
| 2025 | £363,829 | -8% |
26 Properties |
| 2024 | £391,899 | 7% |
50 Properties |
| 2023 | £365,923 | -3% |
48 Properties |
| 2022 | £378,058 | 16% |
42 Properties |
| 2021 | £316,520 | -3% |
68 Properties |
| 2020 | £326,277 | 8% |
47 Properties |
| 2019 | £300,811 | 6% |
46 Properties |
| 2018 | £281,271 | -5% |
56 Properties |
| 2017 | £293,982 | 14% |
59 Properties |
| 2016 | £252,338 | -10% |
43 Properties |
| 2015 | £278,227 | 16% |
55 Properties |
| 2014 | £232,801 | 3% |
63 Properties |
| 2013 | £225,457 | 15% |
90 Properties |
| 2012 | £192,703 | -9% |
51 Properties |
| 2011 | £209,779 | -0,4% |
50 Properties |
| 2010 | £210,568 | 14% |
42 Properties |
| 2009 | £182,091 | -10% |
38 Properties |
| 2008 | £201,089 | -16% |
32 Properties |
| 2007 | £233,116 | 15% |
68 Properties |
| 2006 | £198,652 | -3% |
87 Properties |
| 2005 | £204,526 | -2% |
54 Properties |
| 2004 | £208,050 | 12% |
52 Properties |
| 2003 | £183,646 | 20% |
62 Properties |
| 2002 | £147,255 | 22% |
67 Properties |
| 2001 | £115,475 | 9% |
68 Properties |
| 2000 | £105,087 | 18% |
63 Properties |
| 1999 | £85,909 | 10% |
89 Properties |
| 1998 | £77,213 | -5% |
62 Properties |
| 1997 | £80,811 | 8% |
59 Properties |
| 1996 | £74,293 | -4% |
74 Properties |
| 1995 | £77,595 | - |
51 Properties |
Property Price per Property Type in Loughborough Nanpantan
Here you can find historic sold price data in order to help with your property search.
The average Property Paid Price for specific property types in the last three years are:
| Property Type | Average Sold Price | Sold Properties |
|---|---|---|
| Semi Detached House | £274,012.00 | 63 Semi Detached Houses |
| Detached House | £441,221.00 | 102 Detached Houses |
| Terraced House | £230,000.00 | 1 Terraced House |

