
Houses for sale & to rent in Loughborough Southfields, Loughborough
House Prices in Loughborough Southfields
Properties in Loughborough Southfields have an average house price of £270k and had 222 Property Transactions within the last 3 years¹.
Loughborough Southfields is an area in Loughborough, Leicestershire with 2,543 households², where the most expensive property was sold for £795k.
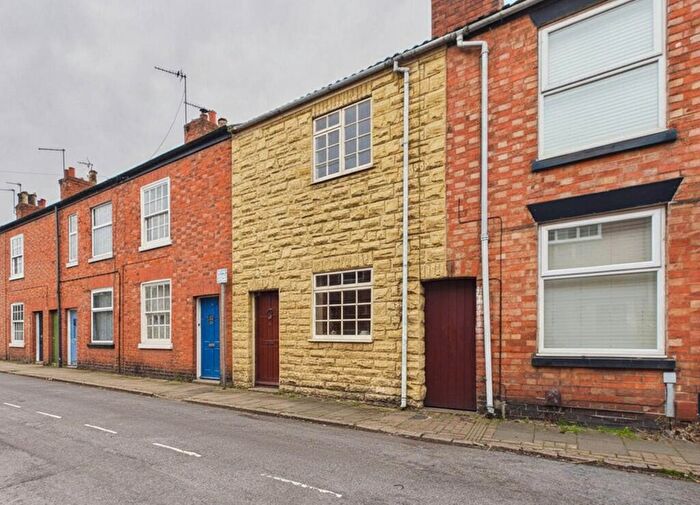
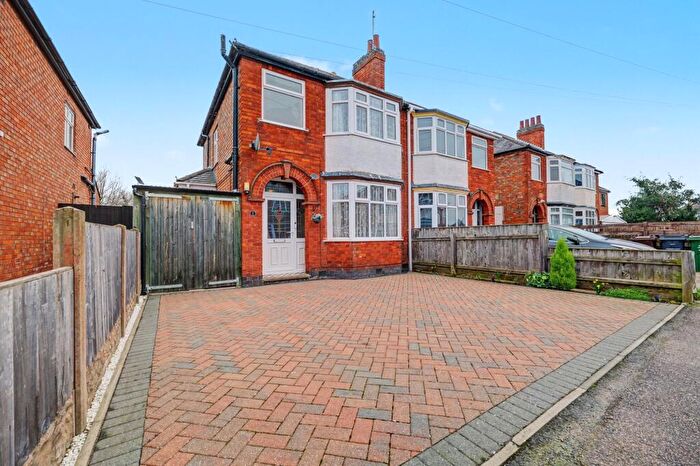
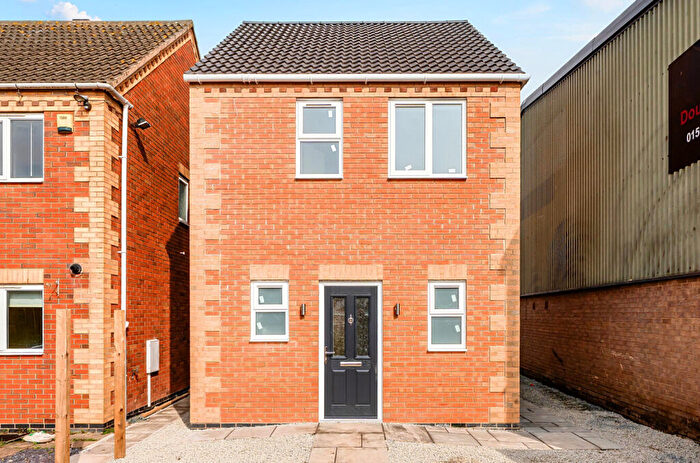
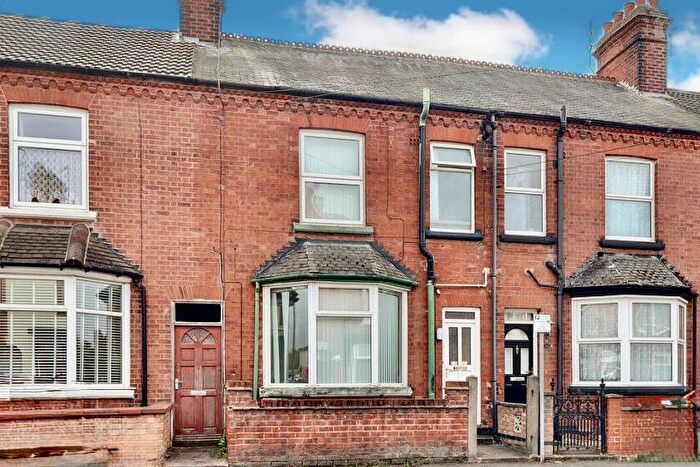
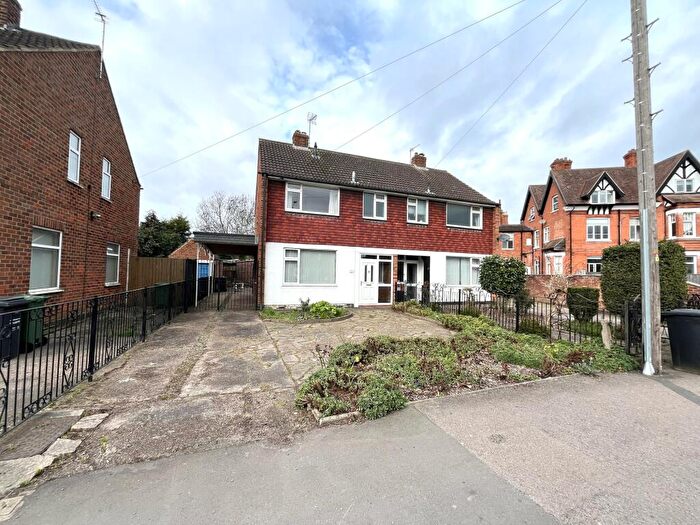
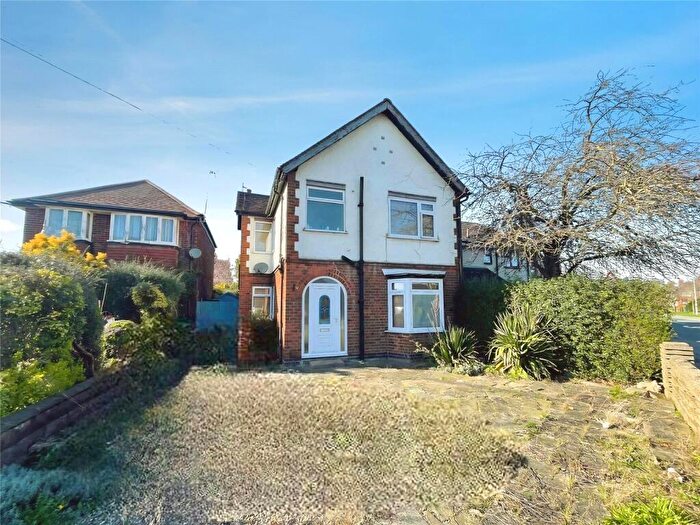
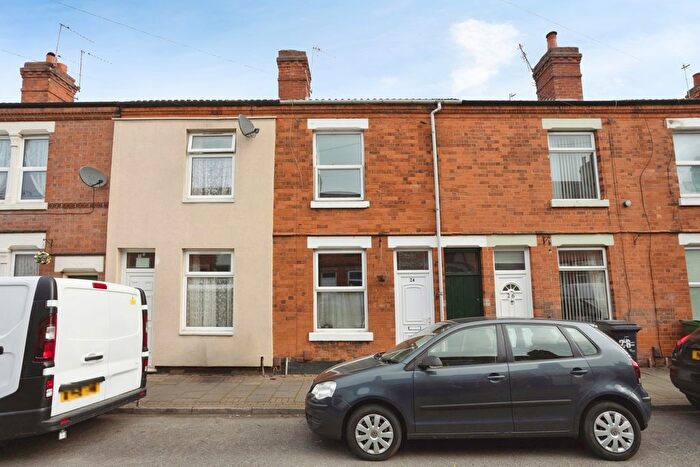
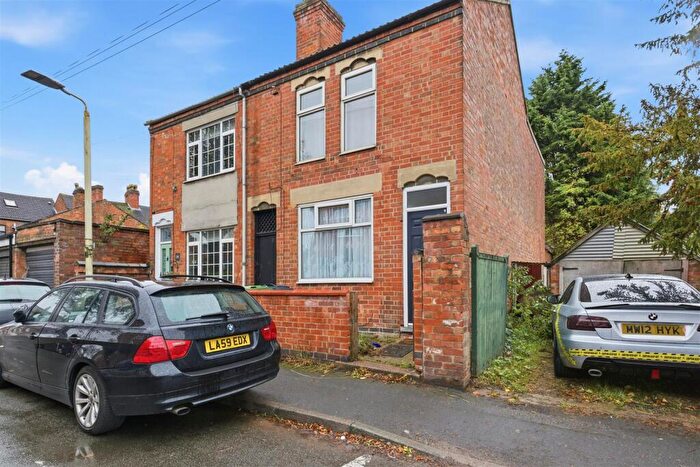
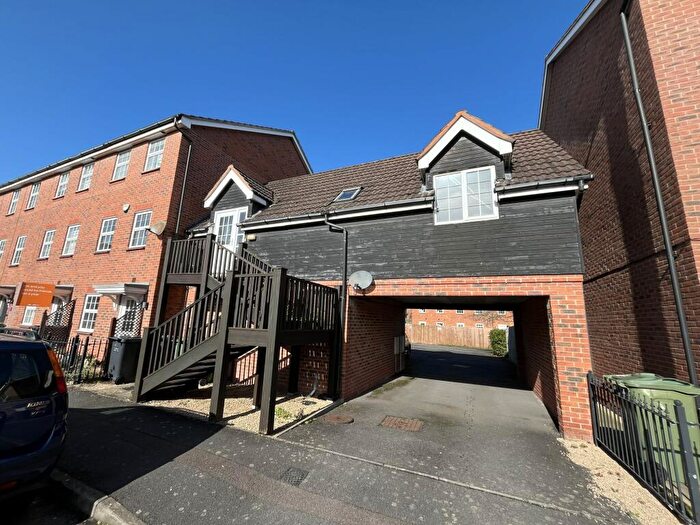
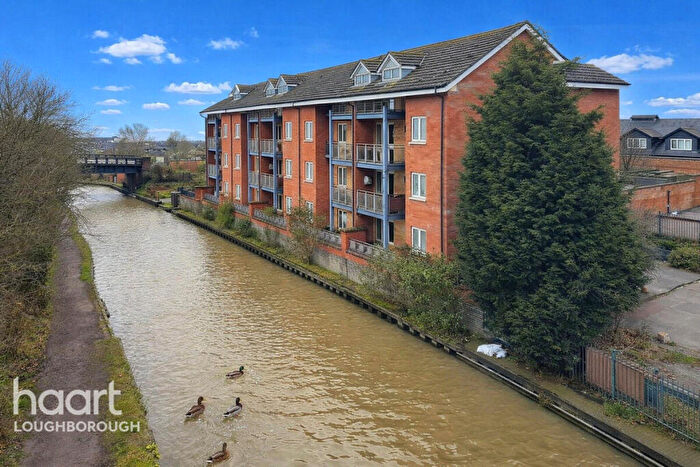
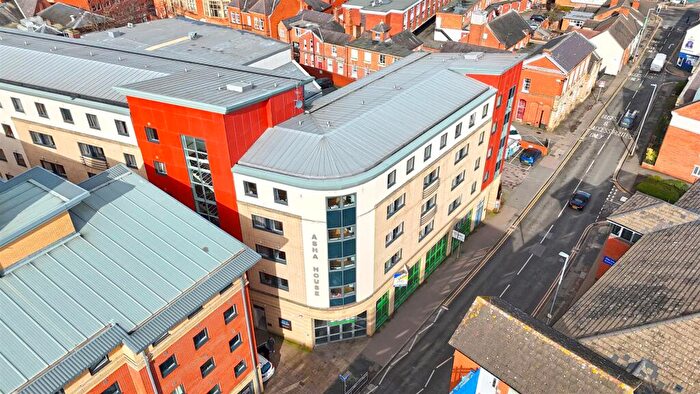
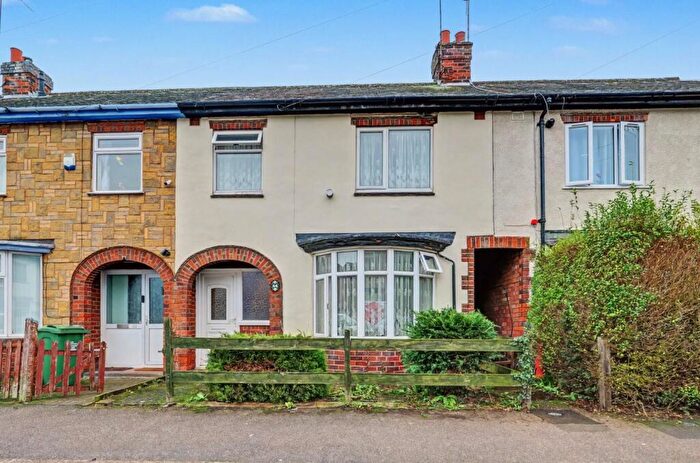
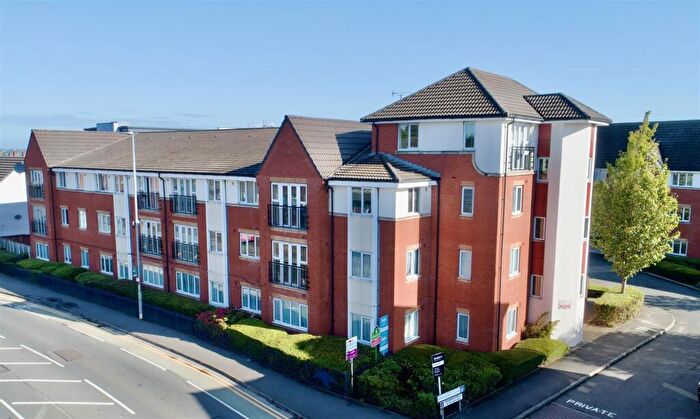
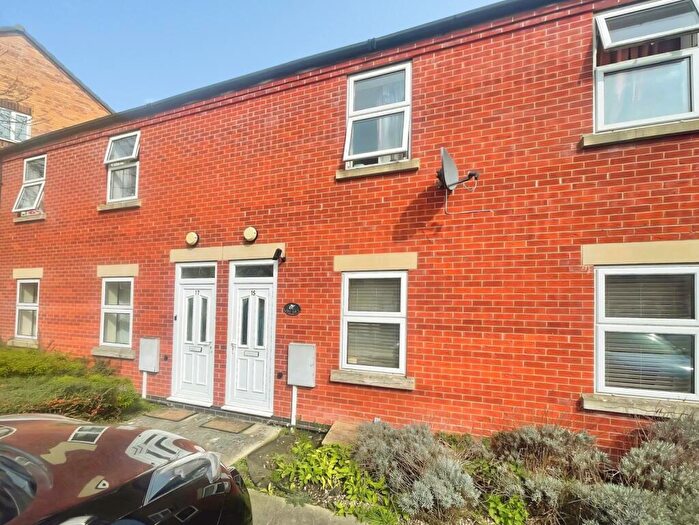
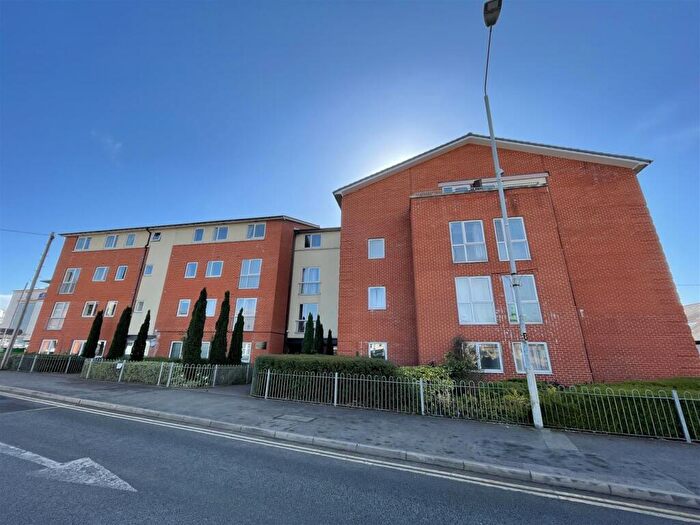
Properties for sale in Loughborough Southfields
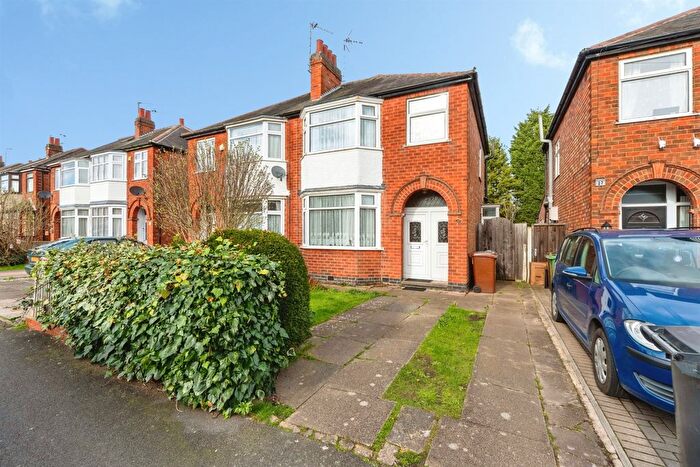
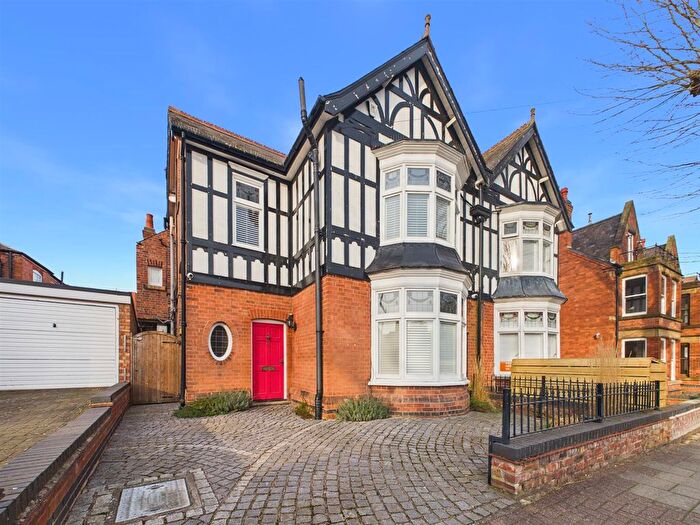
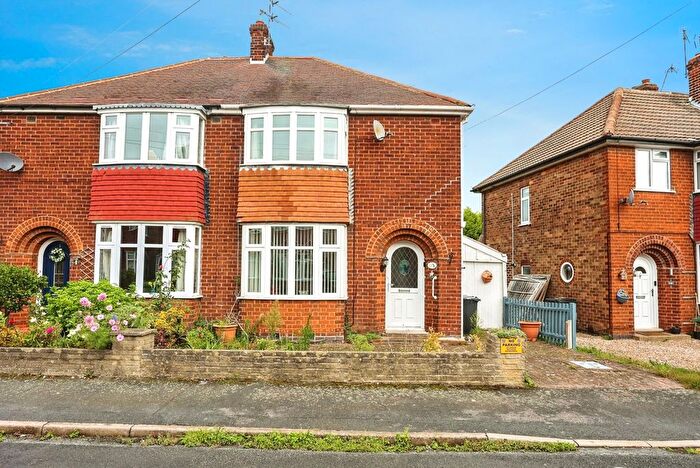

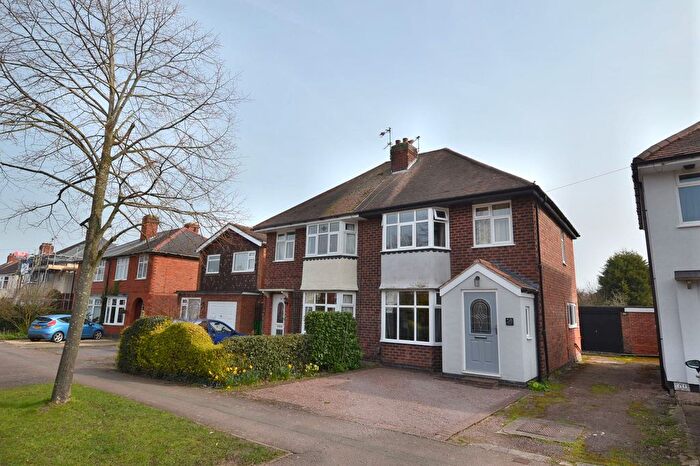
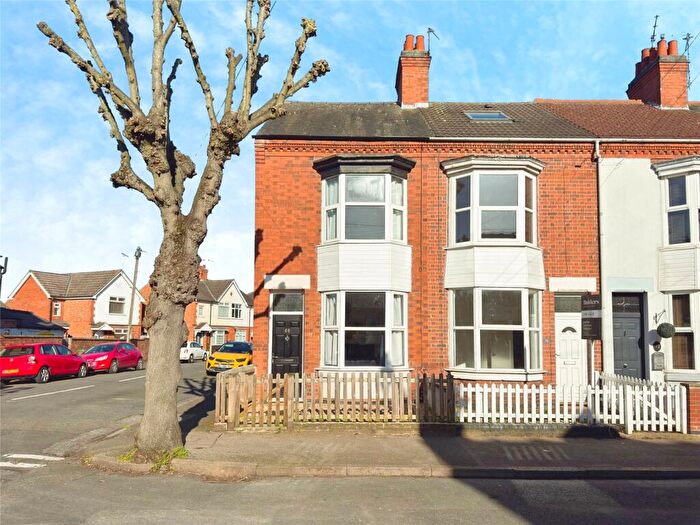
![]()
If you are looking to sell your house, let it out, or receive a property valuation, an expert can help you.
Click the button below to get started.


Roads and Postcodes in Loughborough Southfields
Navigate through our locations to find the location of your next house in Loughborough Southfields, Loughborough for sale or to rent.
Transport near Loughborough Southfields

- FAQ
- Price Paid By Year
- Property Type Price
Frequently asked questions about Loughborough Southfields
What is the average price for a property for sale in Loughborough Southfields?
The average price for a property for sale in Loughborough Southfields is £269,809. This amount is 5% lower than the average price in Loughborough. There are 1,399 property listings for sale in Loughborough Southfields.
What streets have the most expensive properties for sale in Loughborough Southfields?
The streets with the most expensive properties for sale in Loughborough Southfields are Packe Street at an average of £580,000, Burfield Avenue at an average of £549,166 and Castledine Street at an average of £490,556.
What streets have the most affordable properties for sale in Loughborough Southfields?
The streets with the most affordable properties for sale in Loughborough Southfields are Woodgate at an average of £59,103, Victoria Street at an average of £115,009 and Market Street at an average of £126,250.
Which train stations are available in or near Loughborough Southfields?
Some of the train stations available in or near Loughborough Southfields are Loughborough, Barrow-Upon-Soar and Sileby.
Property Price Paid in Loughborough Southfields by Year
The average sold property price by year was:
| Year | Average Sold Price | Price Change |
Sold Properties
|
|---|---|---|---|
| 2026 | £385,000 | 32% |
1 Property |
| 2025 | £261,135 | -13% |
55 Properties |
| 2024 | £295,033 | 14% |
76 Properties |
| 2023 | £252,531 | -25% |
90 Properties |
| 2022 | £315,508 | 18% |
90 Properties |
| 2021 | £257,837 | -17% |
108 Properties |
| 2020 | £300,788 | 19% |
87 Properties |
| 2019 | £243,698 | 5% |
75 Properties |
| 2018 | £230,885 | 3% |
88 Properties |
| 2017 | £223,365 | 1% |
106 Properties |
| 2016 | £221,652 | 13% |
95 Properties |
| 2015 | £192,176 | 2% |
79 Properties |
| 2014 | £188,824 | -3% |
87 Properties |
| 2013 | £194,155 | 2% |
66 Properties |
| 2012 | £191,127 | 12% |
55 Properties |
| 2011 | £167,754 | -14% |
51 Properties |
| 2010 | £191,506 | 3% |
58 Properties |
| 2009 | £186,698 | 11% |
72 Properties |
| 2008 | £165,968 | -19% |
60 Properties |
| 2007 | £197,037 | 6% |
153 Properties |
| 2006 | £184,763 | 6% |
134 Properties |
| 2005 | £172,863 | -0,1% |
99 Properties |
| 2004 | £173,086 | 5% |
112 Properties |
| 2003 | £163,976 | 12% |
178 Properties |
| 2002 | £144,192 | 18% |
184 Properties |
| 2001 | £118,093 | 29% |
133 Properties |
| 2000 | £84,143 | 9% |
110 Properties |
| 1999 | £76,267 | 12% |
94 Properties |
| 1998 | £67,427 | -1% |
88 Properties |
| 1997 | £68,434 | 15% |
96 Properties |
| 1996 | £58,282 | -6% |
92 Properties |
| 1995 | £61,823 | - |
71 Properties |
Property Price per Property Type in Loughborough Southfields
Here you can find historic sold price data in order to help with your property search.
The average Property Paid Price for specific property types in the last three years are:
| Property Type | Average Sold Price | Sold Properties |
|---|---|---|
| Flat | £116,879.00 | 39 Flats |
| Semi Detached House | £269,970.00 | 71 Semi Detached Houses |
| Detached House | £415,824.00 | 49 Detached Houses |
| Terraced House | £250,733.00 | 63 Terraced Houses |