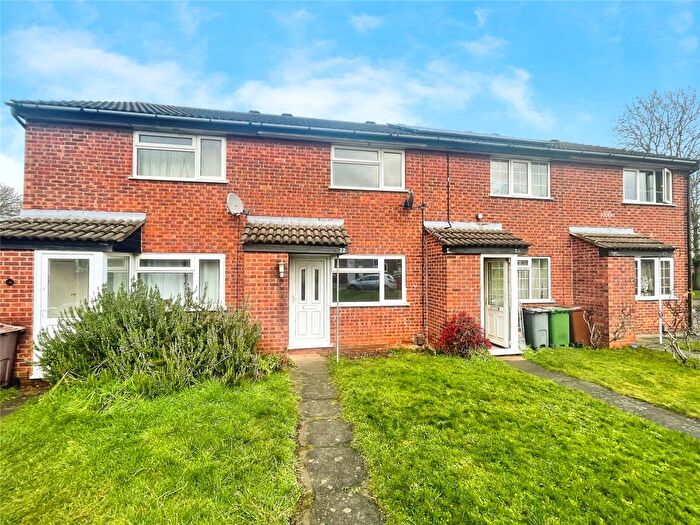
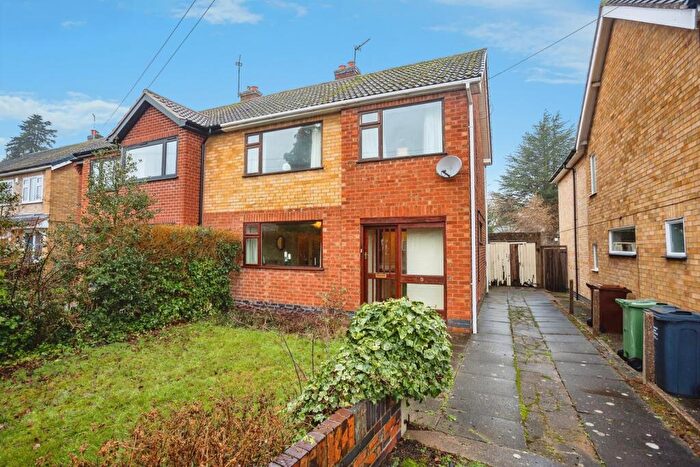
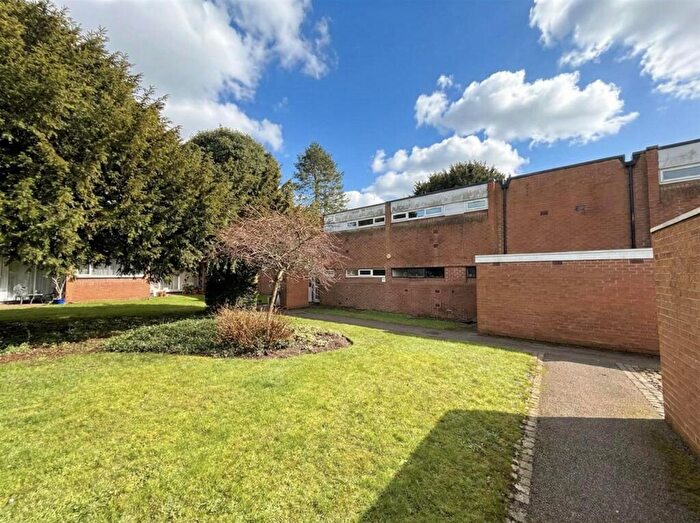
Houses for sale & to rent in Loughborough Ashby, Loughborough
House Prices in Loughborough Ashby
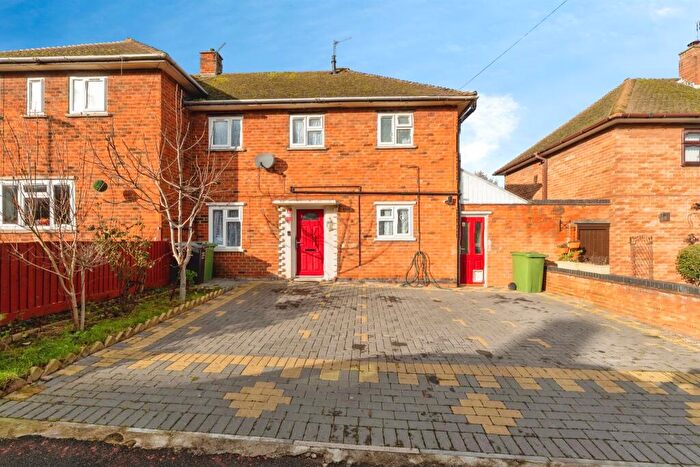
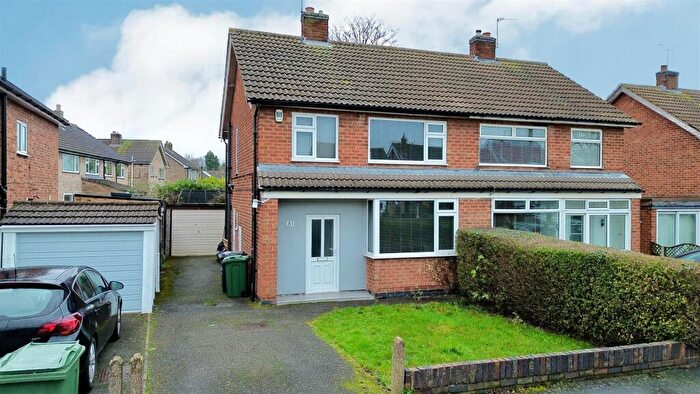
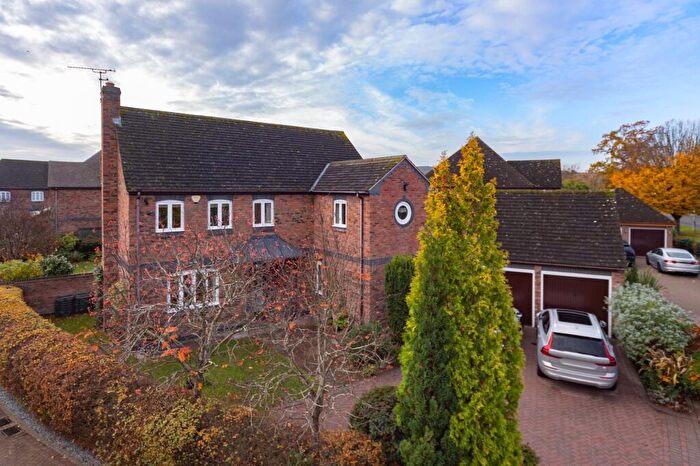
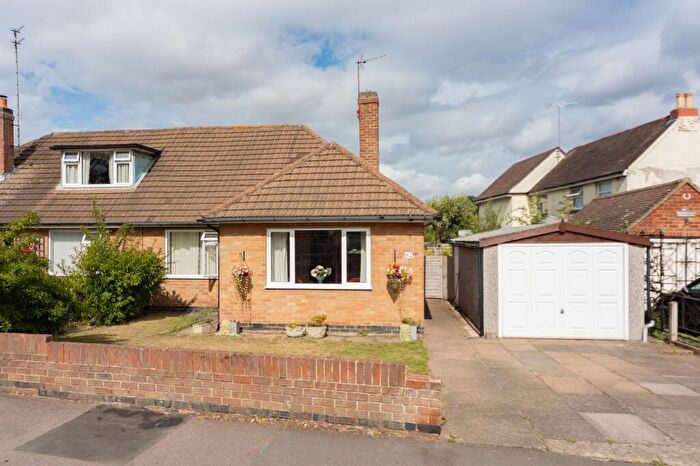
Properties in Loughborough Ashby have an average house price of £197,128.00 and had 94 Property Transactions within the last 3 years¹.
Loughborough Ashby is an area in Loughborough, Leicestershire with 1,280 households², where the most expensive property was sold for £360,000.00.
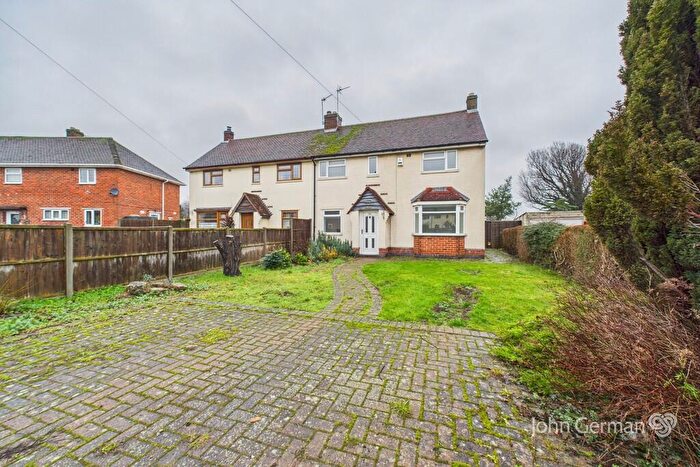
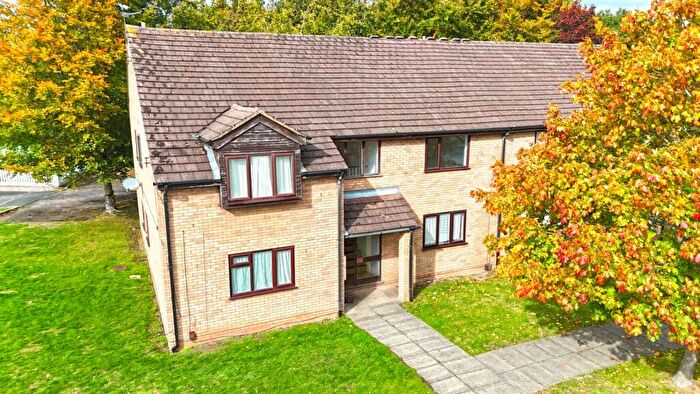
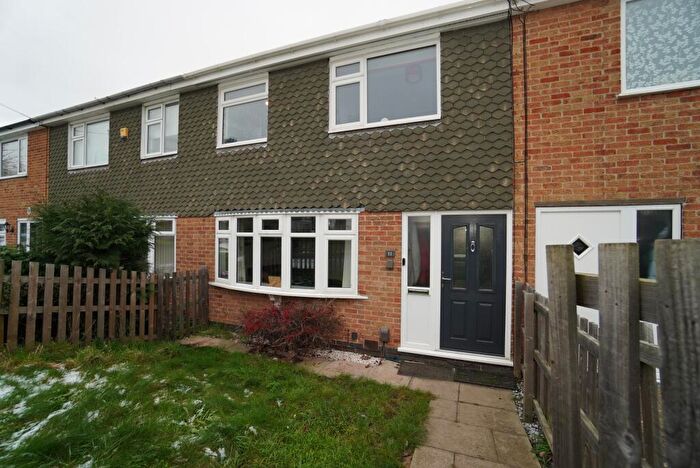
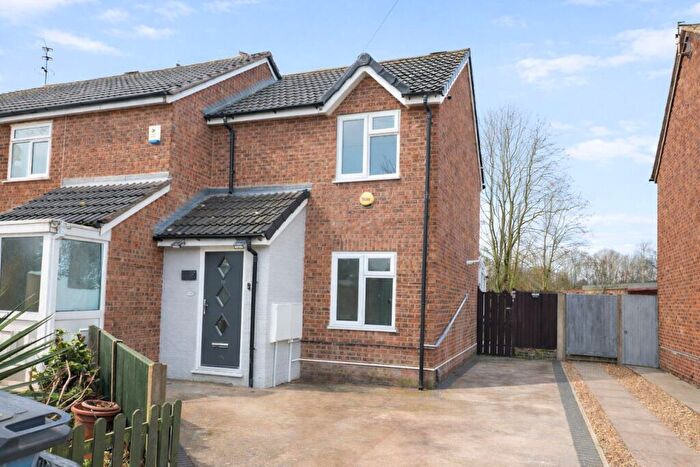
Properties for sale in Loughborough Ashby
Roads and Postcodes in Loughborough Ashby
Navigate through our locations to find the location of your next house in Loughborough Ashby, Loughborough for sale or to rent.
| Streets | Postcodes |
|---|---|
| Alan Moss Road | LE11 4LU LE11 4NA |
| Angus Drive | LE11 4WH |
| Ashby Crescent | LE11 4ES |
| Ashby Road | LE11 3TE LE11 3TH LE11 3TQ LE11 3TR LE11 3TT LE11 3TY LE11 3UA |
| Blackbrook Road | LE11 4PY LE11 4PZ |
| Browning Road | LE11 4JL |
| Cotswold Close | LE11 3AN |
| Garendon Green | LE11 4QA LE11 4QL |
| Garendon Road | LE11 4QB LE11 4QD LE11 4QP |
| Gracedieu Road | LE11 4QF LE11 4QG |
| Hermitage Road | LE11 4PA LE11 4PB LE11 4PD LE11 4PE LE11 4PF |
| Knightthorpe Road | LE11 4JX |
| Larkin Lane | LE11 4LH |
| New Ashby Court | LE11 4EQ |
| New Ashby Road | LE11 4ET LE11 4EU LE11 4EX |
| Newbon Close | LE11 4WJ |
| Old Ashby Road | LE11 4LA LE11 4PG LE11 4PQ |
| Rupert Brooke Road | LE11 4NJ |
| Schofield Road | LE11 4QH LE11 4QJ |
| Sharpley Road | LE11 4PJ LE11 4PL LE11 4PN LE11 4PW |
| Skevington Avenue | LE11 4WL |
| Trackside Close | LE11 4QE |
| Wordsworth Road | LE11 4LG LE11 4LQ |
| LE11 3AR LE11 3TJ LE11 3TP LE11 3TX LE11 3TZ LE11 3UB LE11 3UQ LE11 3UR LE11 3US |
Transport near Loughborough Ashby
-
Loughborough Station
-
Barrow-Upon-Soar Station
-
Sileby Station
-
East Midlands Parkway Station
-
Syston Station
-
Long Eaton Station
-
Attenborough Station
- FAQ
- Price Paid By Year
- Property Type Price
Frequently asked questions about Loughborough Ashby
What is the average price for a property for sale in Loughborough Ashby?
The average price for a property for sale in Loughborough Ashby is £197,128. This amount is 30% lower than the average price in Loughborough. There are 857 property listings for sale in Loughborough Ashby.
What streets have the most expensive properties for sale in Loughborough Ashby?
The streets with the most expensive properties for sale in Loughborough Ashby are Garendon Road at an average of £249,666, Garendon Green at an average of £247,500 and Angus Drive at an average of £219,483.
What streets have the most affordable properties for sale in Loughborough Ashby?
The streets with the most affordable properties for sale in Loughborough Ashby are Newbon Close at an average of £156,666, Browning Road at an average of £163,000 and Old Ashby Road at an average of £171,187.
Which train stations are available in or near Loughborough Ashby?
Some of the train stations available in or near Loughborough Ashby are Loughborough, Barrow-Upon-Soar and Sileby.
Property Price Paid in Loughborough Ashby by Year
The average sold property price by year was:
| Year | Average Sold Price | Price Change |
Sold Properties
|
|---|---|---|---|
| 2025 | £195,567 | -0,3% |
29 Properties |
| 2024 | £196,125 | -2% |
29 Properties |
| 2023 | £199,194 | -3% |
36 Properties |
| 2022 | £206,089 | 20% |
39 Properties |
| 2021 | £165,021 | 9% |
42 Properties |
| 2020 | £150,086 | -2% |
26 Properties |
| 2019 | £153,455 | -3% |
28 Properties |
| 2018 | £158,541 | 0,1% |
36 Properties |
| 2017 | £158,356 | 16% |
24 Properties |
| 2016 | £133,344 | 2% |
39 Properties |
| 2015 | £130,231 | 5% |
36 Properties |
| 2014 | £123,754 | 8% |
37 Properties |
| 2013 | £113,501 | 5% |
30 Properties |
| 2012 | £108,188 | -0,1% |
21 Properties |
| 2011 | £108,269 | -14% |
25 Properties |
| 2010 | £123,206 | 3% |
25 Properties |
| 2009 | £119,549 | -6% |
19 Properties |
| 2008 | £127,289 | 2% |
29 Properties |
| 2007 | £124,965 | 10% |
57 Properties |
| 2006 | £112,465 | -0,3% |
50 Properties |
| 2005 | £112,788 | -2% |
50 Properties |
| 2004 | £114,512 | 11% |
45 Properties |
| 2003 | £101,997 | 35% |
61 Properties |
| 2002 | £66,567 | 18% |
58 Properties |
| 2001 | £54,414 | 11% |
50 Properties |
| 2000 | £48,631 | -2% |
54 Properties |
| 1999 | £49,361 | 19% |
31 Properties |
| 1998 | £40,103 | -1% |
40 Properties |
| 1997 | £40,393 | -2% |
40 Properties |
| 1996 | £41,398 | -1% |
30 Properties |
| 1995 | £41,989 | - |
20 Properties |
Property Price per Property Type in Loughborough Ashby
Here you can find historic sold price data in order to help with your property search.
The average Property Paid Price for specific property types in the last three years are:
| Property Type | Average Sold Price | Sold Properties |
|---|---|---|
| Semi Detached House | £195,946.00 | 40 Semi Detached Houses |
| Detached House | £313,125.00 | 4 Detached Houses |
| Terraced House | £192,598.00 | 48 Terraced Houses |
| Flat | £97,500.00 | 2 Flats |

