Houses for sale & to rent in Sileby, Loughborough
House Prices in Sileby
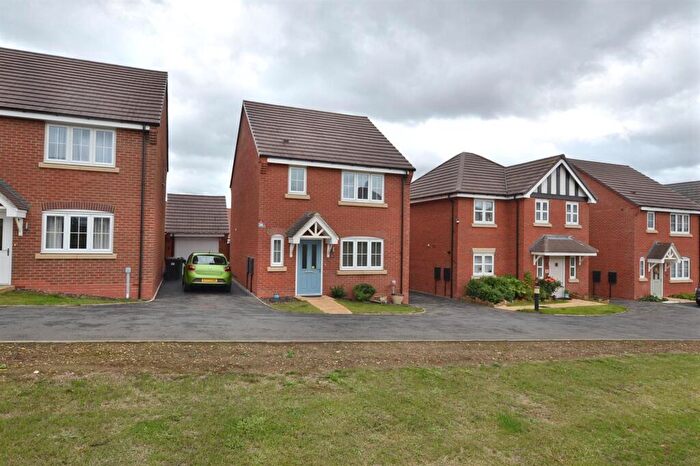
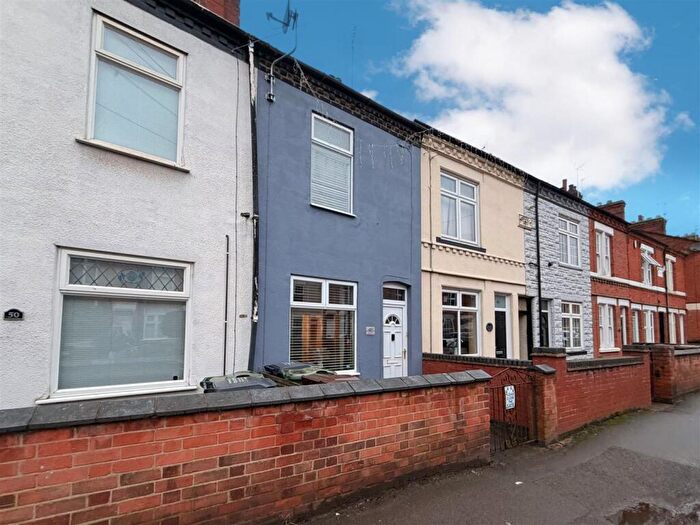
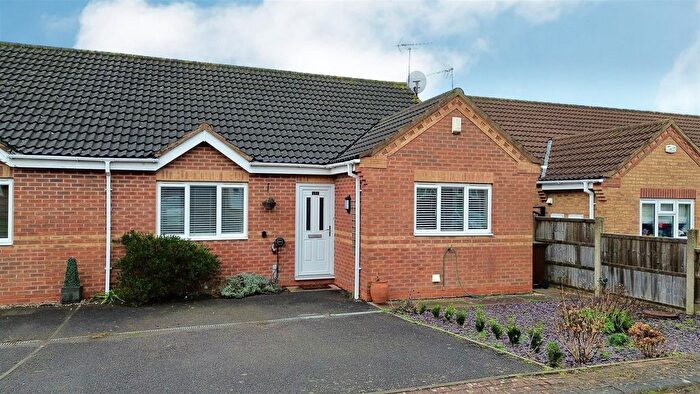
Properties in Sileby have an average house price of £233,787.00 and had 362 Property Transactions within the last 3 years¹.
Sileby is an area in Loughborough, Leicestershire with 3,036 households², where the most expensive property was sold for £680,000.00.
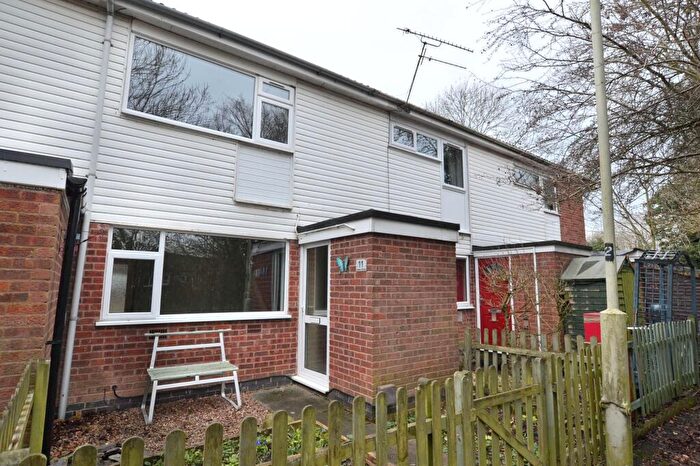
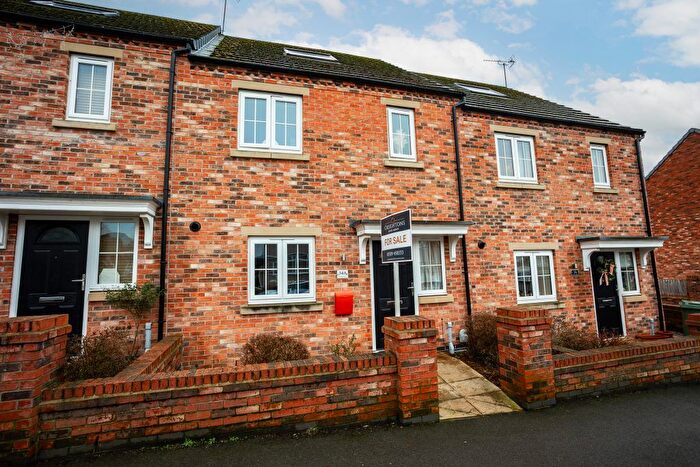
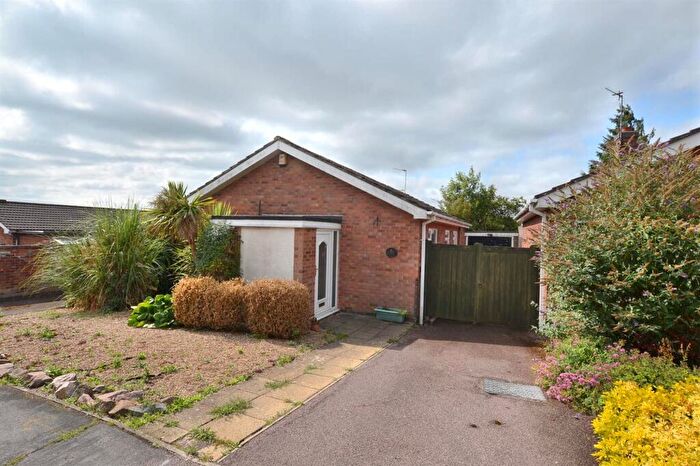
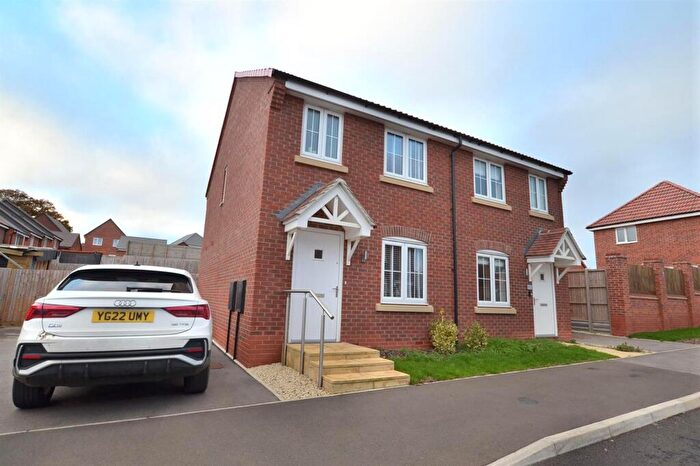
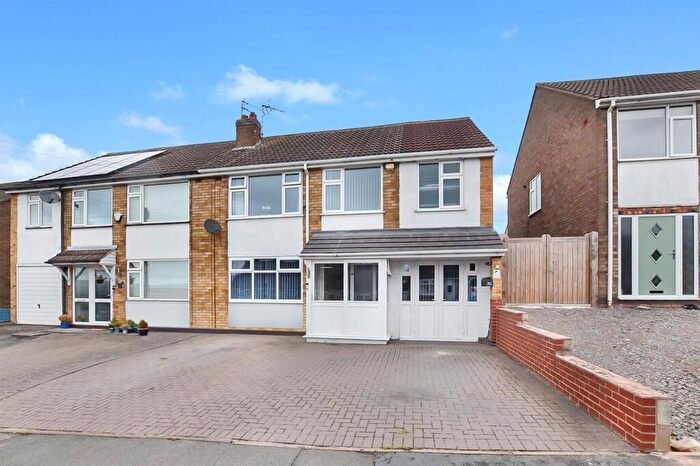
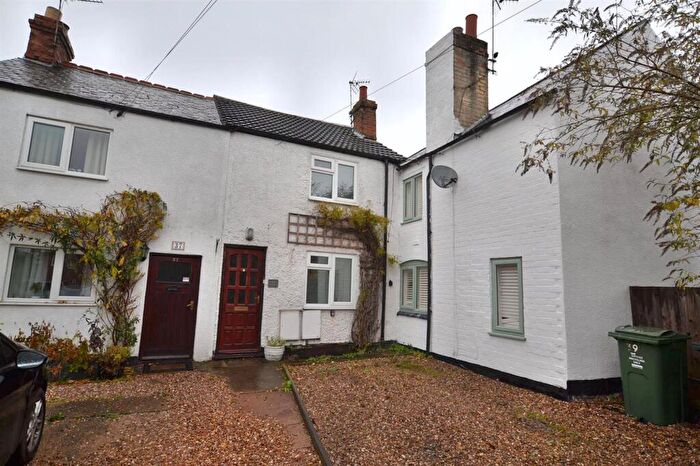
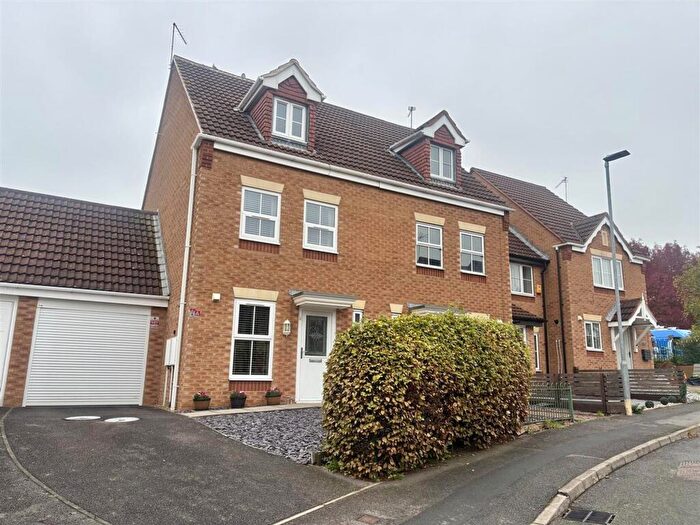
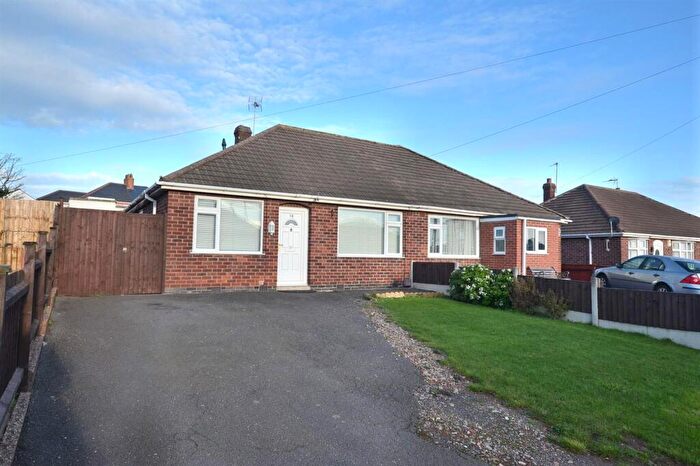
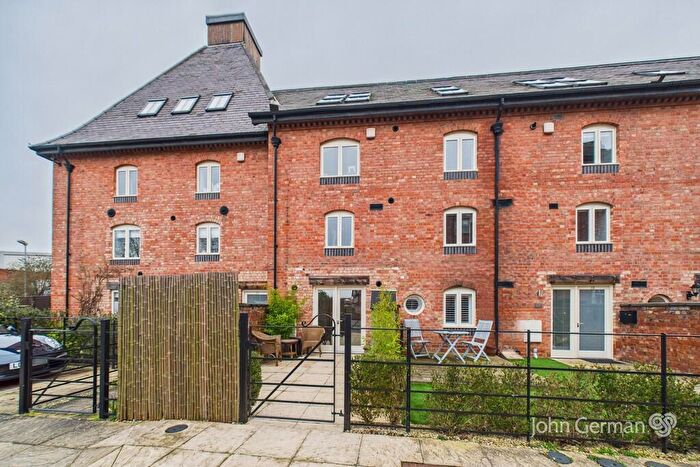
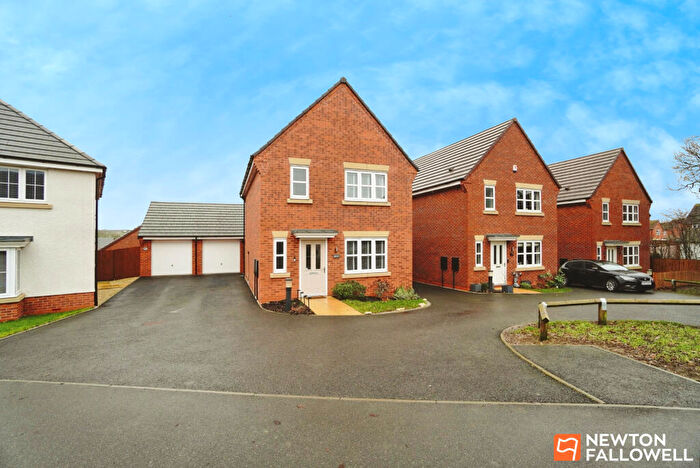
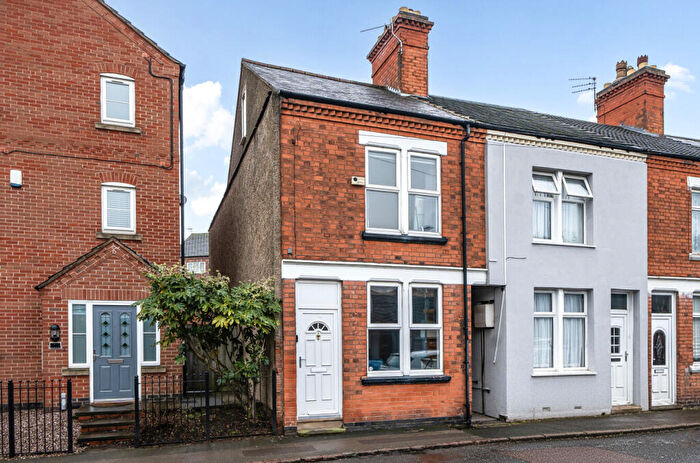
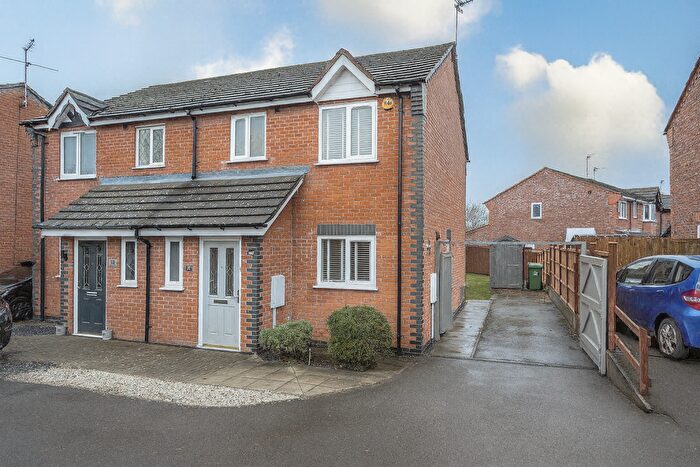
Properties for sale in Sileby
Roads and Postcodes in Sileby
Navigate through our locations to find the location of your next house in Sileby, Loughborough for sale or to rent.
| Streets | Postcodes |
|---|---|
| Ainsworth Drive | LE12 7QN |
| Albert Avenue | LE12 7TA |
| Albion Road | LE12 7RA |
| Avenue Road | LE12 7PG |
| Back Lane | LE12 7RB |
| Banks Close | LE12 7SP |
| Barnards Drive | LE12 7QL |
| Barradale Avenue | LE12 7TB |
| Belgrave Close | LE12 7XB |
| Bowling Green Close | LE12 7QX |
| Bradgate Close | LE12 7UW |
| Bramley Close | LE12 7UN |
| Bray Close | LE12 7DF |
| Brook Street | LE12 7DR LE12 7RF |
| Brooks Close | LE12 7GX |
| Brushfield Avenue | LE12 7NX |
| Burton Road | LE12 7RU |
| Butler Way | LE12 7GR |
| Caloe Close | LE12 7QD |
| Cauby Close | LE12 7PQ |
| Cemetery Road | LE12 7PH |
| Chalfont Drive | LE12 7RQ |
| Chaplin Close | LE12 7SZ |
| Charles Street | LE12 7RH LE12 7RJ LE12 7SH LE12 7SJ |
| Claire Court | LE12 7QY |
| Collingwood Drive | LE12 7NT |
| Cossington Road | LE12 7RP LE12 7RR LE12 7RS LE12 7RT LE12 7RW |
| Cygnet Close | LE12 7LJ |
| Dickens Close | LE12 7EF |
| East Orchard | LE12 7SX |
| Finsbury Avenue | LE12 7PJ |
| Flaxland Crescent | LE12 7SB |
| Forest Drive | LE12 7TD |
| Fredrick Street | LE12 7XD |
| Gibson Road | LE12 7PE |
| Gray Lane | LE12 7GS |
| Greedon Rise | LE12 7TE LE12 7TF |
| Hanover Drive | LE12 7PL |
| Harlequin Road | LE12 7UR |
| Haybrook Road | LE12 7QR |
| Heathcote Drive | LE12 7NB LE12 7ND |
| Hickling Drive | LE12 7PA |
| High Street | LE12 7RX |
| Highbridge | LE12 7LG |
| Highgate Road | LE12 7PN LE12 7PP LE12 7PR LE12 7PW |
| Highreeds End | LE12 7WN |
| Hobbs Wick | LE12 7SF |
| Homefield Road | LE12 7TG LE12 7TQ |
| Howgate Close | LE12 7WP |
| Hudson Road | LE12 7RY |
| Jenham Drive | LE12 7DP |
| Jubilee Avenue | LE12 7TH |
| Kendal Road | LE12 7PF |
| Kilbourne Close | LE12 7SD |
| King Street | LE12 7LZ LE12 7NA |
| Ladkin Close | LE12 7WR |
| Lanes Close | LE12 7PD |
| Lawson Close | LE12 7SR |
| Little Church Lane | LE12 7NE |
| Lynton Close | LE12 7QZ |
| Manor Drive | LE12 7RZ |
| Marshall Avenue | LE12 7QT |
| Melody Drive | LE12 7UT LE12 7UU |
| Middle Orchard | LE12 7TY |
| Mill Lane | LE12 7UX |
| Milner Close | LE12 7SE |
| Moir Close | LE12 7RN |
| Molyneux Drive | LE12 7SL |
| Moreton Dale | LE12 7QP |
| Newbold Close | LE12 7PB |
| Northill Close | LE12 7PS |
| Old Tannery Drive | LE12 7UP |
| Old Vicarage Mews | LE12 7FZ |
| Park Road | LE12 7TJ |
| Parsons Drive | LE12 7QH |
| Paudy Lane | LE12 8GB |
| Peashill Close | LE12 7PT |
| Phoenix Drive | LE12 7QU |
| Pochin Way | LE12 7QS |
| Preston Close | LE12 7RG |
| Pryor Road | LE12 7NS |
| Quaker Road | LE12 7SA |
| Ratcliffe Road | LE12 7PU LE12 7PX LE12 7PY LE12 7PZ LE12 7QA LE12 7QB |
| Roy Brown Drive | LE12 7WH |
| Saville Drive | LE12 7US |
| Seagrave Road | LE12 7NH LE12 7NJ LE12 7TN LE12 7TP LE12 7TR LE12 7TS LE12 7TW LE12 7TT |
| Sharpe Way | LE12 7XA |
| Sherrard Drive | LE12 7SG |
| Simons Drive | LE12 7TX |
| Southfield Avenue | LE12 7WL LE12 7WQ |
| Springfield Road | LE12 7EE |
| St Gregorys Drive | LE12 7QE |
| St Marys Road | LE12 7TL |
| Stanage Road | LE12 7QJ |
| Staveley Close | LE12 7QW |
| Storer Close | LE12 7UD |
| Sunnylands Drive | LE12 7WJ |
| Swan Street | LE12 7NN LE12 7NW |
| Taylor Drive | LE12 7WS |
| The Banks | LE12 7RD LE12 7RE |
| The Maltings | LE12 7WX |
| Towles Drive | LE12 7WY |
| Wallace Drive | LE12 7SQ |
| Wards Crescent | LE12 7QF |
| Wattle Close | LE12 7WU |
| Weldon Avenue | LE12 7NU |
| Wellbrook Avenue | LE12 7QG LE12 7QQ |
| West Orchard | LE12 7SW |
| Wheat Hill End | LE12 7WZ |
| Whitehead Close | LE12 7UZ |
| Willet Close | LE12 7SY |
| Windrush Close | LE12 7NP |
Transport near Sileby
- FAQ
- Price Paid By Year
- Property Type Price
Frequently asked questions about Sileby
What is the average price for a property for sale in Sileby?
The average price for a property for sale in Sileby is £233,787. This amount is 17% lower than the average price in Loughborough. There are 1,249 property listings for sale in Sileby.
What streets have the most expensive properties for sale in Sileby?
The streets with the most expensive properties for sale in Sileby are Little Church Lane at an average of £680,000, Towles Drive at an average of £500,000 and Taylor Drive at an average of £425,000.
What streets have the most affordable properties for sale in Sileby?
The streets with the most affordable properties for sale in Sileby are Cygnet Close at an average of £110,000, Cemetery Road at an average of £134,500 and Bradgate Close at an average of £144,000.
Which train stations are available in or near Sileby?
Some of the train stations available in or near Sileby are Sileby, Barrow-Upon-Soar and Syston.
Property Price Paid in Sileby by Year
The average sold property price by year was:
| Year | Average Sold Price | Price Change |
Sold Properties
|
|---|---|---|---|
| 2025 | £234,546 | -0,2% |
122 Properties |
| 2024 | £235,006 | 1% |
128 Properties |
| 2023 | £231,568 | -6% |
112 Properties |
| 2022 | £246,179 | 12% |
163 Properties |
| 2021 | £217,123 | 6% |
194 Properties |
| 2020 | £203,144 | 1% |
125 Properties |
| 2019 | £201,735 | -3% |
191 Properties |
| 2018 | £207,560 | 2% |
198 Properties |
| 2017 | £203,240 | 9% |
177 Properties |
| 2016 | £184,800 | 7% |
206 Properties |
| 2015 | £171,598 | 5% |
251 Properties |
| 2014 | £162,669 | 8% |
191 Properties |
| 2013 | £150,002 | 14% |
160 Properties |
| 2012 | £128,434 | -3% |
101 Properties |
| 2011 | £132,069 | -1% |
93 Properties |
| 2010 | £133,278 | -5% |
98 Properties |
| 2009 | £139,634 | -5% |
101 Properties |
| 2008 | £146,958 | -3% |
85 Properties |
| 2007 | £151,002 | 10% |
202 Properties |
| 2006 | £136,484 | 0,3% |
248 Properties |
| 2005 | £136,056 | -0,4% |
203 Properties |
| 2004 | £136,543 | 16% |
230 Properties |
| 2003 | £114,114 | 19% |
229 Properties |
| 2002 | £92,890 | 23% |
279 Properties |
| 2001 | £71,758 | 15% |
204 Properties |
| 2000 | £60,649 | 8% |
156 Properties |
| 1999 | £55,830 | 12% |
143 Properties |
| 1998 | £49,032 | 5% |
166 Properties |
| 1997 | £46,623 | 5% |
149 Properties |
| 1996 | £44,150 | 3% |
121 Properties |
| 1995 | £42,938 | - |
77 Properties |
Property Price per Property Type in Sileby
Here you can find historic sold price data in order to help with your property search.
The average Property Paid Price for specific property types in the last three years are:
| Property Type | Average Sold Price | Sold Properties |
|---|---|---|
| Semi Detached House | £235,215.00 | 153 Semi Detached Houses |
| Detached House | £329,048.00 | 68 Detached Houses |
| Terraced House | £195,002.00 | 124 Terraced Houses |
| Flat | £122,808.00 | 17 Flats |

