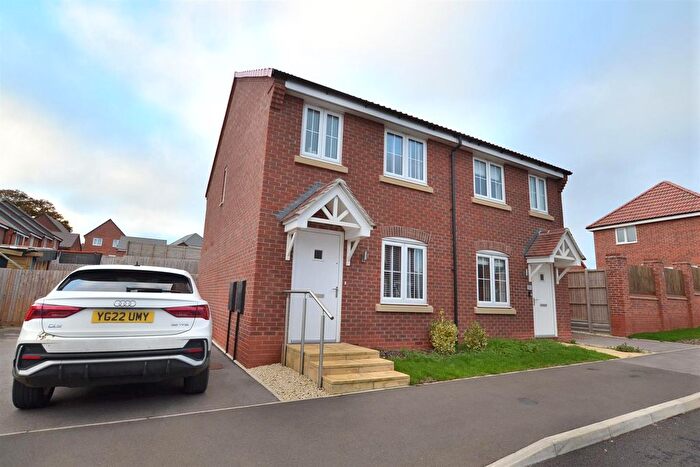
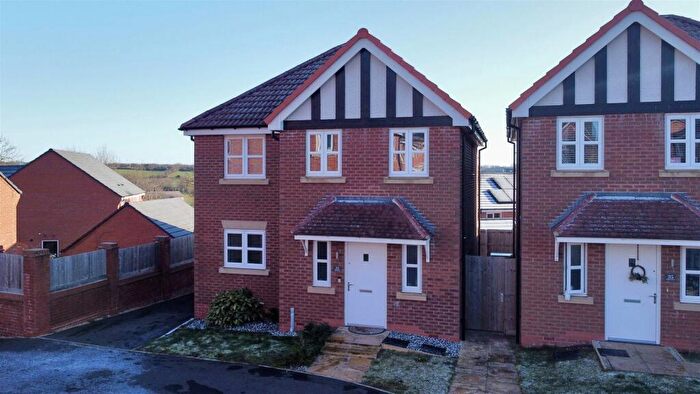
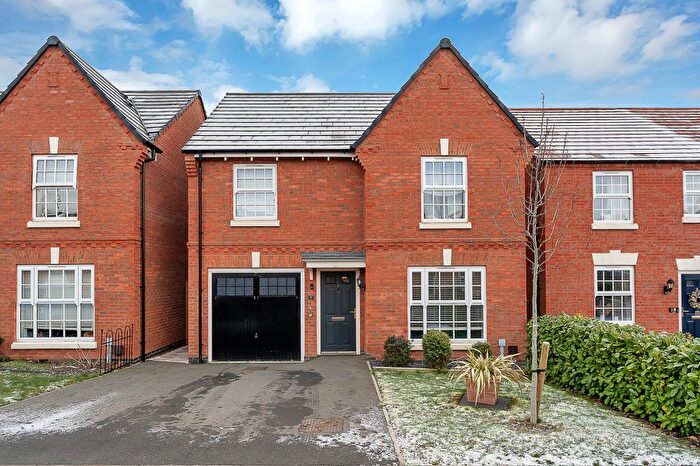
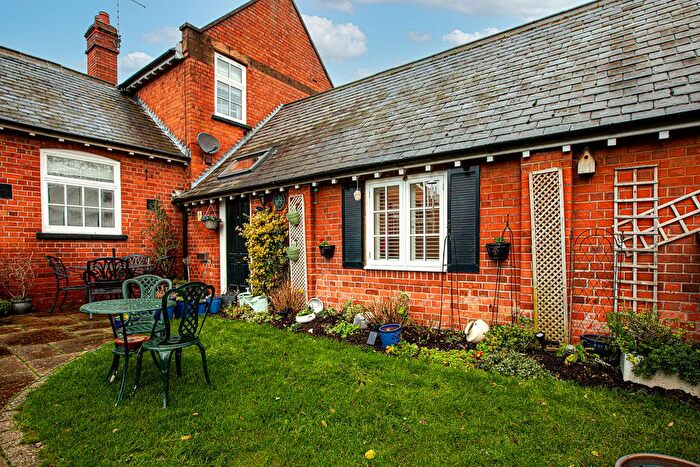
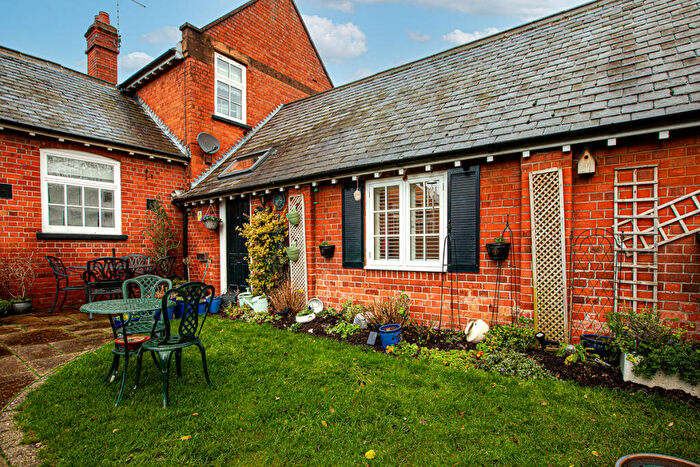
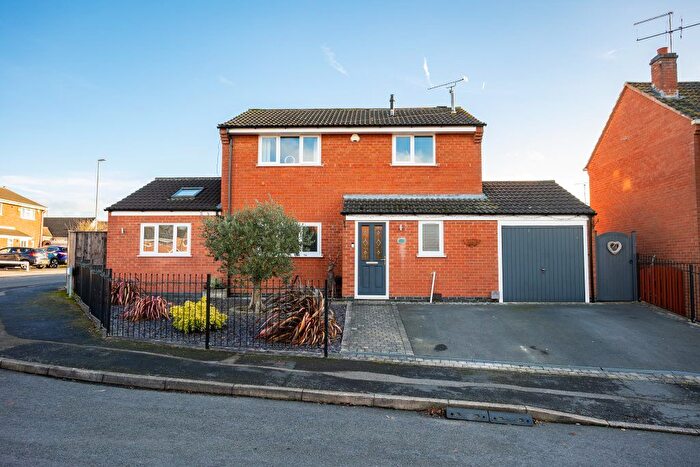
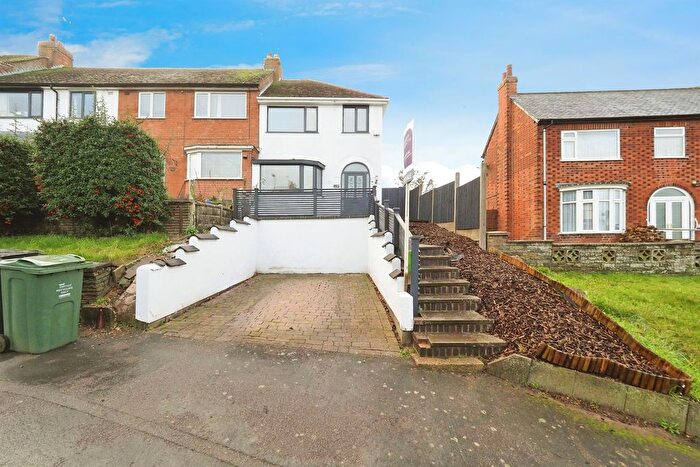
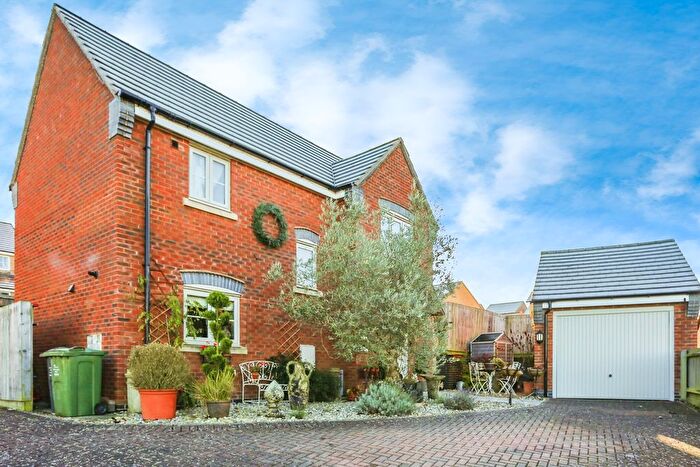
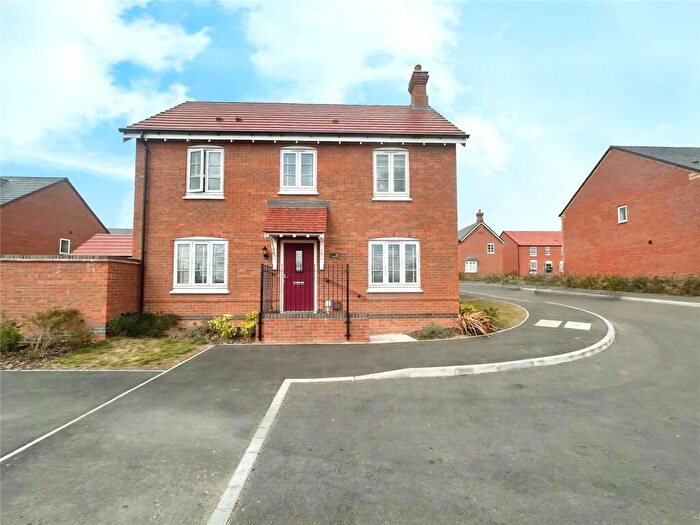
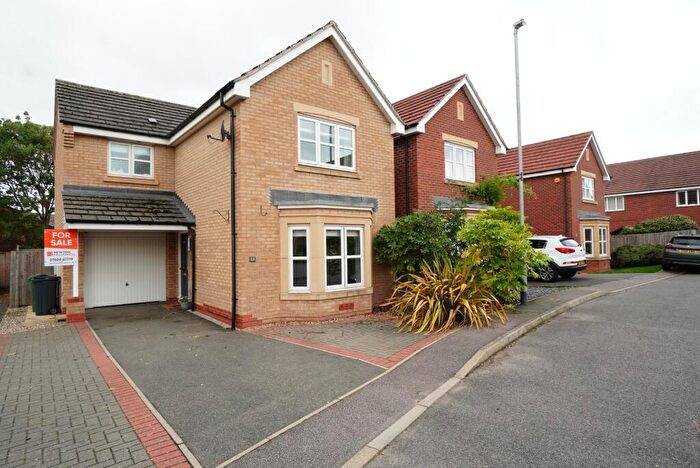
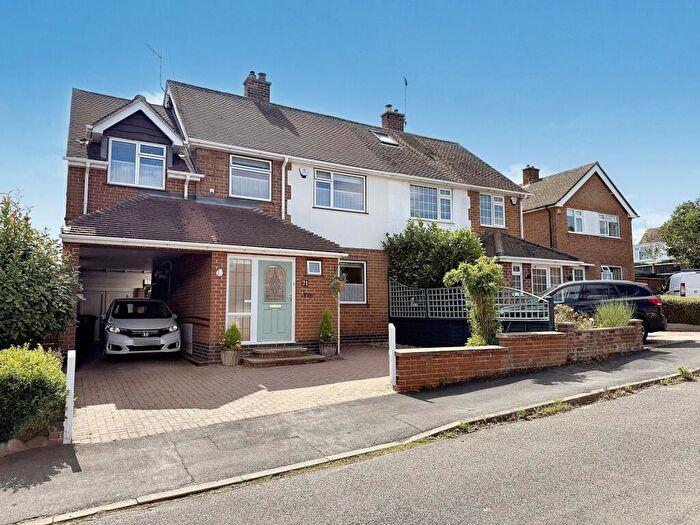
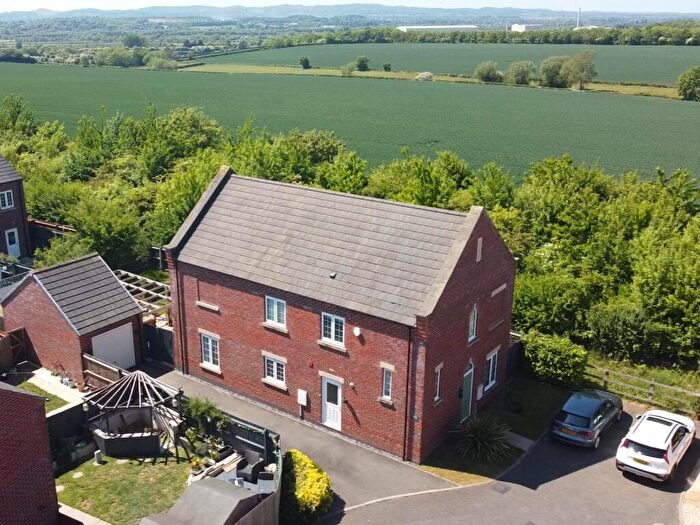
Houses for sale & to rent in Wreake Villages, Loughborough
House Prices in Wreake Villages
Properties in Wreake Villages have an average house price of £492,545.00 and had 21 Property Transactions within the last 3 years¹.
Wreake Villages is an area in Loughborough, Leicestershire with 209 households², where the most expensive property was sold for £1,000,000.00.
Properties for sale in Wreake Villages
Previously listed properties in Wreake Villages
Roads and Postcodes in Wreake Villages
Navigate through our locations to find the location of your next house in Wreake Villages, Loughborough for sale or to rent.
| Streets | Postcodes |
|---|---|
| Big Lane | LE12 7BG |
| Butchers Lane | LE12 7NR |
| Church Street | LE12 7LT |
| Green Lane | LE12 7LU |
| Green Lane Close | LE12 7LX |
| Hall Farm Court | LE12 7NZ |
| Hardy Court | LE12 7NY |
| Ivy House Close | LE12 7LE |
| King Street | LE12 7LY |
| Mucklegate Lane | LE12 7LD |
| Paudy Lane | LE12 7NG LE12 7FB LE12 8GU |
| Pawdy Lane | LE12 7GY |
| Pond Street | LE12 7NQ |
| Quorn Park | LE12 8HL |
| Swan Street | LE12 7NL |
| The Banks | LE12 7LN |
| The Orchard | LE12 7LH |
| Water Lane | LE12 7LL |
Transport near Wreake Villages
- FAQ
- Price Paid By Year
- Property Type Price
Frequently asked questions about Wreake Villages
What is the average price for a property for sale in Wreake Villages?
The average price for a property for sale in Wreake Villages is £492,545. This amount is 74% higher than the average price in Loughborough. There are 1,063 property listings for sale in Wreake Villages.
What streets have the most expensive properties for sale in Wreake Villages?
The streets with the most expensive properties for sale in Wreake Villages are Butchers Lane at an average of £725,000, Pond Street at an average of £606,000 and Church Street at an average of £600,000.
What streets have the most affordable properties for sale in Wreake Villages?
The streets with the most affordable properties for sale in Wreake Villages are Swan Street at an average of £407,500, King Street at an average of £437,500 and The Orchard at an average of £510,000.
Which train stations are available in or near Wreake Villages?
Some of the train stations available in or near Wreake Villages are Sileby, Barrow-Upon-Soar and Syston.
Property Price Paid in Wreake Villages by Year
The average sold property price by year was:
| Year | Average Sold Price | Price Change |
Sold Properties
|
|---|---|---|---|
| 2025 | £609,333 | 54% |
6 Properties |
| 2024 | £278,750 | -48% |
4 Properties |
| 2023 | £412,181 | -84% |
8 Properties |
| 2022 | £758,333 | 46% |
3 Properties |
| 2021 | £408,458 | -7% |
12 Properties |
| 2020 | £436,000 | 14% |
9 Properties |
| 2019 | £374,762 | -1% |
12 Properties |
| 2018 | £376,859 | -21% |
10 Properties |
| 2017 | £455,666 | 30% |
8 Properties |
| 2016 | £319,875 | -28% |
4 Properties |
| 2015 | £409,666 | 31% |
9 Properties |
| 2014 | £282,700 | -10% |
7 Properties |
| 2013 | £312,250 | 9% |
8 Properties |
| 2012 | £284,541 | -10% |
12 Properties |
| 2011 | £314,166 | 22% |
6 Properties |
| 2010 | £243,771 | -16% |
7 Properties |
| 2009 | £282,500 | -43% |
4 Properties |
| 2008 | £403,400 | 22% |
5 Properties |
| 2007 | £316,653 | -20% |
13 Properties |
| 2006 | £378,772 | 10% |
11 Properties |
| 2005 | £342,181 | 34% |
8 Properties |
| 2004 | £224,293 | -15% |
15 Properties |
| 2003 | £257,095 | 3% |
10 Properties |
| 2002 | £248,382 | 28% |
14 Properties |
| 2001 | £179,923 | -36% |
13 Properties |
| 2000 | £243,863 | 46% |
15 Properties |
| 1999 | £132,281 | 28% |
8 Properties |
| 1998 | £94,676 | -56% |
10 Properties |
| 1997 | £147,227 | 4% |
24 Properties |
| 1996 | £140,692 | 26% |
13 Properties |
| 1995 | £104,607 | - |
7 Properties |
Property Price per Property Type in Wreake Villages
Here you can find historic sold price data in order to help with your property search.
The average Property Paid Price for specific property types in the last three years are:
| Property Type | Average Sold Price | Sold Properties |
|---|---|---|
| Semi Detached House | £452,000.00 | 5 Semi Detached Houses |
| Detached House | £520,230.00 | 15 Detached Houses |
| Terraced House | £280,000.00 | 1 Terraced House |

