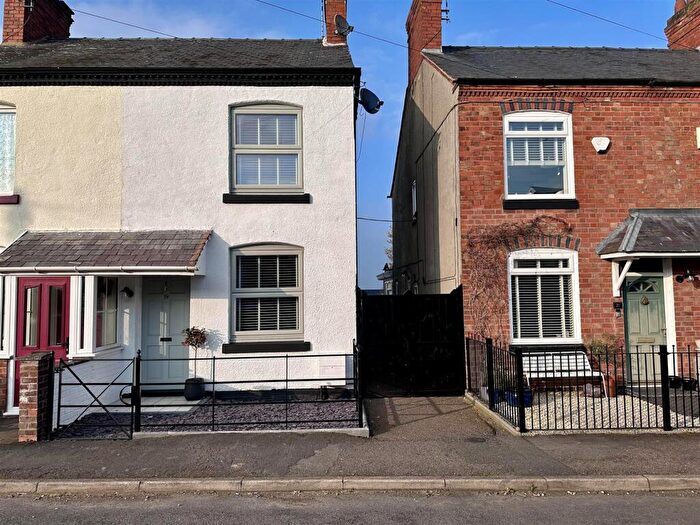
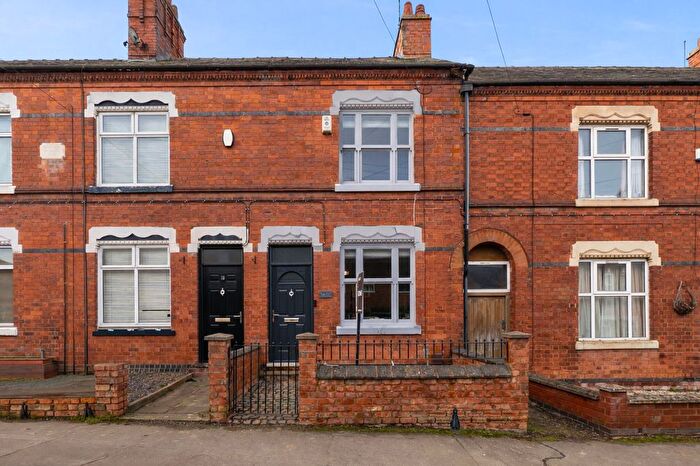
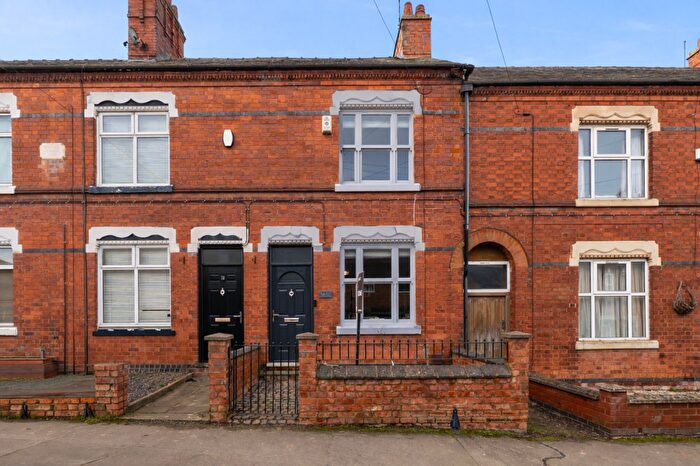
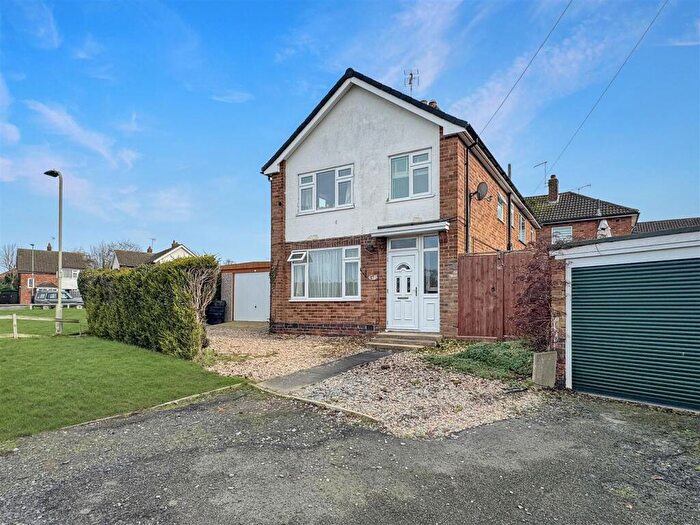
Houses for sale & to rent in Dunton, Lutterworth
House Prices in Dunton
Properties in Dunton have an average house price of £528,263.00 and had 57 Property Transactions within the last 3 years¹.
Dunton is an area in Lutterworth, Leicestershire with 873 households², where the most expensive property was sold for £2,000,000.00.
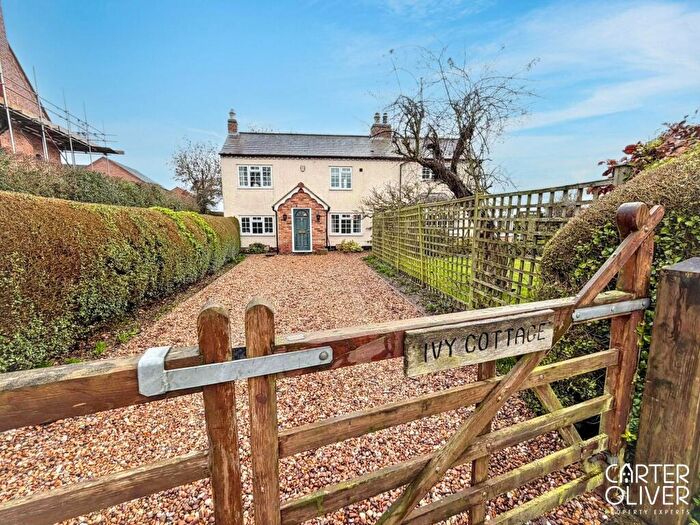
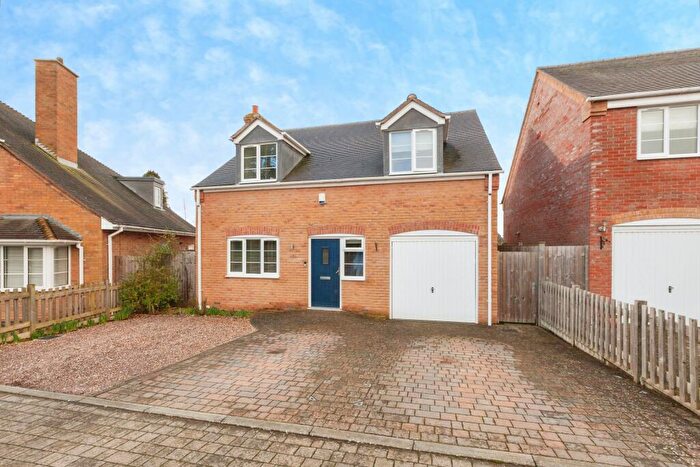
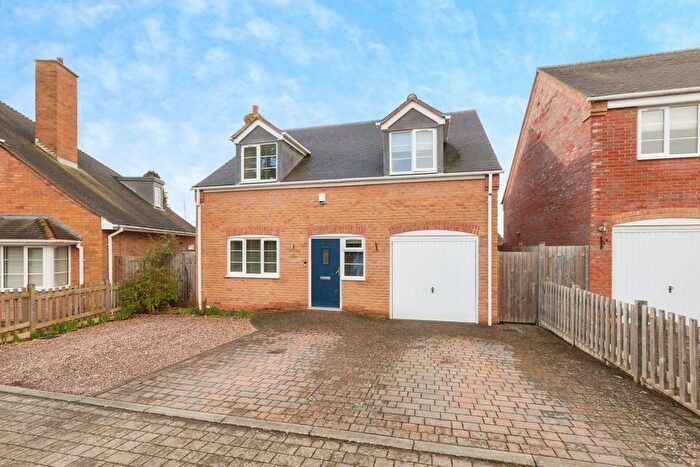
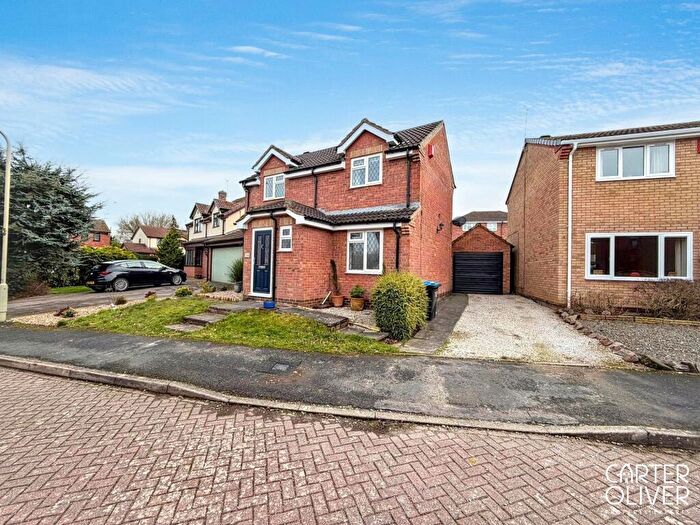
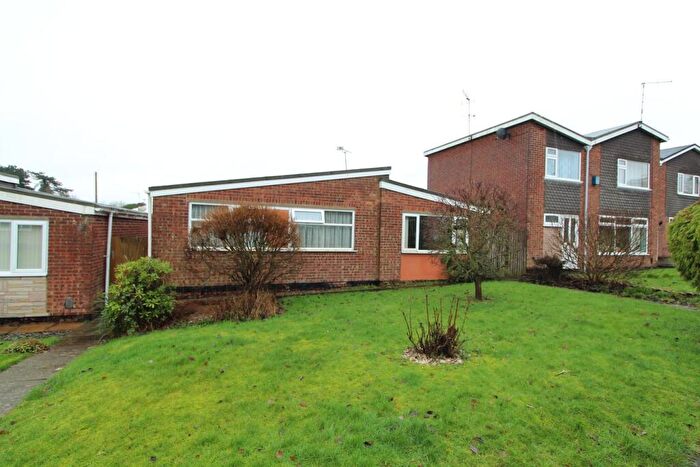
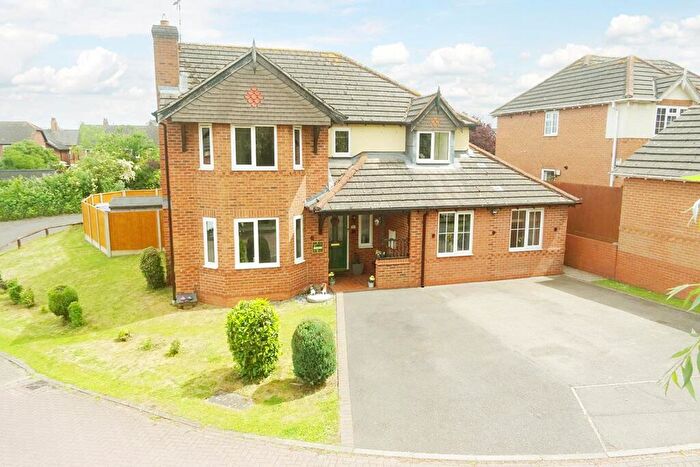
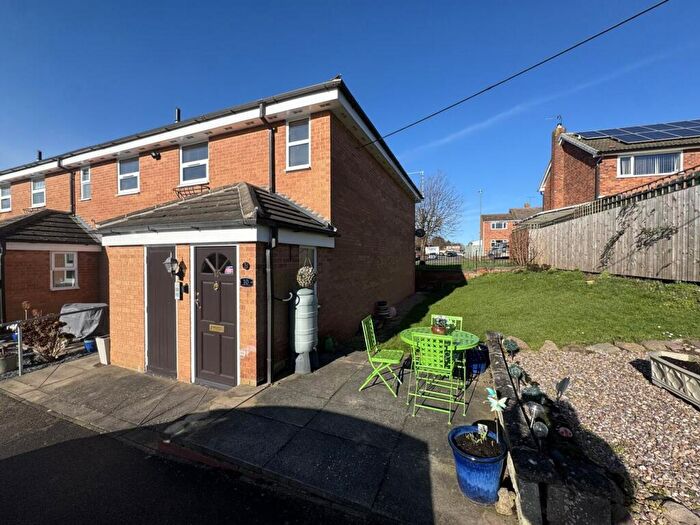
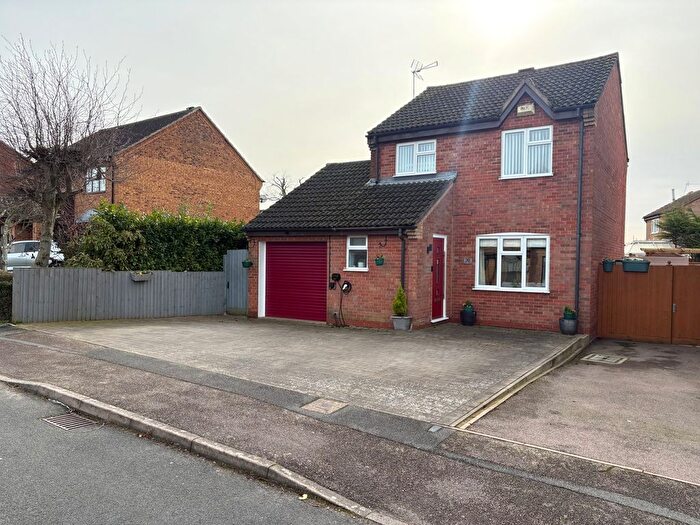
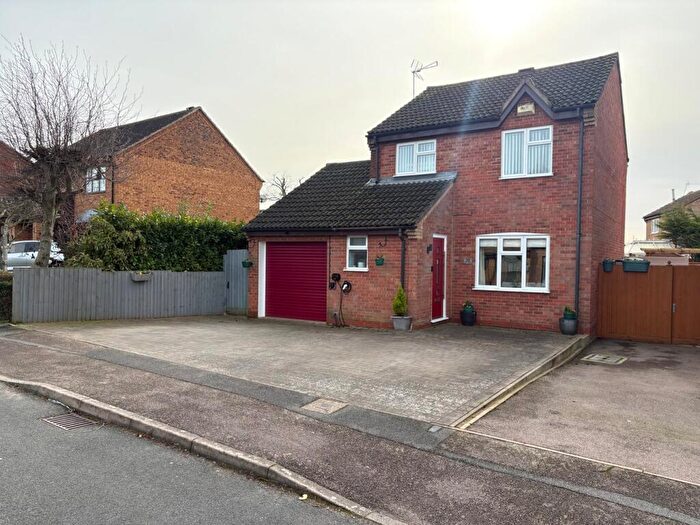
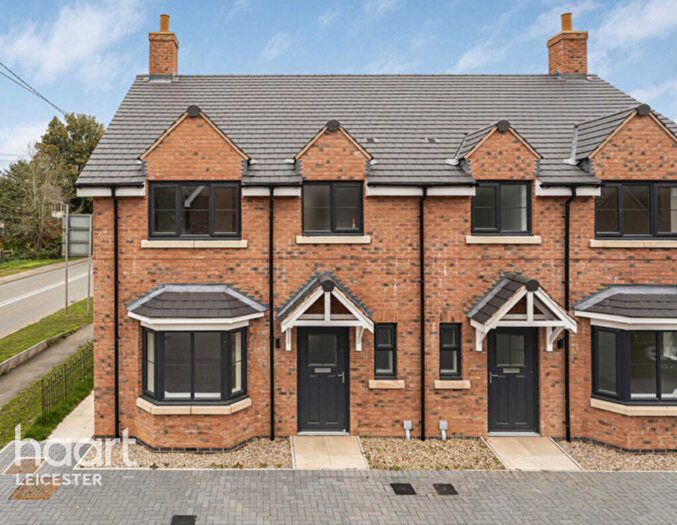
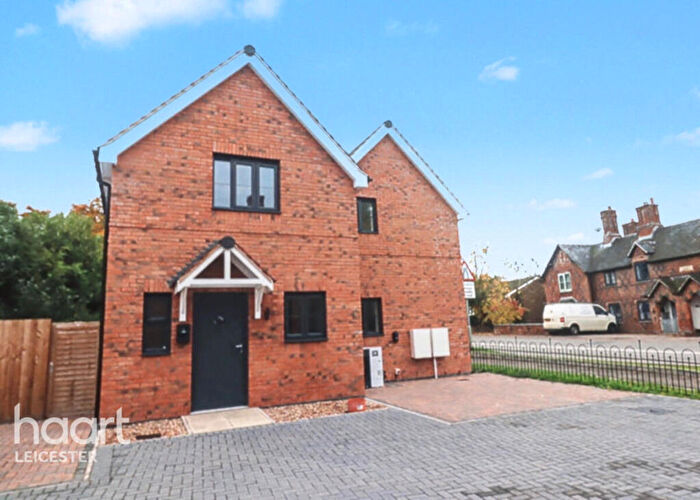
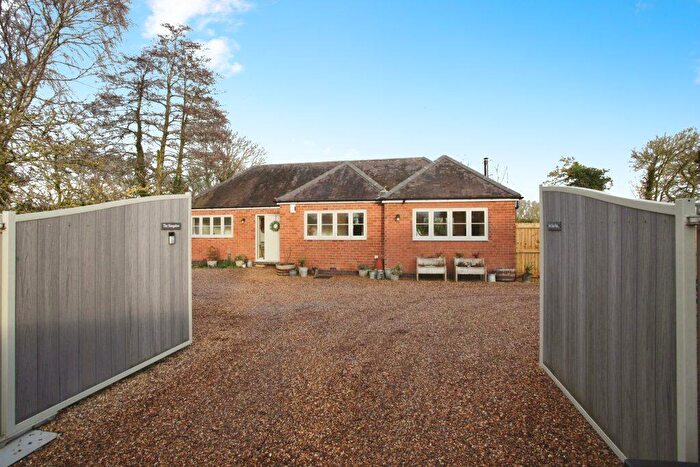
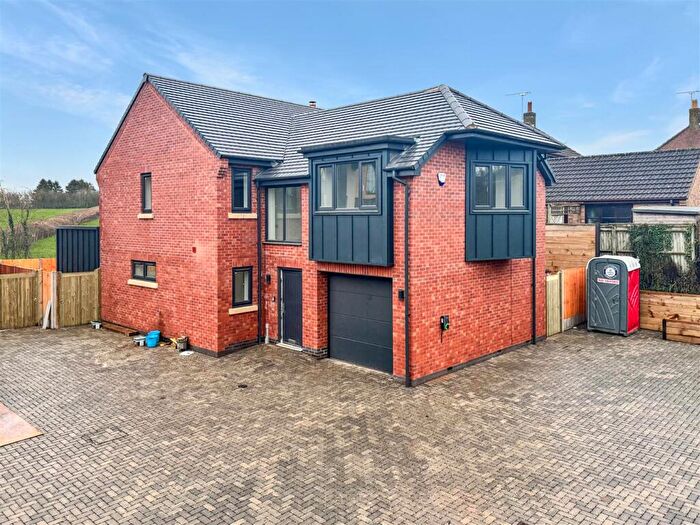
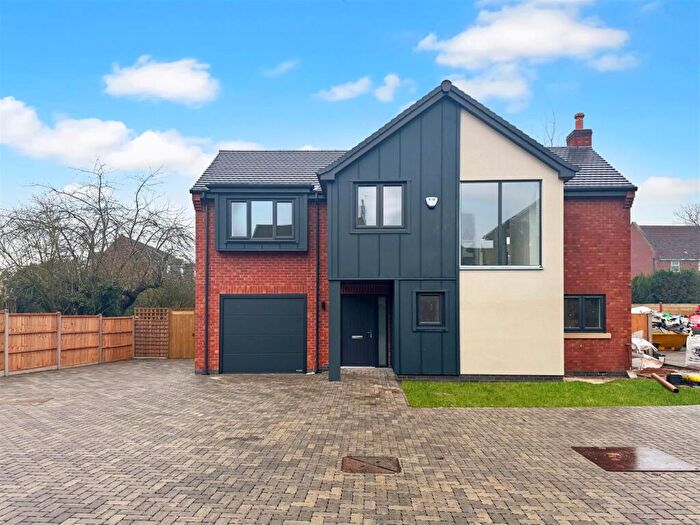
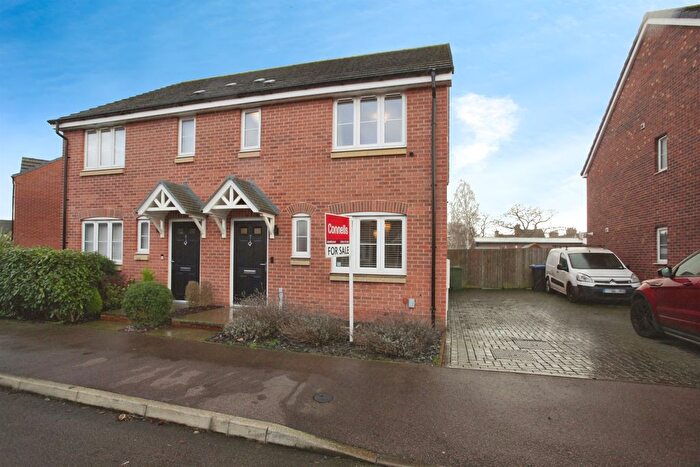
Properties for sale in Dunton
Roads and Postcodes in Dunton
Navigate through our locations to find the location of your next house in Dunton, Lutterworth for sale or to rent.
| Streets | Postcodes |
|---|---|
| Andrews Close | LE17 5ER |
| Ashby Parva Road | LE17 5JS |
| Ashby Road | LE17 5EB LE17 5PZ |
| Back Lane | LE17 5EZ |
| Bennetts Hill | LE17 5JJ |
| Broughton Lane | LE17 5HA |
| Broughton Road | LE17 5LJ |
| Bruntingthorpe Industrial Estate | LE17 5QZ |
| Chapel Close | LE17 5JW |
| Church Close | LE17 5JY |
| Church Lane | LE17 5JX LE17 5JZ |
| Coopers Lane | LE17 5LH |
| Dunton Lane | LE17 5HX |
| Dunton Road | LE17 5HD LE17 5HG LE17 5NH |
| Eaglesfield End | LE17 5FG |
| Elfin Grove | LE17 5LB |
| Elwells Avenue | LE17 5JT |
| Frolesworth Lane | LE17 5DA |
| Frolesworth Road | LE17 5HJ LE17 5HP |
| Gilmorton Lane | LE17 5NB LE17 5QR LE17 5QT |
| Gilmorton Road | LE17 5NE LE17 5NF LE17 5NA |
| Hall Lane | LE17 5ND |
| Holt Lane | LE17 5NJ |
| Hubbards Close | LE17 5NT |
| Lammas Close | LE17 5JF |
| Leire Lane | LE17 5HR LE17 5JP |
| Leire Road | LE17 5EA |
| Little Lane | LE17 5HH |
| Little Lunnon | LE17 5JR |
| Lutterworth Road | LE17 5LD LE17 5LE LE17 5LF LE17 5JU |
| Main Street | LE17 5EE LE17 5EG LE17 5EU LE17 5HE LE17 5HF LE17 5HS LE17 5HU LE17 5HY LE17 5JH LE17 5JN |
| Nursery Gardens | LE17 5LA |
| Oak Avenue | LE17 5HN |
| Old Forge Road | LE17 5NL |
| Peatling Grange | LE17 5QU |
| Peatling Parva Road | LE17 5NR |
| Peatling Road | LE17 5NN LE17 5NW |
| Peveril Road | LE17 5NG LE17 5NQ |
| Ralphs Close | LE17 5JQ |
| Simons Orchard | LE17 5JE |
| South View | LE17 5EF |
| St Margarets Drive | LE17 5HW |
| St Peters Close | LE17 5ET |
| Station Road | LE17 5LG LE17 5LQ |
| Stemborough Lane | LE17 5EX |
| The Green | LE17 5HL |
| The Mount | LE17 5JL |
| The Old Coach Road | LE17 5JG |
| The Square | LE17 5EQ |
| Ullesthorpe Road | LE17 5EN LE17 5HT |
| Wakes Close | LE17 5LL |
| Wales Orchard | LE17 5ES |
| Walton Road | LE17 5RD |
| Well Lane | LE17 5LW |
| White House Close | LE17 5HB |
| Willoughby Road | LE17 5NP |
| Woodgate Court | LE17 5SQ |
| LE17 5EJ LE17 5EL LE17 5QB LE17 5QG LE17 5QL LE17 5QN LE17 5QQ LE17 5QS LE17 5QW |
Transport near Dunton
- FAQ
- Price Paid By Year
- Property Type Price
Frequently asked questions about Dunton
What is the average price for a property for sale in Dunton?
The average price for a property for sale in Dunton is £528,263. This amount is 37% higher than the average price in Lutterworth. There are 3,576 property listings for sale in Dunton.
What streets have the most expensive properties for sale in Dunton?
The streets with the most expensive properties for sale in Dunton are Broughton Lane at an average of £945,000, Hall Lane at an average of £945,000 and Frolesworth Lane at an average of £875,000.
What streets have the most affordable properties for sale in Dunton?
The streets with the most affordable properties for sale in Dunton are Chapel Close at an average of £250,000, Bennetts Hill at an average of £255,000 and Leire Road at an average of £265,000.
Which train stations are available in or near Dunton?
Some of the train stations available in or near Dunton are Narborough, South Wigston and Hinckley.
Property Price Paid in Dunton by Year
The average sold property price by year was:
| Year | Average Sold Price | Price Change |
Sold Properties
|
|---|---|---|---|
| 2025 | £532,785 | 6% |
21 Properties |
| 2024 | £500,140 | -17% |
25 Properties |
| 2023 | £583,545 | 7% |
11 Properties |
| 2022 | £543,481 | 23% |
27 Properties |
| 2021 | £416,154 | 1% |
48 Properties |
| 2020 | £411,007 | 10% |
29 Properties |
| 2019 | £371,165 | 5% |
22 Properties |
| 2018 | £353,263 | -7% |
19 Properties |
| 2017 | £378,111 | 7% |
36 Properties |
| 2016 | £351,385 | -3% |
32 Properties |
| 2015 | £361,470 | 20% |
36 Properties |
| 2014 | £289,702 | - |
34 Properties |
| 2013 | £289,692 | -1% |
32 Properties |
| 2012 | £291,204 | -10% |
23 Properties |
| 2011 | £318,971 | 3% |
19 Properties |
| 2010 | £309,015 | 7% |
26 Properties |
| 2009 | £286,864 | -10% |
32 Properties |
| 2008 | £315,405 | -13% |
25 Properties |
| 2007 | £357,433 | 16% |
48 Properties |
| 2006 | £299,914 | 10% |
38 Properties |
| 2005 | £268,645 | 5% |
24 Properties |
| 2004 | £255,937 | -9% |
42 Properties |
| 2003 | £278,681 | 25% |
42 Properties |
| 2002 | £209,488 | 5% |
44 Properties |
| 2001 | £198,023 | 26% |
34 Properties |
| 2000 | £146,189 | -3% |
41 Properties |
| 1999 | £150,964 | 15% |
55 Properties |
| 1998 | £128,557 | 15% |
28 Properties |
| 1997 | £109,287 | 7% |
31 Properties |
| 1996 | £101,928 | 23% |
38 Properties |
| 1995 | £78,656 | - |
22 Properties |
Property Price per Property Type in Dunton
Here you can find historic sold price data in order to help with your property search.
The average Property Paid Price for specific property types in the last three years are:
| Property Type | Average Sold Price | Sold Properties |
|---|---|---|
| Semi Detached House | £374,937.00 | 16 Semi Detached Houses |
| Detached House | £598,605.00 | 38 Detached Houses |
| Terraced House | £455,000.00 | 3 Terraced Houses |

