Houses for sale & to rent in Lutterworth, Leicestershire
House Prices in Lutterworth
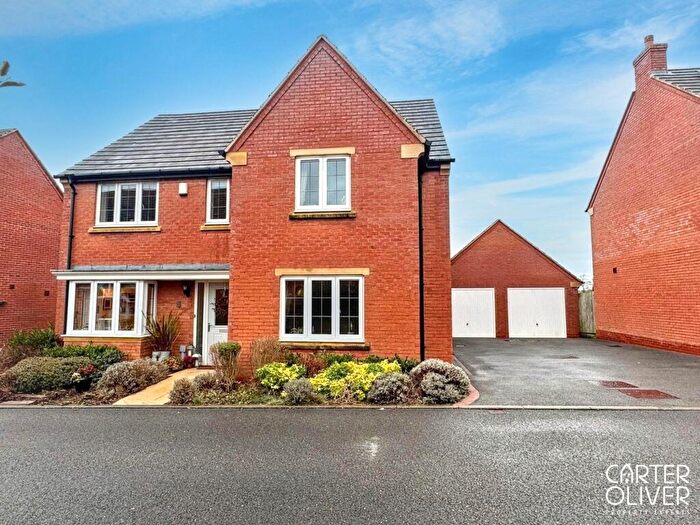
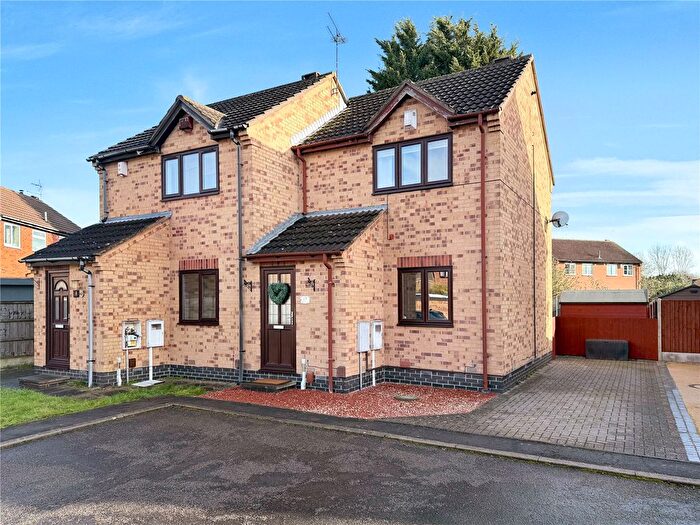
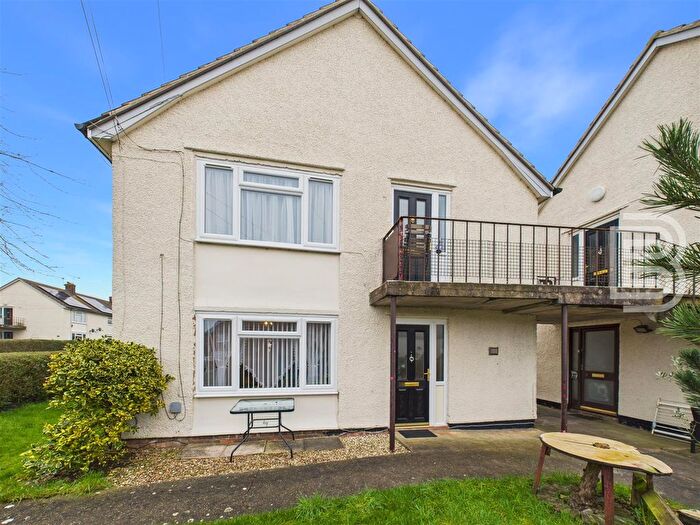
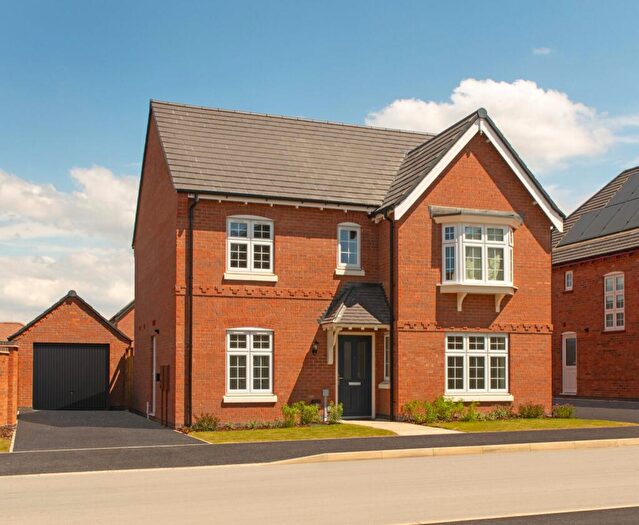
Properties in Lutterworth have an average house price of £385,786.00 and had 799 Property Transactions within the last 3 years.¹
Lutterworth is an area in Leicestershire with 8,434 households², where the most expensive property was sold for £2,000,000.00.
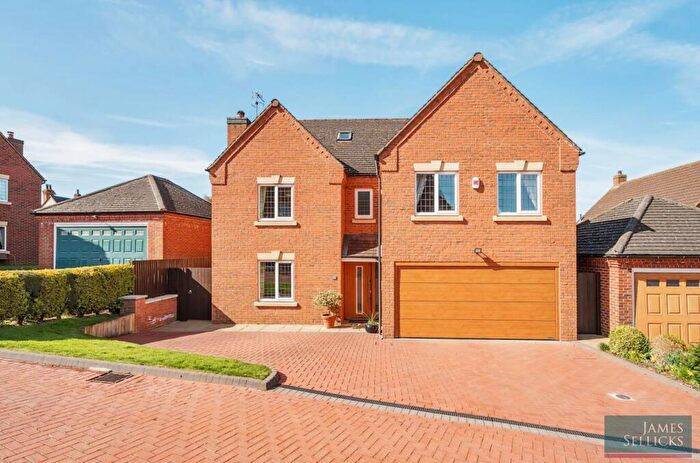
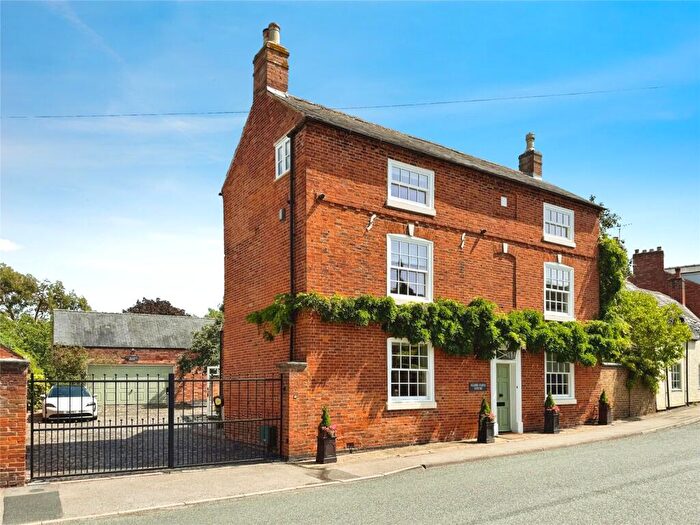
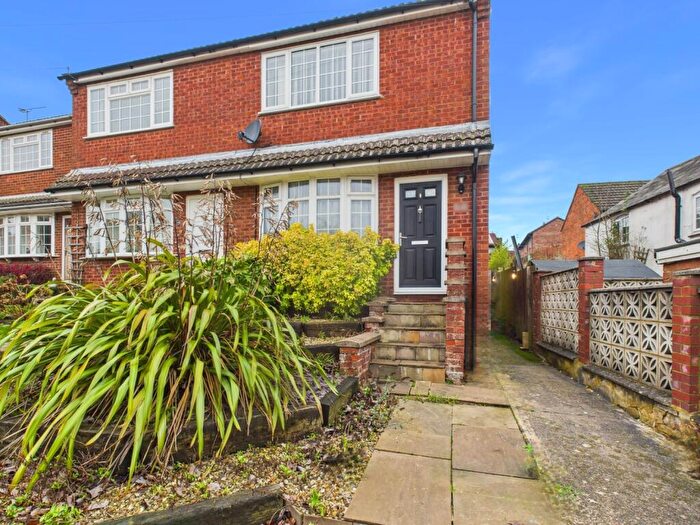
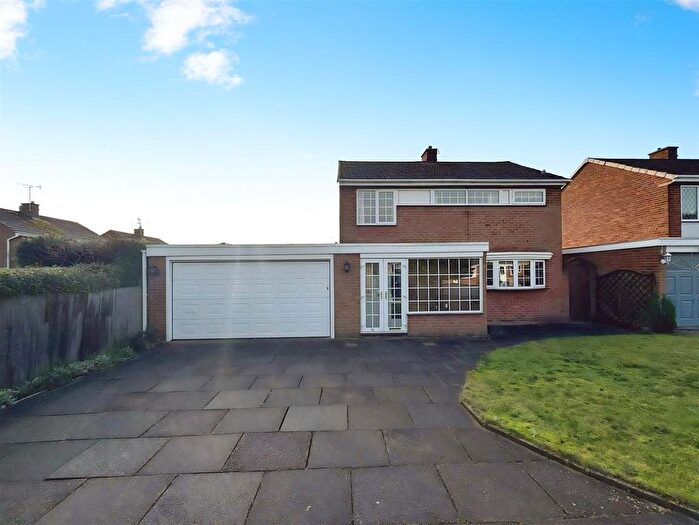
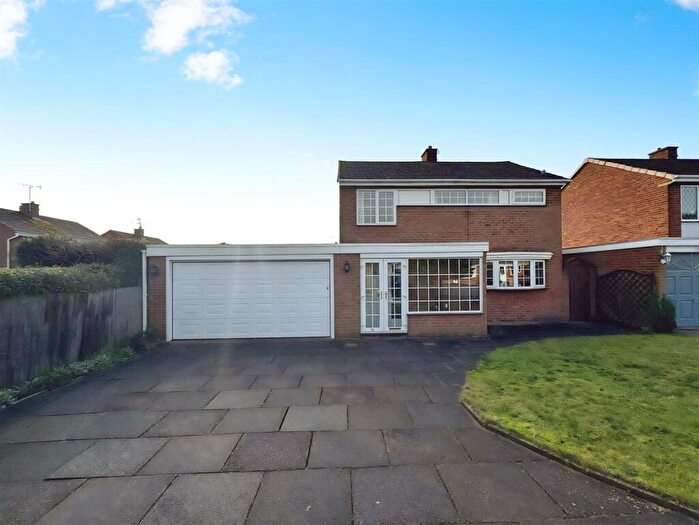
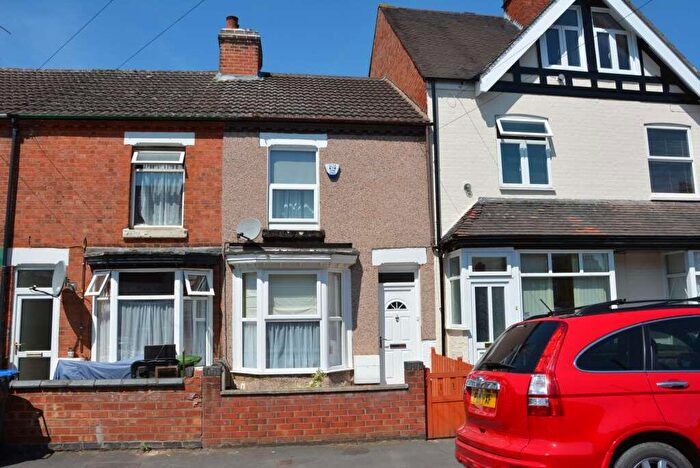
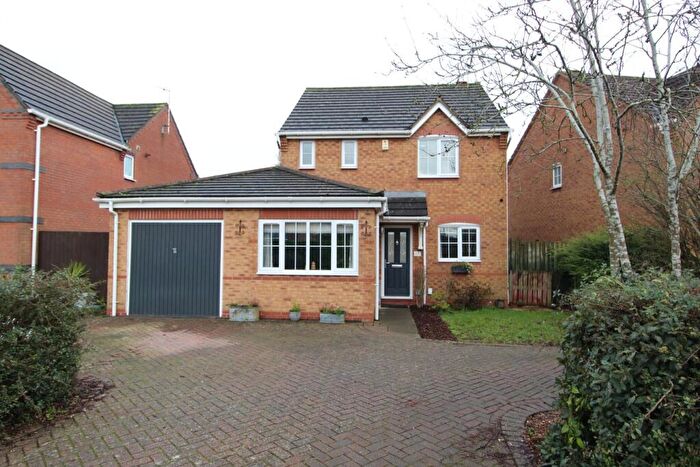
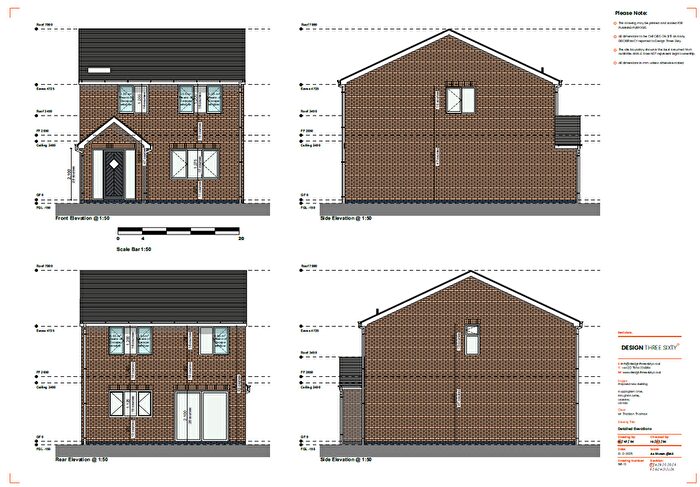
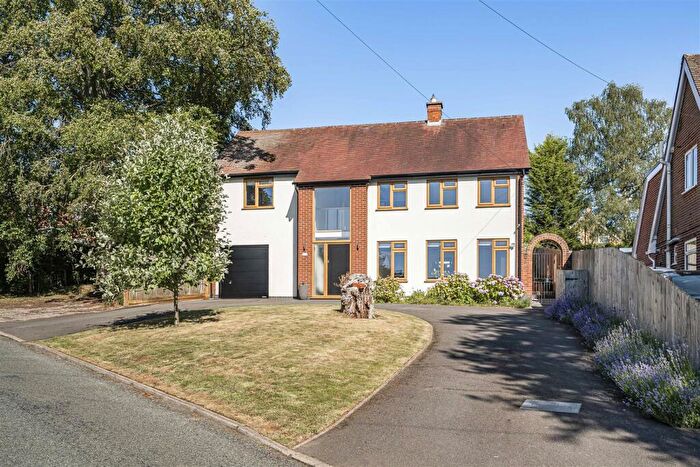
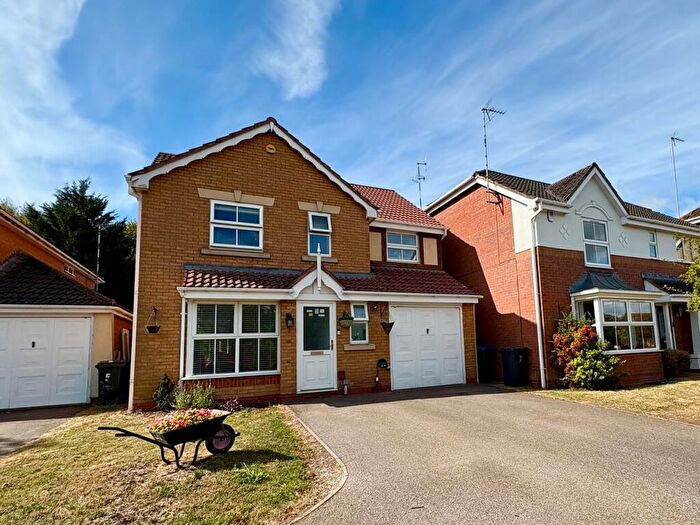
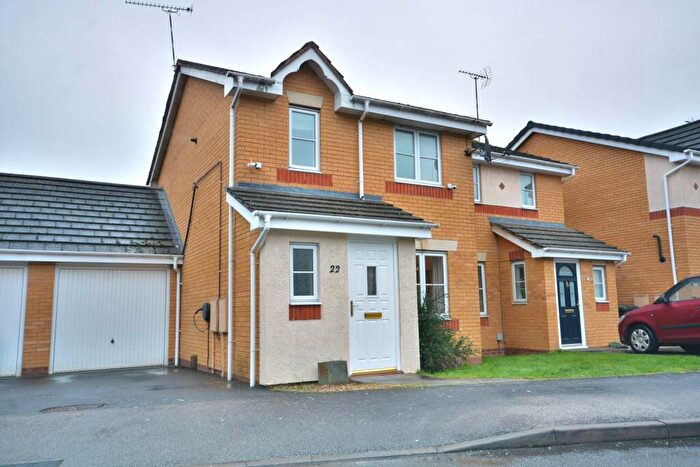
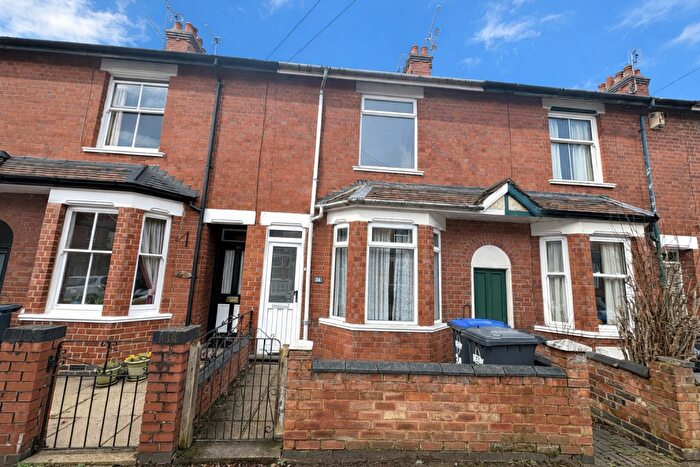
Properties for sale in Lutterworth
Neighbourhoods in Lutterworth
Navigate through our locations to find the location of your next house in Lutterworth, Leicestershire for sale or to rent.
Transport in Lutterworth
Please see below transportation links in this area:
- FAQ
- Price Paid By Year
- Property Type Price
Frequently asked questions about Lutterworth
What is the average price for a property for sale in Lutterworth?
The average price for a property for sale in Lutterworth is £385,786. This amount is 28% higher than the average price in Leicestershire. There are more than 10,000 property listings for sale in Lutterworth.
What locations have the most expensive properties for sale in Lutterworth?
The locations with the most expensive properties for sale in Lutterworth are Broughton Astley South & Leire at an average of £723,500, Peatling at an average of £559,569 and Dunton at an average of £528,263.
What locations have the most affordable properties for sale in Lutterworth?
The locations with the most affordable properties for sale in Lutterworth are Lutterworth Springs at an average of £280,443, Lutterworth Orchard at an average of £293,633 and Lutterworth West at an average of £315,100.
Which train stations are available in or near Lutterworth?
Some of the train stations available in or near Lutterworth are Rugby, Narborough and South Wigston.
Property Price Paid in Lutterworth by Year
The average sold property price by year was:
| Year | Average Sold Price | Price Change |
Sold Properties
|
|---|---|---|---|
| 2025 | £395,753 | 6% |
256 Properties |
| 2024 | £371,565 | -5% |
286 Properties |
| 2023 | £391,683 | -3% |
257 Properties |
| 2022 | £403,935 | 11% |
316 Properties |
| 2021 | £359,754 | 2% |
559 Properties |
| 2020 | £351,192 | 9% |
408 Properties |
| 2019 | £320,921 | 2% |
351 Properties |
| 2018 | £315,810 | 5% |
410 Properties |
| 2017 | £299,654 | 4% |
420 Properties |
| 2016 | £286,215 | 3% |
425 Properties |
| 2015 | £278,893 | 6% |
406 Properties |
| 2014 | £263,484 | 10% |
391 Properties |
| 2013 | £237,336 | -2% |
333 Properties |
| 2012 | £242,451 | 3% |
250 Properties |
| 2011 | £236,384 | -3% |
241 Properties |
| 2010 | £243,431 | 7% |
242 Properties |
| 2009 | £226,264 | -11% |
247 Properties |
| 2008 | £252,194 | -6% |
216 Properties |
| 2007 | £267,676 | 10% |
452 Properties |
| 2006 | £241,089 | 8% |
471 Properties |
| 2005 | £222,436 | 5% |
404 Properties |
| 2004 | £212,177 | 9% |
447 Properties |
| 2003 | £193,704 | 18% |
432 Properties |
| 2002 | £159,393 | 11% |
524 Properties |
| 2001 | £141,219 | 14% |
564 Properties |
| 2000 | £121,777 | 9% |
501 Properties |
| 1999 | £110,630 | 10% |
564 Properties |
| 1998 | £99,880 | 12% |
397 Properties |
| 1997 | £87,746 | 10% |
397 Properties |
| 1996 | £78,751 | 5% |
353 Properties |
| 1995 | £74,836 | - |
297 Properties |
Property Price per Property Type in Lutterworth
Here you can find historic sold price data in order to help with your property search.
The average Property Paid Price for specific property types in the last three years are:
| Property Type | Average Sold Price | Sold Properties |
|---|---|---|
| Semi Detached House | £284,589.00 | 241 Semi Detached Houses |
| Detached House | £489,048.00 | 421 Detached Houses |
| Terraced House | £249,757.00 | 127 Terraced Houses |
| Flat | £204,834.00 | 10 Flats |

