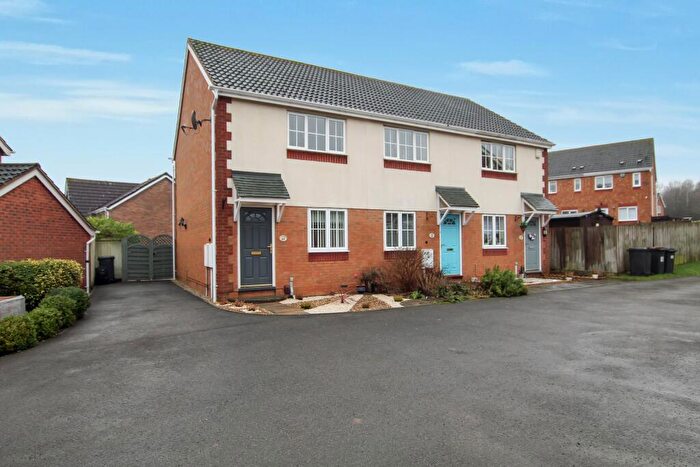
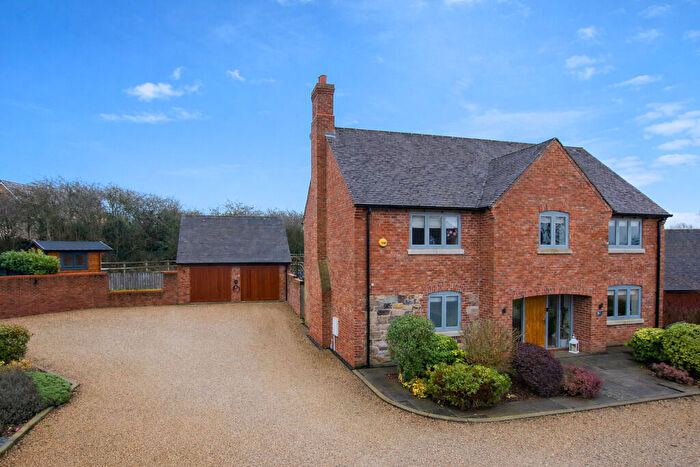
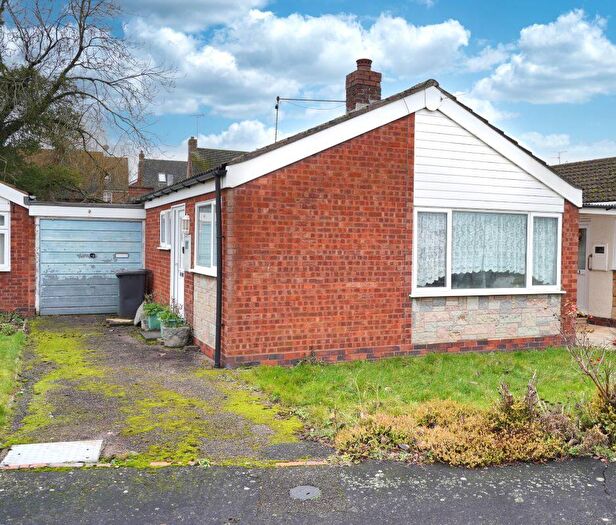
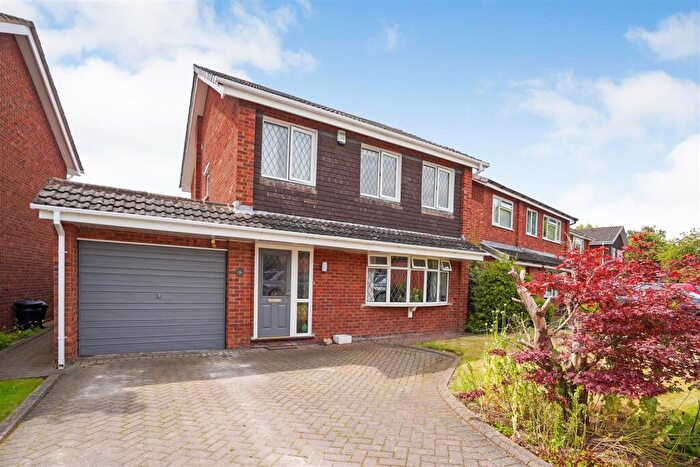
Houses for sale & to rent in Appleby, Swadlincote
House Prices in Appleby
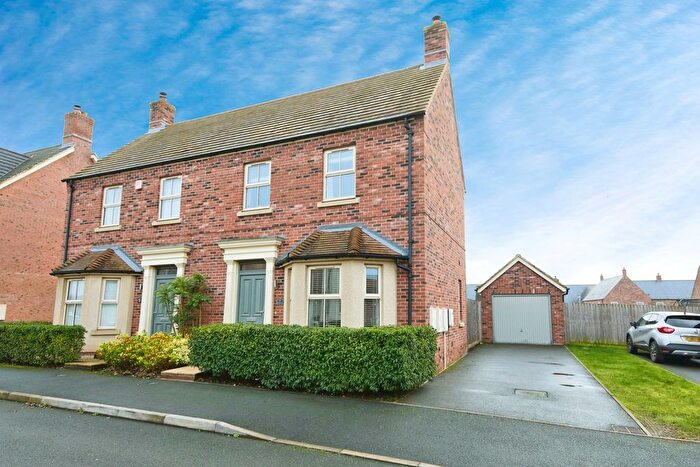
Properties in Appleby have an average house price of £452,327.00 and had 64 Property Transactions within the last 3 years¹.
Appleby is an area in Swadlincote, Leicestershire with 654 households², where the most expensive property was sold for £1,151,111.00.
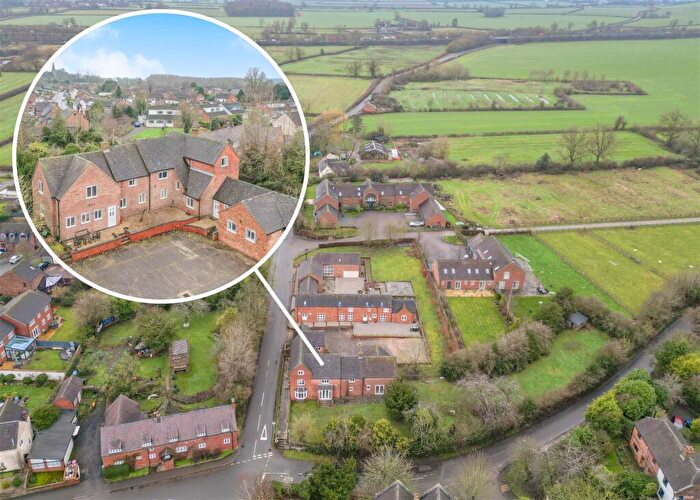
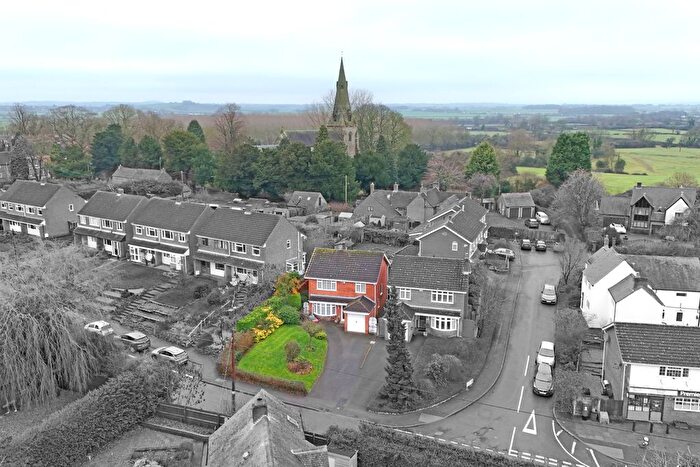
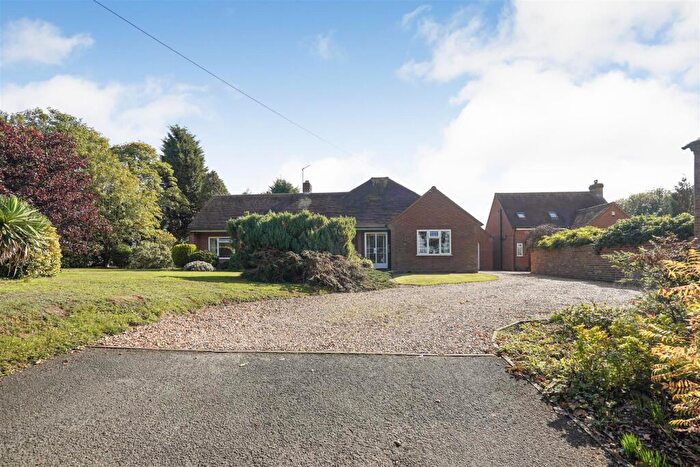
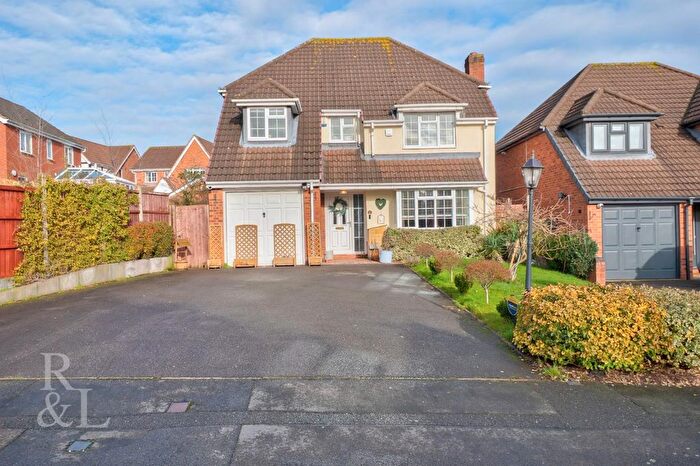
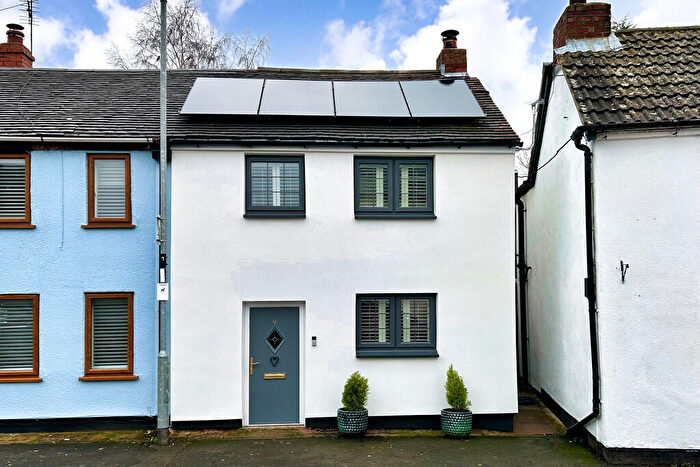
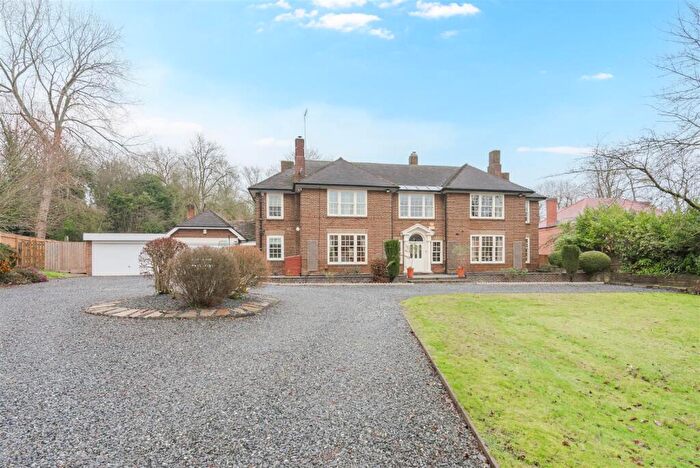
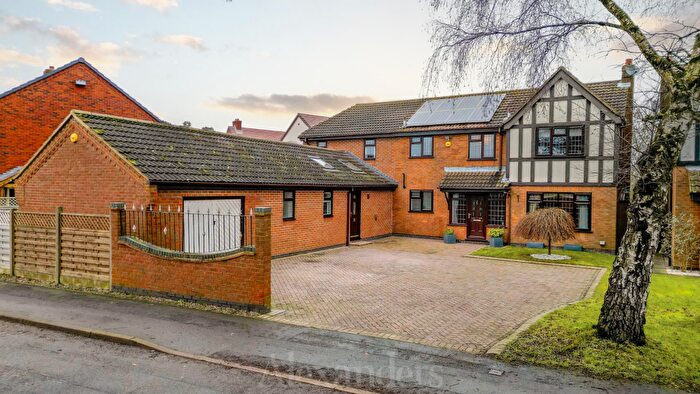
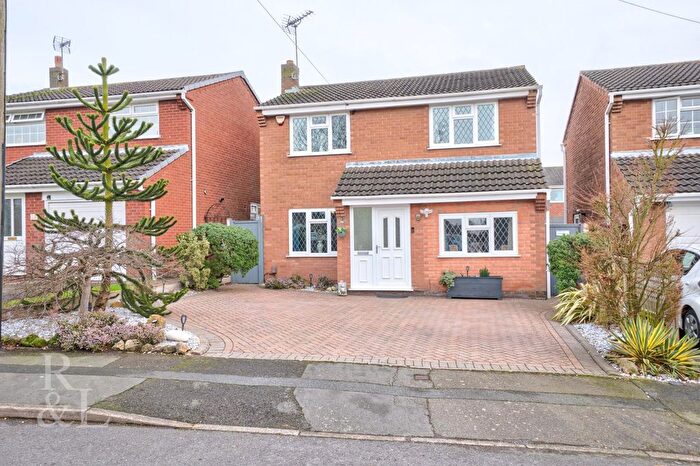
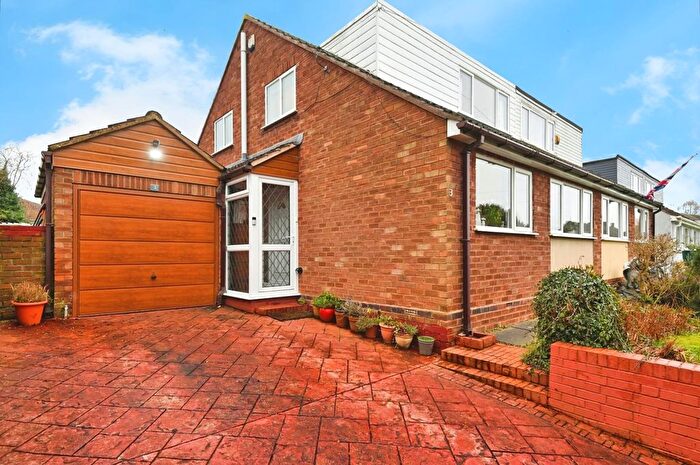
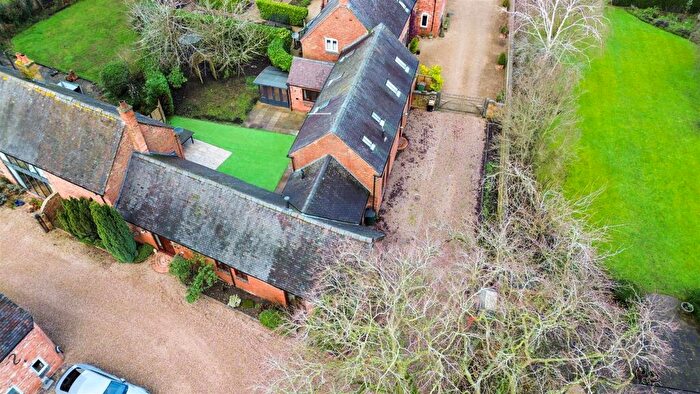
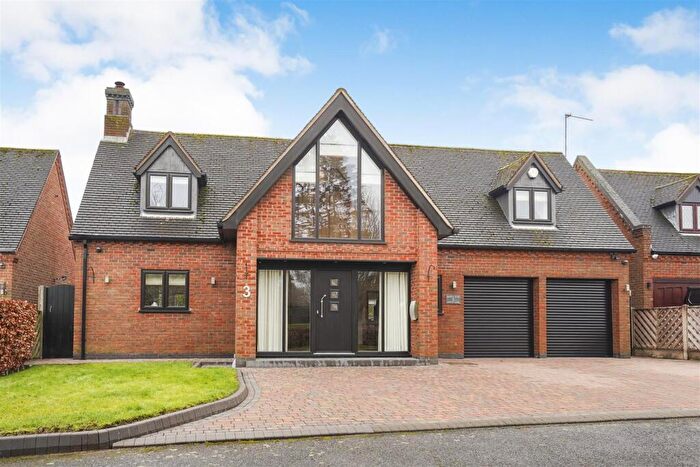
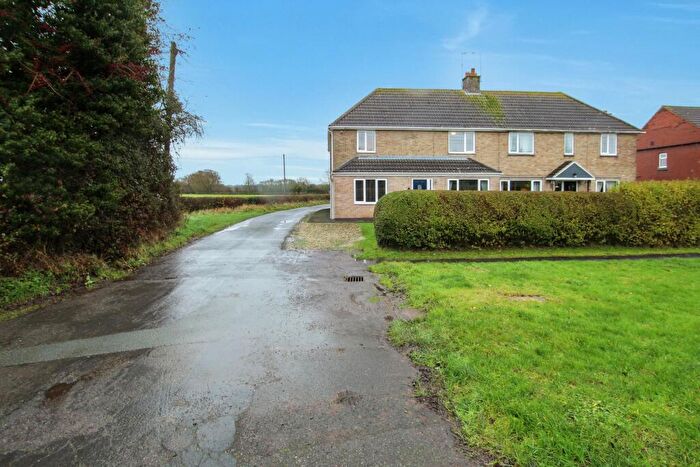
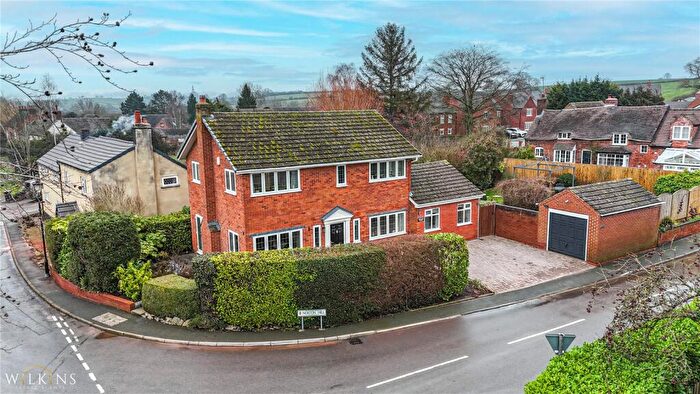
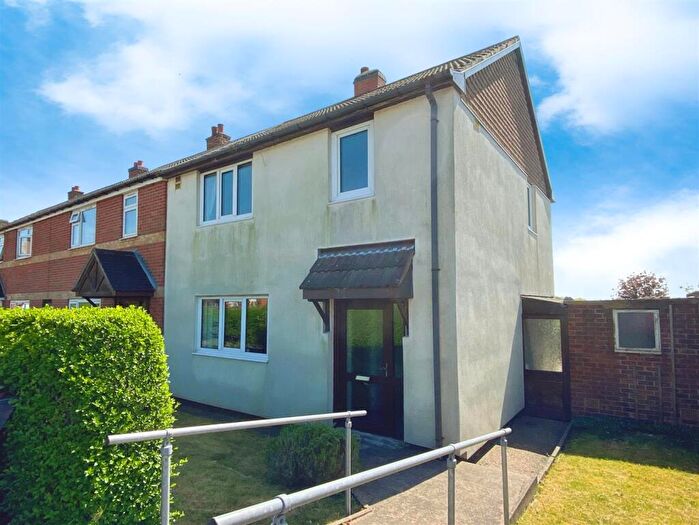
Properties for sale in Appleby
Roads and Postcodes in Appleby
Navigate through our locations to find the location of your next house in Appleby, Swadlincote for sale or to rent.
| Streets | Postcodes |
|---|---|
| Appleby Fields Close | DE12 7BF |
| Appleby Lane | DE12 7BZ |
| Atherstone Road | DE12 7AP |
| Austrey Lane | DE12 7AR |
| Blackhorse Hill | DE12 7AQ |
| Botts Lane | DE12 7AL |
| Bowleys Lane | DE12 7BE |
| Burton Road | DE12 8AU |
| Church Lane | DE12 8DL |
| Church Street | DE12 7BB DE12 7AN |
| Constantine Court | DE12 7FJ |
| Didcott Way | DE12 7AS |
| Duck Lake | DE12 7AD |
| Farriers Close | DE12 7BS |
| Garton Close | DE12 7AU |
| Glade Close | DE12 7DL |
| Hillside | DE12 7AB |
| Hilltop Cottage | DE12 8AA |
| Iris Close | DE12 7DP |
| Main Street | DE12 7DB |
| Mawbys Lane | DE12 7AA |
| Meadowbrook Court | DE12 7AX |
| Measham Road | DE12 7BN DE12 7DA |
| Mercia Park | DE12 8AN DE12 8BA |
| Moore Close | DE12 7AT |
| Netherseal Road | DE12 8DQ DE12 8DU |
| New Road | DE12 7AW |
| No Man's Heath Road | DE12 8DJ DE12 8DS |
| Occupation Lane | DE12 7FL |
| Old End | DE12 7AG |
| Parkfield Crescent | DE12 7BW |
| Quarry Berry Lane | DE12 8DN |
| Quarry Lane | DE12 7DD |
| Rectory Lane | DE12 7BQ DE12 8AF |
| Snarestone Road | DE12 7AJ |
| St Helens Lane | DE12 7DF |
| St Michaels Drive | DE12 7AE DE12 7BG |
| Steeple View Lane | DE12 7DH |
| Stoney Lane | DE12 7AF |
| Stretton-en-le-field | DE12 8AB DE12 8AD |
| Sunset Close | DE12 7DJ |
| Swepstone Road | DE12 7DG DE12 7HS |
| Tamworth Road | DE12 7BH DE12 7BJ DE12 7DU DE12 7DX DE12 7FH |
| Top Street | DE12 7AH |
| Twycross Road | DE12 7BY |
| Valley Farm Cottages | DE12 7DQ |
| Woodland View | DE12 8DP |
| Wren Close | DE12 7BD |
| DE12 8DH DE12 7BL DE12 7FF DE12 8DT |
Transport near Appleby
-
Polesworth Station
-
Tamworth Low Level Station
-
Atherstone Station
-
Wilnecote Station
-
Burton-On-Trent Station
- FAQ
- Price Paid By Year
- Property Type Price
Frequently asked questions about Appleby
What is the average price for a property for sale in Appleby?
The average price for a property for sale in Appleby is £452,327. This amount is 61% higher than the average price in Swadlincote. There are 1,438 property listings for sale in Appleby.
What streets have the most expensive properties for sale in Appleby?
The streets with the most expensive properties for sale in Appleby are Snarestone Road at an average of £790,000, Valley Farm Cottages at an average of £770,000 and Bowleys Lane at an average of £745,000.
What streets have the most affordable properties for sale in Appleby?
The streets with the most affordable properties for sale in Appleby are Parkfield Crescent at an average of £244,750, Hillside at an average of £274,250 and St Helens Lane at an average of £292,891.
Which train stations are available in or near Appleby?
Some of the train stations available in or near Appleby are Polesworth, Tamworth Low Level and Atherstone.
Property Price Paid in Appleby by Year
The average sold property price by year was:
| Year | Average Sold Price | Price Change |
Sold Properties
|
|---|---|---|---|
| 2025 | £448,129 | -3% |
24 Properties |
| 2024 | £462,479 | 3% |
21 Properties |
| 2023 | £446,407 | 4% |
19 Properties |
| 2022 | £427,622 | 9% |
24 Properties |
| 2021 | £387,023 | -3% |
30 Properties |
| 2020 | £398,346 | 7% |
32 Properties |
| 2019 | £368,961 | 19% |
34 Properties |
| 2018 | £300,446 | -7% |
40 Properties |
| 2017 | £320,191 | 22% |
69 Properties |
| 2016 | £250,270 | -43% |
28 Properties |
| 2015 | £358,426 | 16% |
35 Properties |
| 2014 | £302,040 | 20% |
25 Properties |
| 2013 | £242,382 | -42% |
17 Properties |
| 2012 | £344,846 | 20% |
13 Properties |
| 2011 | £277,188 | -4% |
17 Properties |
| 2010 | £287,150 | 3% |
10 Properties |
| 2009 | £279,325 | -2% |
18 Properties |
| 2008 | £284,716 | -5% |
15 Properties |
| 2007 | £297,557 | -1% |
24 Properties |
| 2006 | £301,301 | 11% |
28 Properties |
| 2005 | £267,696 | -9% |
27 Properties |
| 2004 | £291,351 | 33% |
29 Properties |
| 2003 | £195,418 | -13% |
29 Properties |
| 2002 | £220,368 | 30% |
40 Properties |
| 2001 | £153,724 | 4% |
29 Properties |
| 2000 | £147,831 | -0,3% |
32 Properties |
| 1999 | £148,201 | 20% |
30 Properties |
| 1998 | £118,750 | 2% |
21 Properties |
| 1997 | £116,135 | 2% |
36 Properties |
| 1996 | £113,278 | 20% |
42 Properties |
| 1995 | £91,078 | - |
16 Properties |
Property Price per Property Type in Appleby
Here you can find historic sold price data in order to help with your property search.
The average Property Paid Price for specific property types in the last three years are:
| Property Type | Average Sold Price | Sold Properties |
|---|---|---|
| Semi Detached House | £274,351.00 | 13 Semi Detached Houses |
| Detached House | £539,667.00 | 44 Detached Houses |
| Terraced House | £233,857.00 | 7 Terraced Houses |

