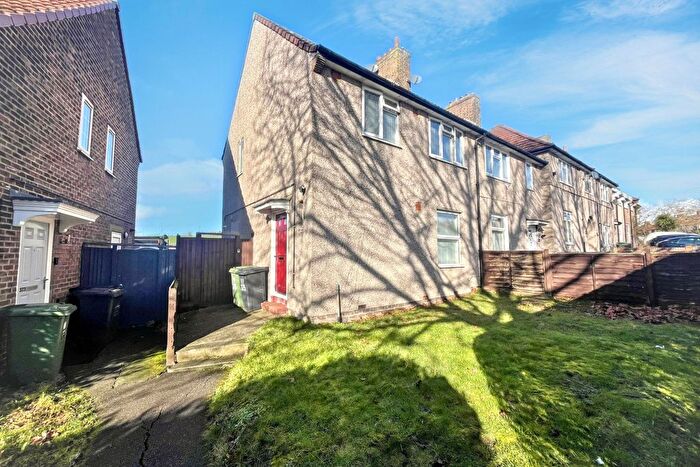
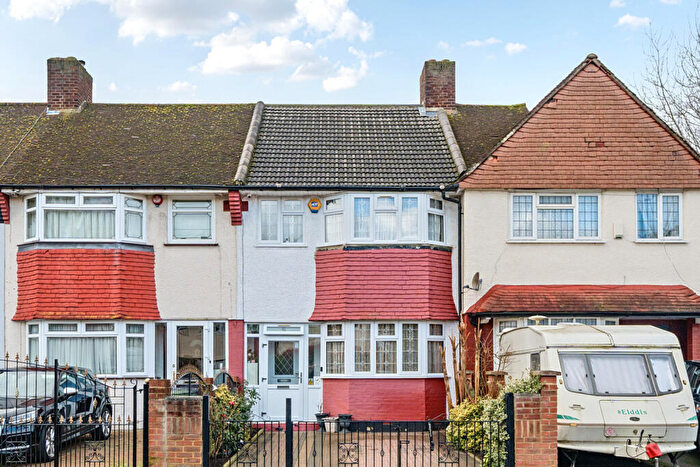
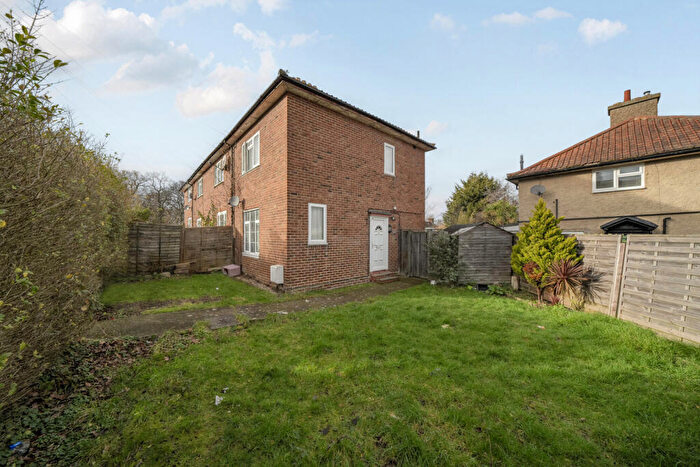
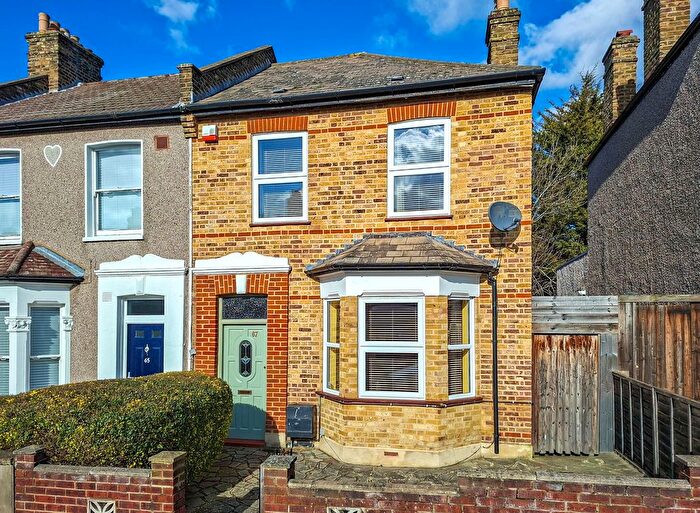
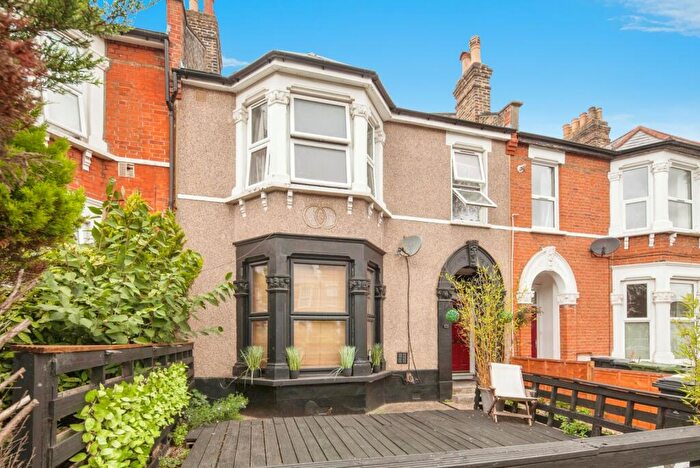
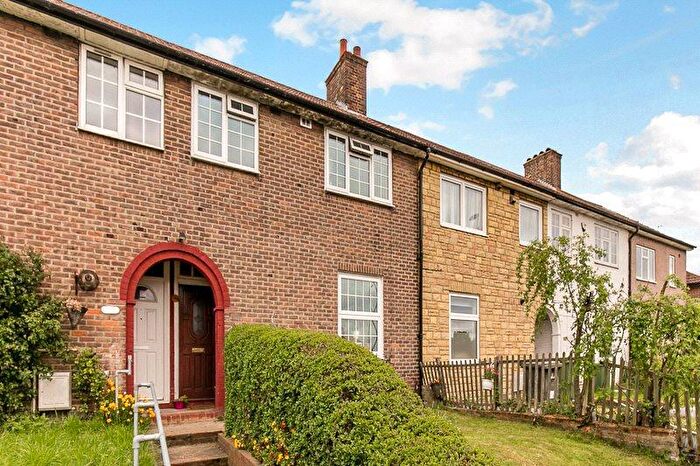
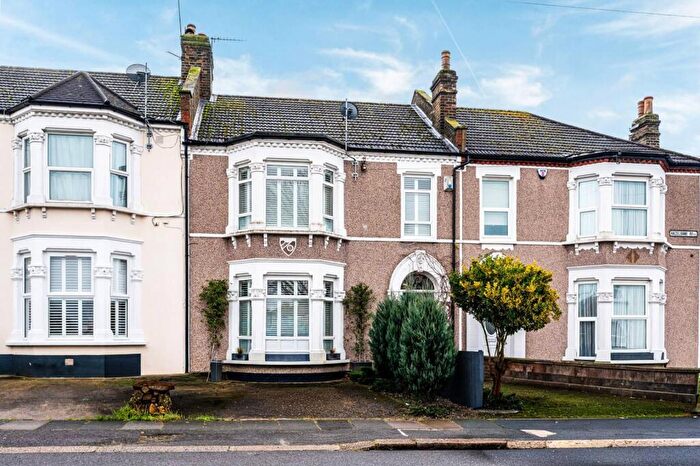
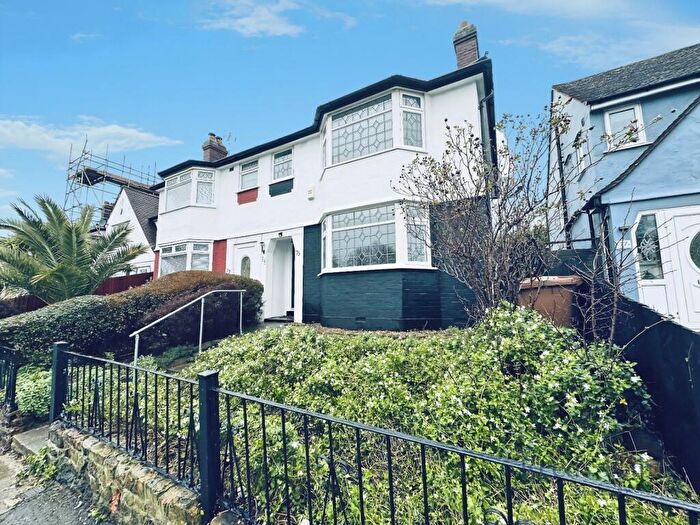
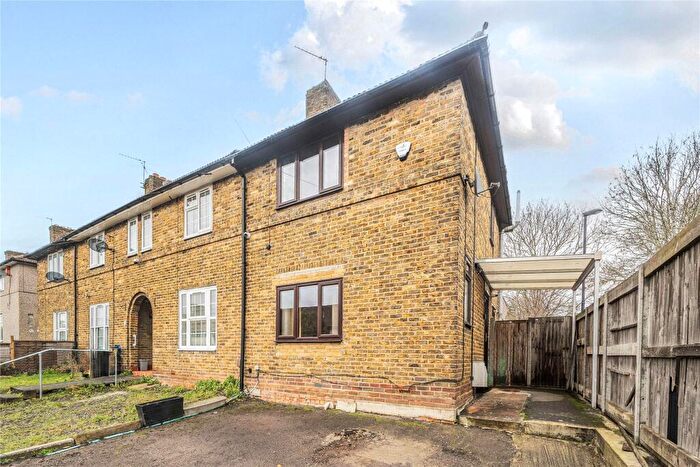
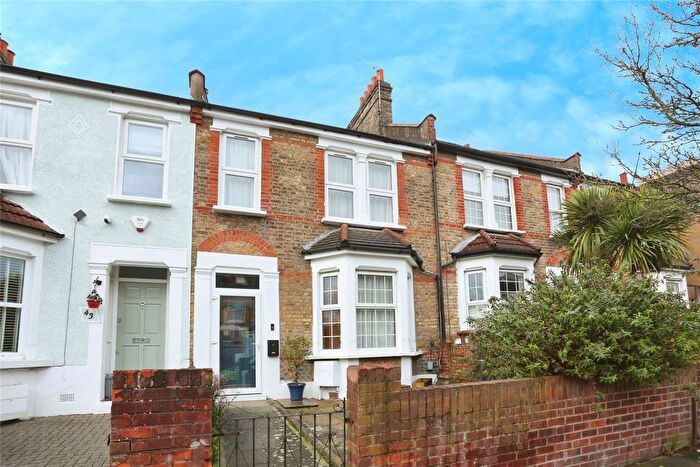
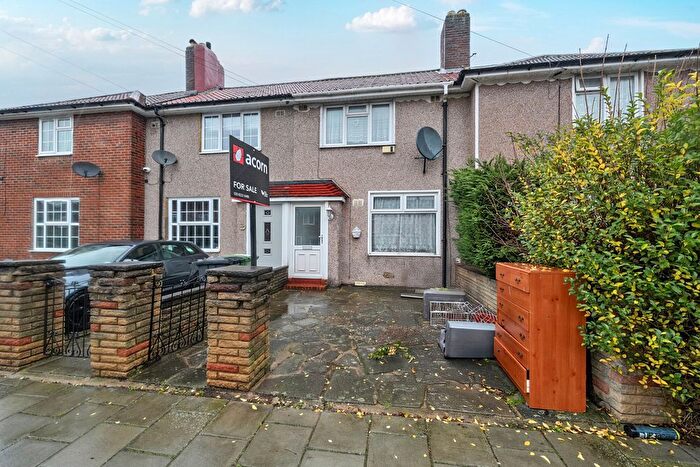
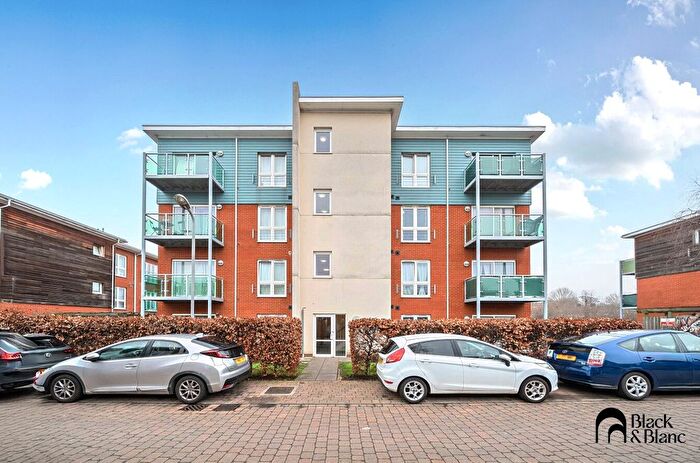
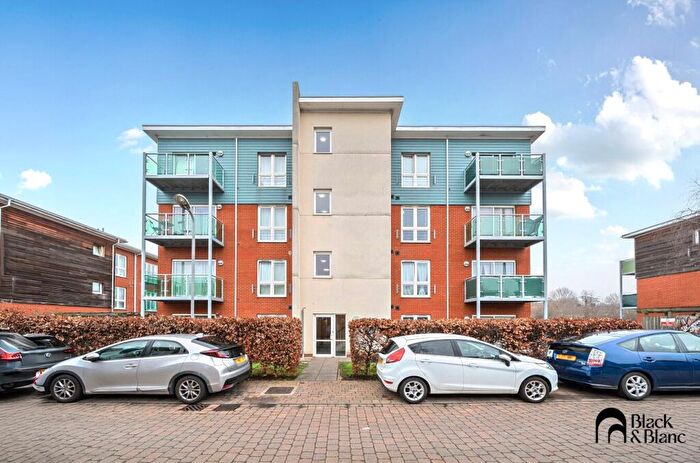
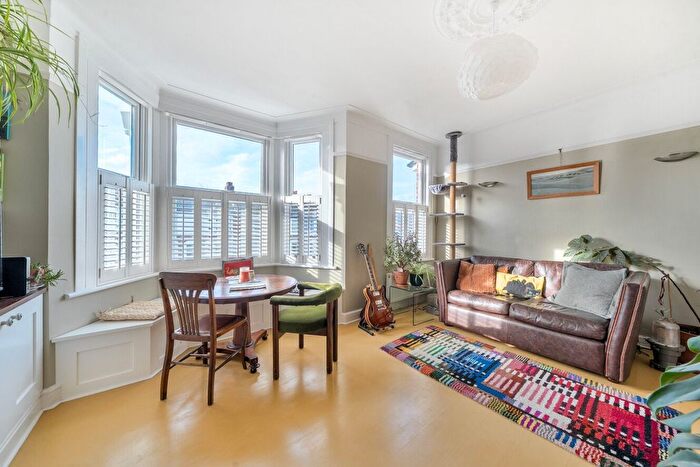
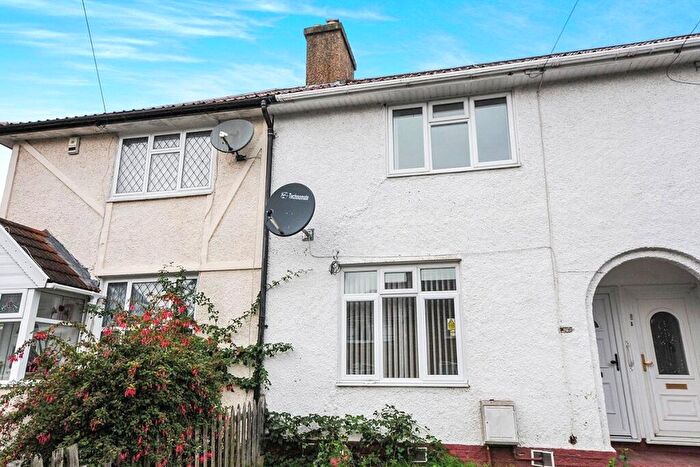
Houses for sale & to rent in Whitefoot, Bromley
House Prices in Whitefoot
Properties in this part of Whitefoot within Bromley have an average house price of £424,358.00 and had 120 Property Transactions within the last 3 years¹. This area has 2,281 households² , where the most expensive property was sold for £667,000.00.
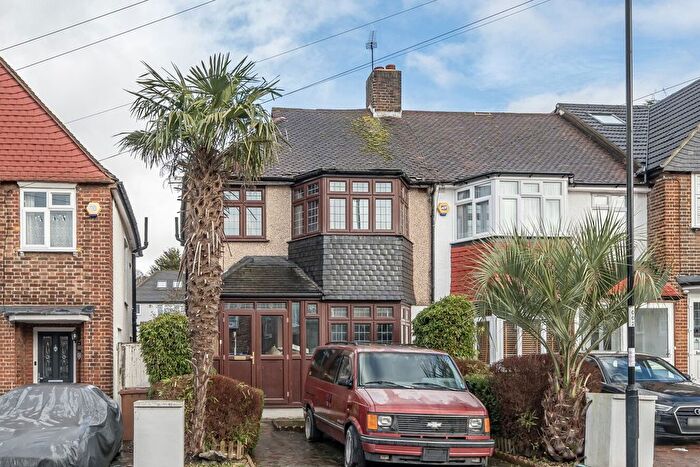
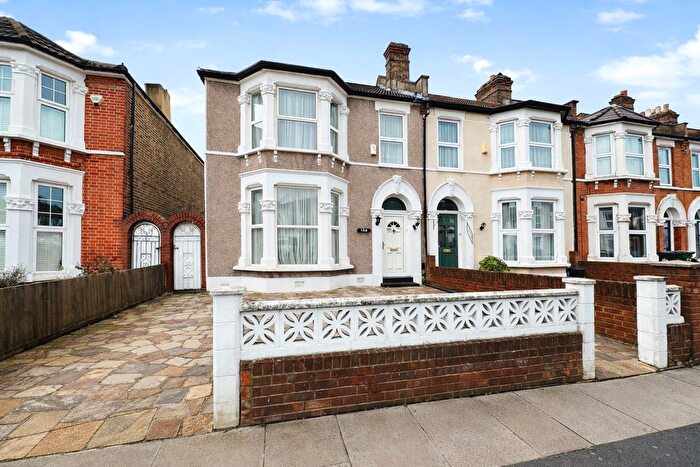
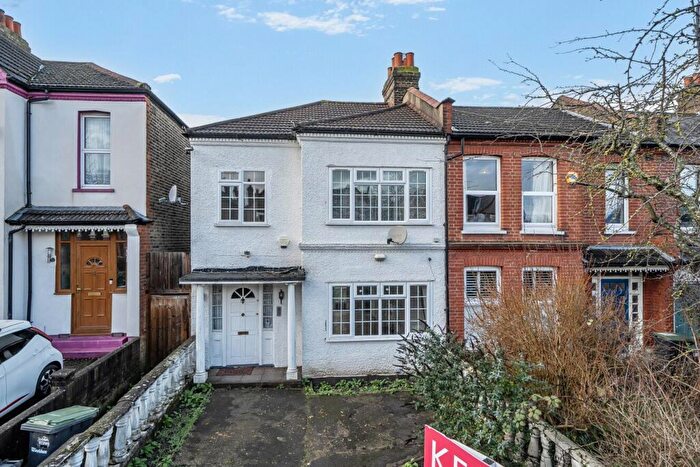
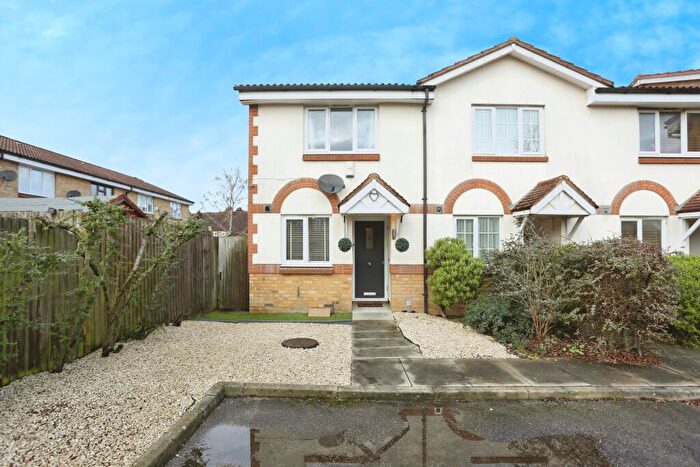
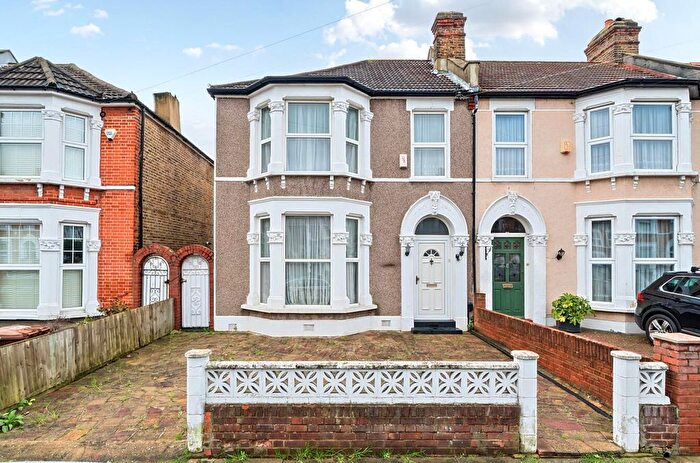
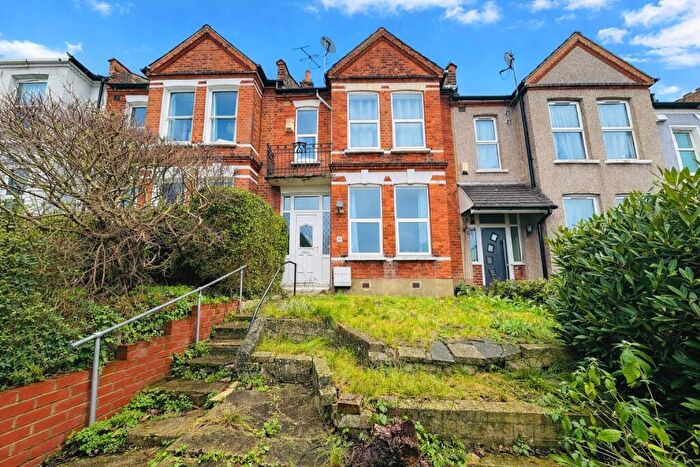
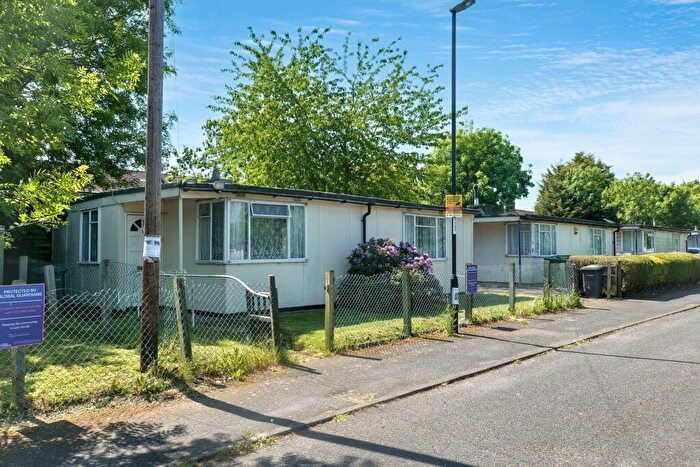
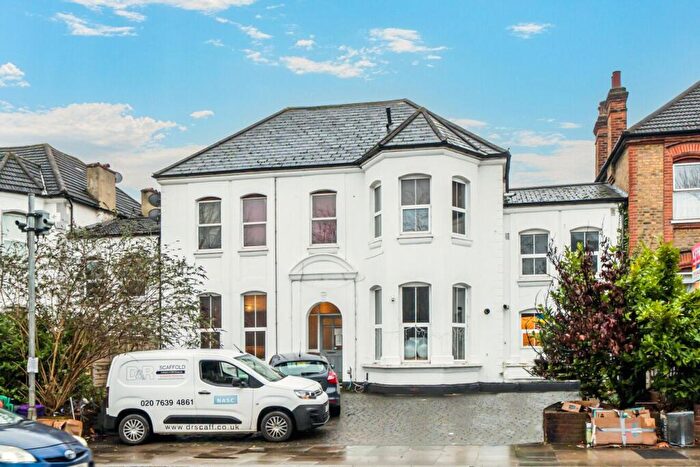
Properties for sale in Whitefoot
Roads and Postcodes in Whitefoot
Navigate through our locations to find the location of your next house in Whitefoot, Bromley for sale or to rent.
| Streets | Postcodes |
|---|---|
| Ballamore Road | BR1 5LL |
| Beachborough Road | BR1 5RL |
| Bedivere Road | BR1 5LJ |
| Bideford Road | BR1 5HD |
| Brockman Rise | BR1 5RA BR1 5RB BR1 5RE BR1 5RF |
| Bromley Road | BR1 5RU |
| Cotton Hill | BR1 5RP BR1 5RR BR1 5RS BR1 5RT |
| Cranmore Road | BR1 5EU |
| Dagonet Road | BR1 5LR |
| Downderry Road | BR1 5QE |
| Haddington Road | BR1 5RG BR1 5RH BR1 5RQ |
| Ilfracombe Road | BR1 5HB |
| Jennifer Road | BR1 5LP |
| Lentmead Road | BR1 5HL |
| Lincombe Road | BR1 5HJ |
| Moorside Road | BR1 5EY BR1 5EZ |
| Northover | BR1 5JU BR1 5JX |
| Oakshade Road | BR1 5QB BR1 5QD |
| Oldstead Road | BR1 5GN BR1 5RJ BR1 5RN BR1 5RW |
| Pendragon Road | BR1 5JY BR1 5JZ BR1 5LD BR1 5LH |
| Reigate Road | BR1 5JJ BR1 5JL BR1 5JN BR1 5JW BR1 5HT |
| Roundtable Road | BR1 5LE BR1 5LF BR1 5LG BR1 5LQ |
| Shaw Path | BR1 5NP |
| Shaw Road | BR1 5NN BR1 5NW |
| Shroffold Road | BR1 5JG BR1 5JQ BR1 5NH |
| Southview Road | BR1 5RD |
| Undershaw Road | BR1 5EX |
| Whitefoot Lane | BR1 5SA BR1 5SB BR1 5SD BR1 5SE BR1 5SF BR1 5SG BR1 5SJ BR1 5SQ BR1 5FD |
| Whitefoot Terrace | BR1 5SH |
| Winlaton Road | BR1 5PU BR1 5PX BR1 5PY BR1 5PZ BR1 5QA |
| Woodbank Road | BR1 5HH |
Transport near Whitefoot
-
Grove Park Station
-
Beckenham Hill Station
-
Bellingham Station
-
Ravensbourne Station
-
Lee Station
-
Sundridge Park Station
-
Hither Green Station
-
Catford Bridge Station
-
Catford Station
-
Bromley North Station
- FAQ
- Price Paid By Year
- Property Type Price
Frequently asked questions about Whitefoot
What is the average price for a property for sale in Whitefoot?
The average price for a property for sale in Whitefoot is £424,358. This amount is 7% higher than the average price in Bromley. There are 2,146 property listings for sale in Whitefoot.
What streets have the most expensive properties for sale in Whitefoot?
The streets with the most expensive properties for sale in Whitefoot are Oakshade Road at an average of £541,666, Oldstead Road at an average of £526,500 and Cotton Hill at an average of £509,333.
What streets have the most affordable properties for sale in Whitefoot?
The streets with the most affordable properties for sale in Whitefoot are Bedivere Road at an average of £339,166, Whitefoot Terrace at an average of £354,600 and Ballamore Road at an average of £359,000.
Which train stations are available in or near Whitefoot?
Some of the train stations available in or near Whitefoot are Grove Park, Beckenham Hill and Bellingham.
Property Price Paid in Whitefoot by Year
The average sold property price by year was:
| Year | Average Sold Price | Price Change |
Sold Properties
|
|---|---|---|---|
| 2025 | £425,100 | 1% |
35 Properties |
| 2024 | £421,292 | -1% |
41 Properties |
| 2023 | £426,625 | 1% |
44 Properties |
| 2022 | £423,586 | 10% |
59 Properties |
| 2021 | £381,108 | 3% |
70 Properties |
| 2020 | £370,766 | 4% |
48 Properties |
| 2019 | £354,537 | 6% |
53 Properties |
| 2018 | £333,719 | -3% |
53 Properties |
| 2017 | £344,046 | 1% |
54 Properties |
| 2016 | £340,429 | 11% |
65 Properties |
| 2015 | £302,837 | 15% |
85 Properties |
| 2014 | £257,151 | 14% |
71 Properties |
| 2013 | £220,844 | 3% |
59 Properties |
| 2012 | £214,061 | 7% |
40 Properties |
| 2011 | £199,588 | 4% |
45 Properties |
| 2010 | £191,425 | 3% |
41 Properties |
| 2009 | £186,061 | -15% |
49 Properties |
| 2008 | £214,858 | 1% |
39 Properties |
| 2007 | £212,959 | 9% |
133 Properties |
| 2006 | £193,605 | 7% |
111 Properties |
| 2005 | £180,849 | 1% |
85 Properties |
| 2004 | £178,138 | 6% |
117 Properties |
| 2003 | £168,148 | 18% |
103 Properties |
| 2002 | £137,976 | 10% |
152 Properties |
| 2001 | £124,445 | 13% |
123 Properties |
| 2000 | £107,937 | 18% |
73 Properties |
| 1999 | £88,444 | 12% |
94 Properties |
| 1998 | £78,049 | 14% |
65 Properties |
| 1997 | £67,459 | 8% |
88 Properties |
| 1996 | £61,931 | 4% |
77 Properties |
| 1995 | £59,633 | - |
60 Properties |
Property Price per Property Type in Whitefoot
Here you can find historic sold price data in order to help with your property search.
The average Property Paid Price for specific property types in the last three years are:
| Property Type | Average Sold Price | Sold Properties |
|---|---|---|
| Semi Detached House | £502,833.00 | 24 Semi Detached Houses |
| Detached House | £380,000.00 | 1 Detached House |
| Terraced House | £416,379.00 | 87 Terraced Houses |
| Flat | £281,250.00 | 8 Flats |

