
Houses for sale & to rent in Grove Park, London
House Prices in Grove Park
Properties in this part of Grove Park within London have an average house price of £438,130.00 and had 426 Property Transactions within the last 3 years¹. This area has 6,187 households² , where the most expensive property was sold for £1,800,000.00.
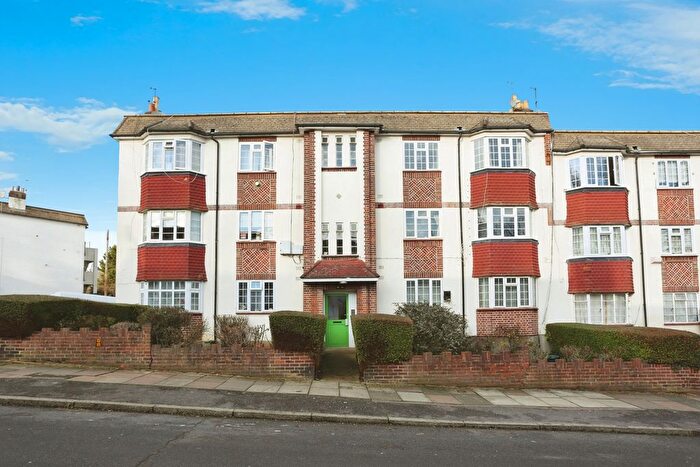
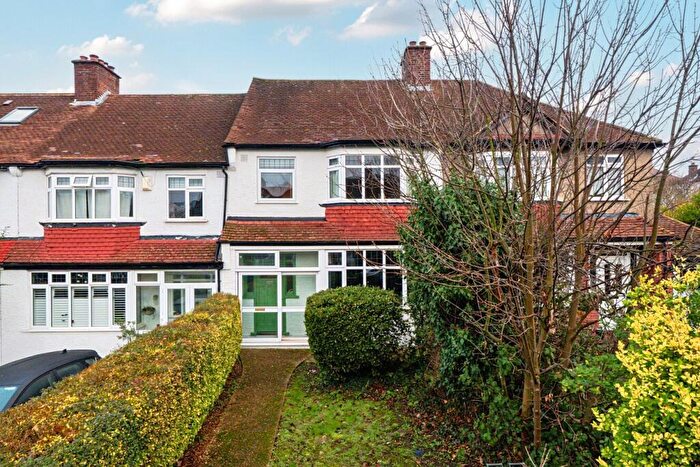
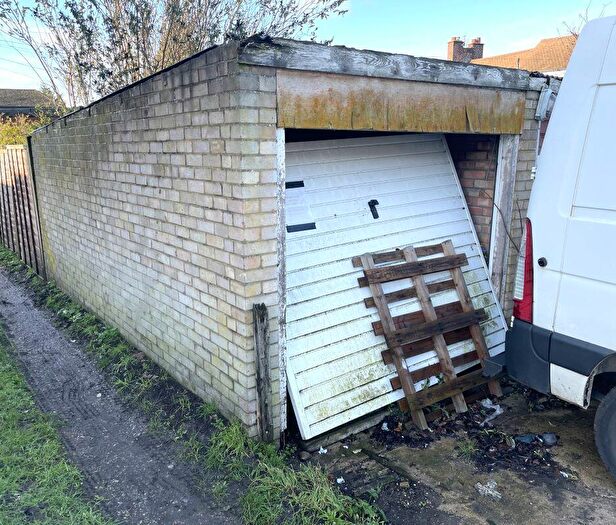
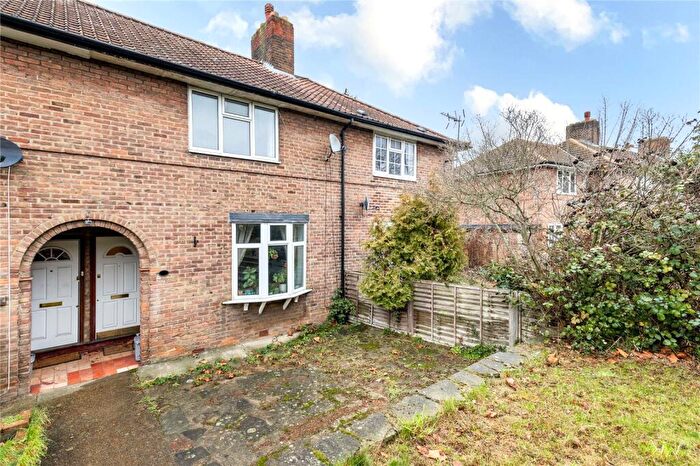
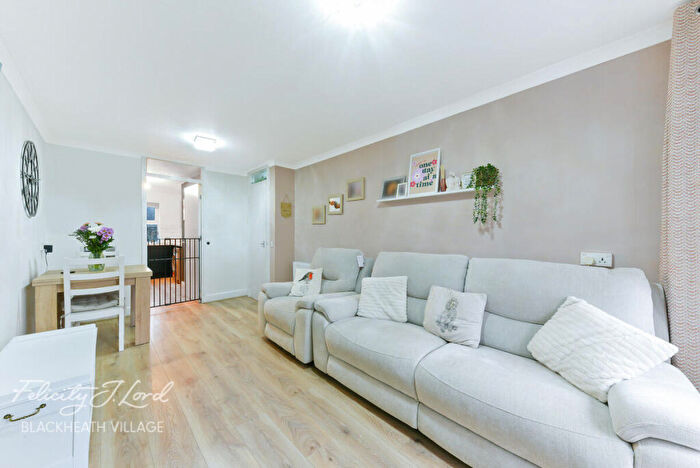
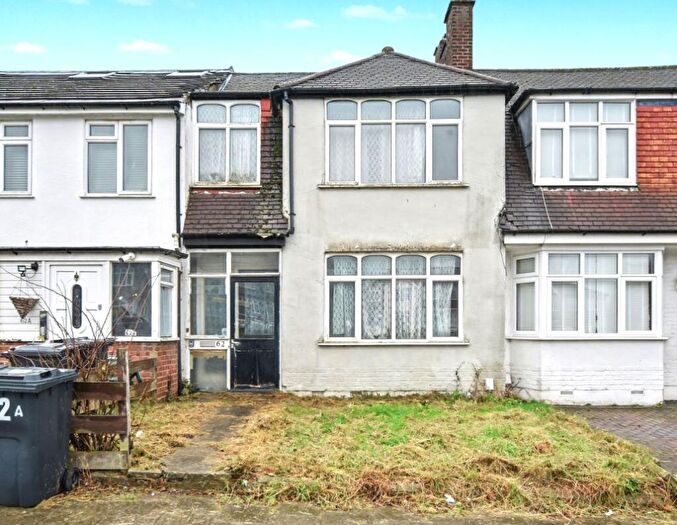
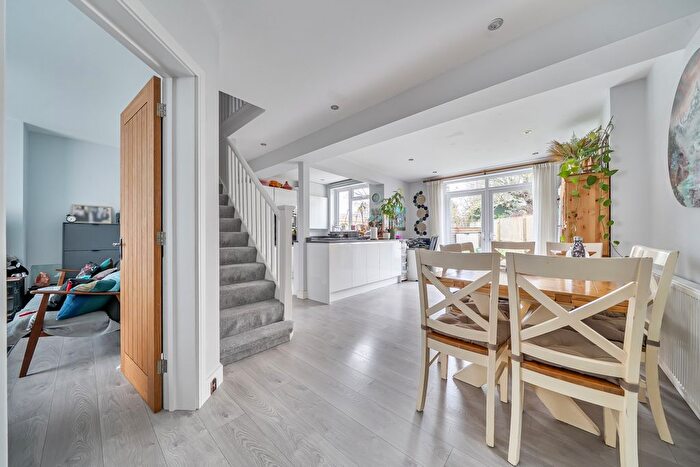
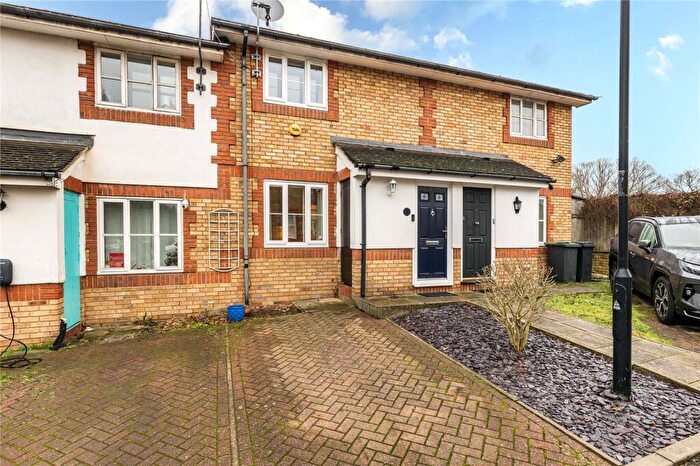
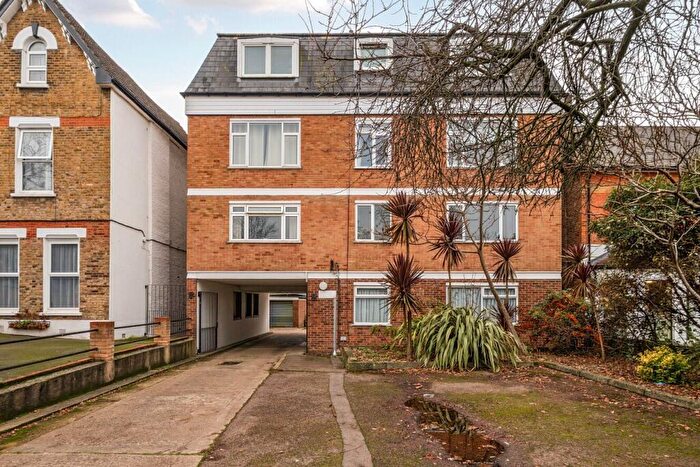
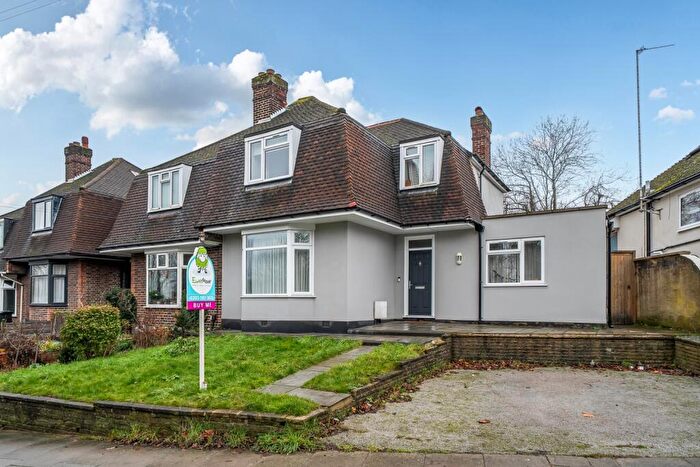
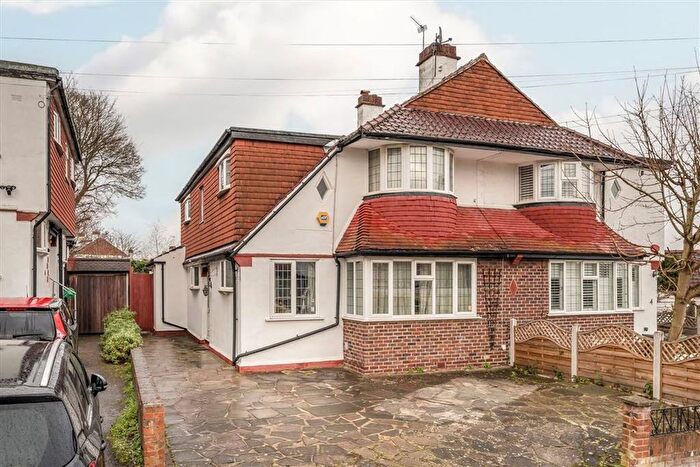
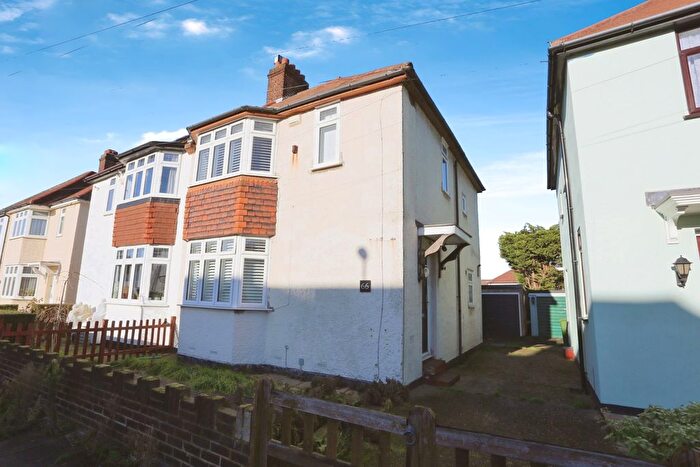
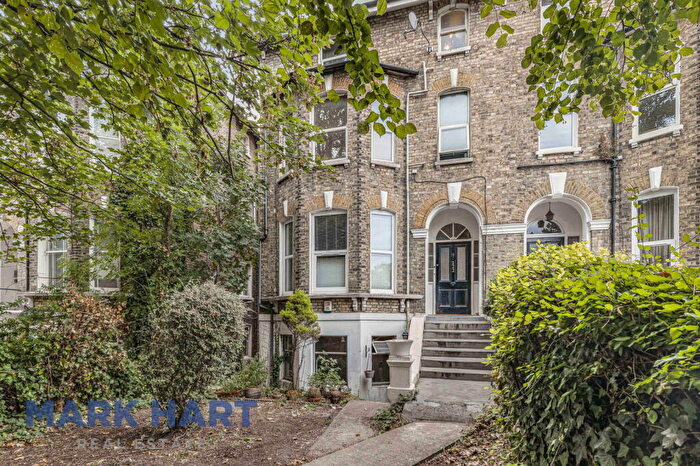
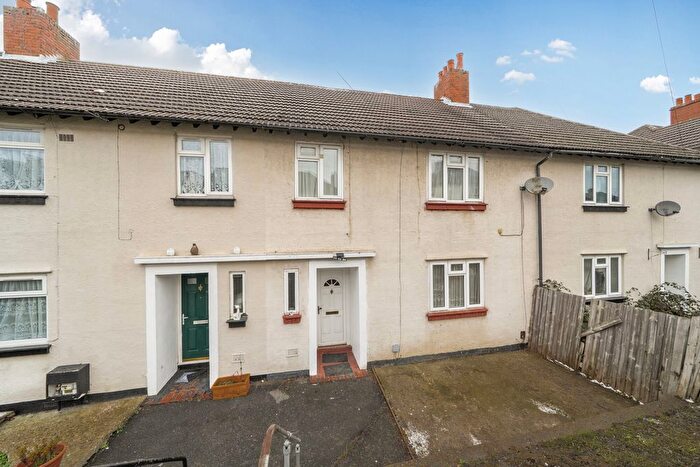
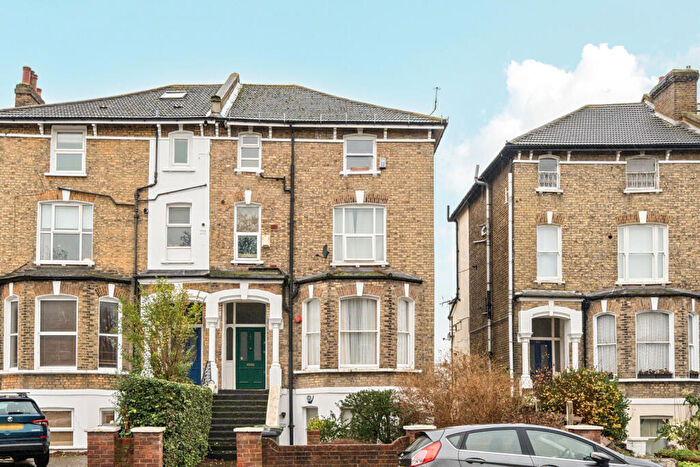
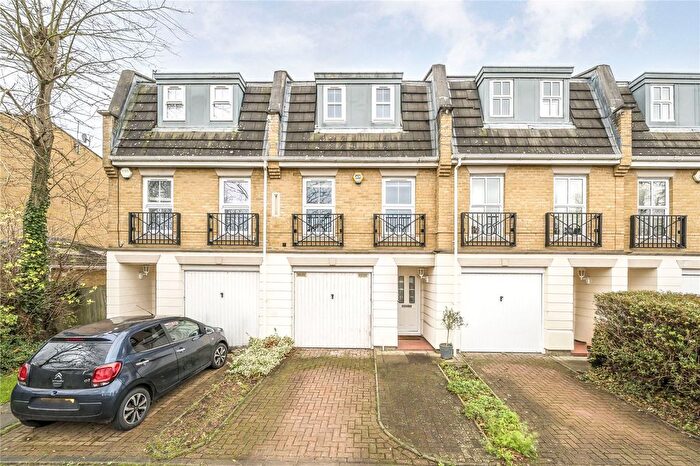
Properties for sale in Grove Park
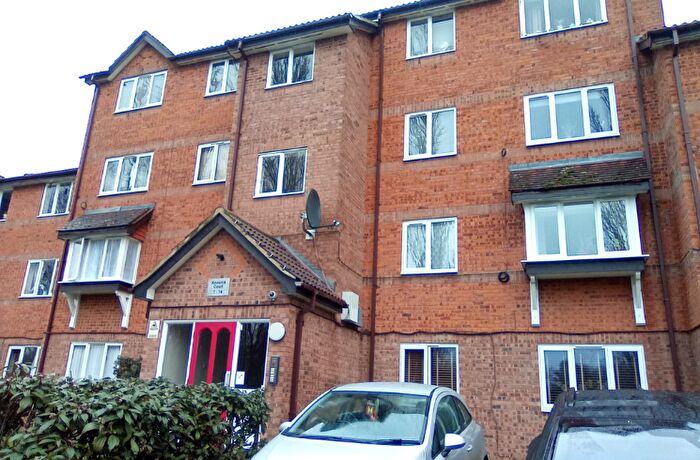
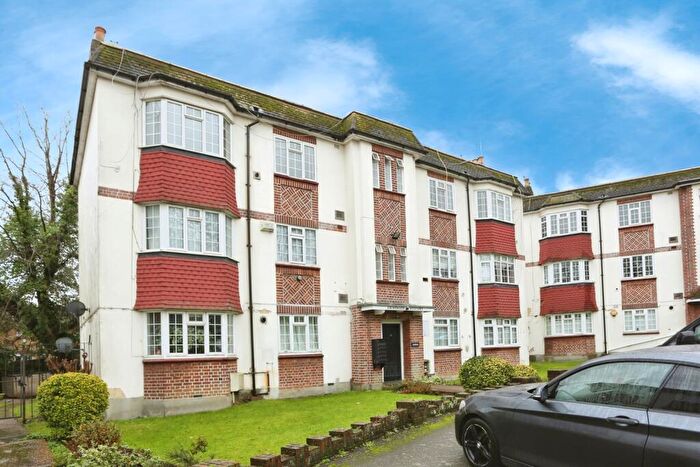
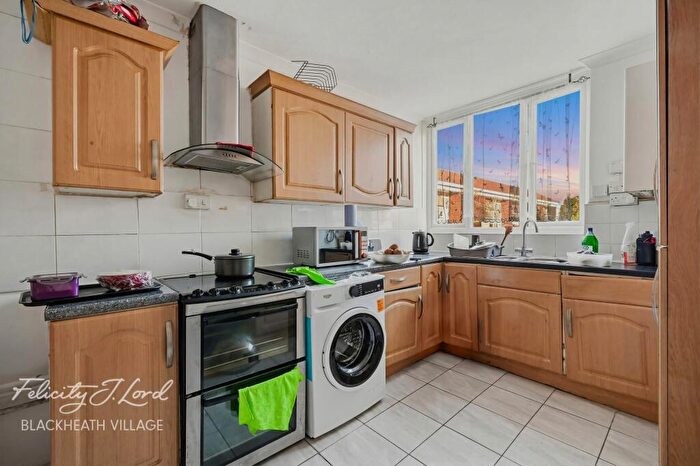
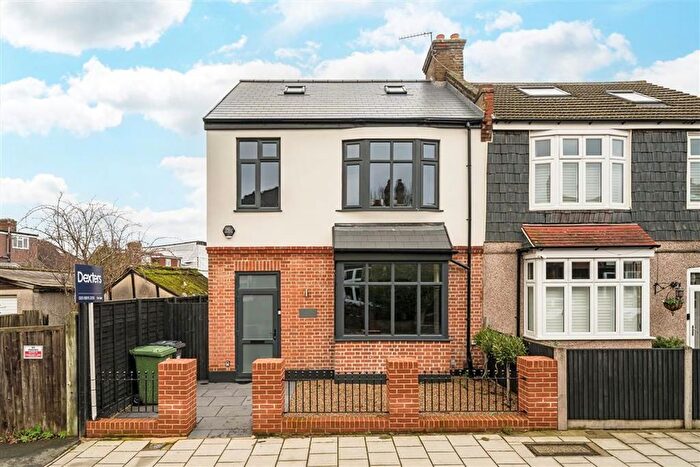
![]()
If you are looking to sell your house, let it out, or receive a property valuation, an expert can help you.
Click the button below to get started.

Roads and Postcodes in Grove Park
Navigate through our locations to find the location of your next house in Grove Park, London for sale or to rent.
Transport near Grove Park
-
 Grove Park Station
 -
Lee Station
-
Mottingham Station
-
Hither Green Station
-
Sundridge Park Station
-
Elmstead Woods Station
-
Kidbrooke Station
-
Eltham Station
-
Bellingham Station
-
Beckenham Hill Station
- FAQ
- Price Paid By Year
- Property Type Price
Frequently asked questions about Grove Park
What is the average price for a property for sale in Grove Park?
The average price for a property for sale in Grove Park is £438,130. This amount is 17% lower than the average price in London. There are 1,842 property listings for sale in Grove Park.
What streets have the most expensive properties for sale in Grove Park?
The streets with the most expensive properties for sale in Grove Park are Harland Road at an average of £775,000, Winn Road at an average of £768,607 and Exford Gardens at an average of £695,000.
What streets have the most affordable properties for sale in Grove Park?
The streets with the most affordable properties for sale in Grove Park are Lions Close at an average of £222,666, Marbrook Court at an average of £235,000 and Leafy Oak Road at an average of £250,000.
Which train stations are available in or near Grove Park?
Some of the train stations available in or near Grove Park are Grove Park, Lee and Mottingham.
Property Price Paid in Grove Park by Year
The average sold property price by year was:
| Year | Average Sold Price | Price Change |
Sold Properties
|
|---|---|---|---|
| 2025 | £456,015 | 2% |
129 Properties |
| 2024 | £444,733 | 6% |
149 Properties |
| 2023 | £415,894 | -3% |
148 Properties |
| 2022 | £427,435 | -1% |
217 Properties |
| 2021 | £430,320 | 9% |
239 Properties |
| 2020 | £392,562 | 9% |
182 Properties |
| 2019 | £356,896 | -10% |
163 Properties |
| 2018 | £394,231 | 7% |
173 Properties |
| 2017 | £367,340 | 1% |
186 Properties |
| 2016 | £361,910 | 13% |
194 Properties |
| 2015 | £314,823 | 14% |
231 Properties |
| 2014 | £270,547 | 7% |
273 Properties |
| 2013 | £252,600 | 4% |
213 Properties |
| 2012 | £243,218 | 5% |
149 Properties |
| 2011 | £229,951 | 3% |
129 Properties |
| 2010 | £224,096 | 8% |
117 Properties |
| 2009 | £205,965 | -9% |
115 Properties |
| 2008 | £225,261 | -1% |
152 Properties |
| 2007 | £227,557 | 10% |
318 Properties |
| 2006 | £204,804 | 8% |
364 Properties |
| 2005 | £188,094 | -0,5% |
287 Properties |
| 2004 | £188,970 | 7% |
349 Properties |
| 2003 | £175,542 | 18% |
344 Properties |
| 2002 | £144,050 | 17% |
400 Properties |
| 2001 | £119,781 | 10% |
353 Properties |
| 2000 | £107,281 | 12% |
389 Properties |
| 1999 | £93,895 | 17% |
395 Properties |
| 1998 | £77,484 | 8% |
288 Properties |
| 1997 | £71,444 | 13% |
297 Properties |
| 1996 | £62,169 | 2% |
218 Properties |
| 1995 | £61,124 | - |
204 Properties |
Property Price per Property Type in Grove Park
Here you can find historic sold price data in order to help with your property search.
The average Property Paid Price for specific property types in the last three years are:
| Property Type | Average Sold Price | Sold Properties |
|---|---|---|
| Flat | £282,958.00 | 141 Flats |
| Semi Detached House | £571,653.00 | 93 Semi Detached Houses |
| Detached House | £710,230.00 | 26 Detached Houses |
| Terraced House | £452,510.00 | 166 Terraced Houses |