
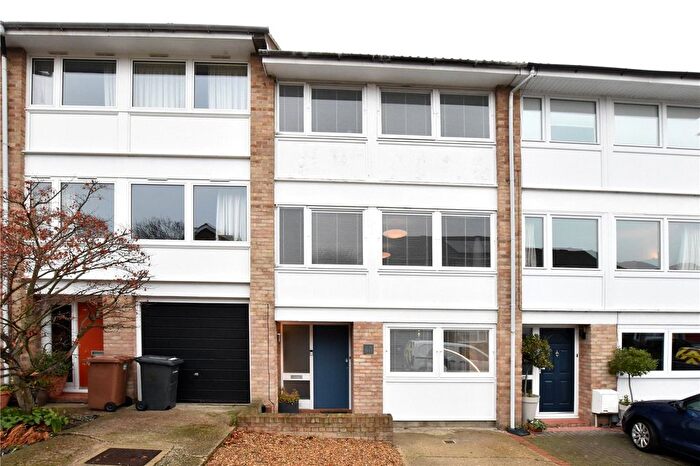
Houses for sale & to rent in SE3 9RU, Lee Road, Blackheath, London
House Prices in SE3 9RU, Lee Road, Blackheath
Properties in SE3 9RU have no sales history available within the last 3 years. SE3 9RU is a postcode in Lee Road located in Blackheath, an area in London, Lewisham London Borough, with 7 households².
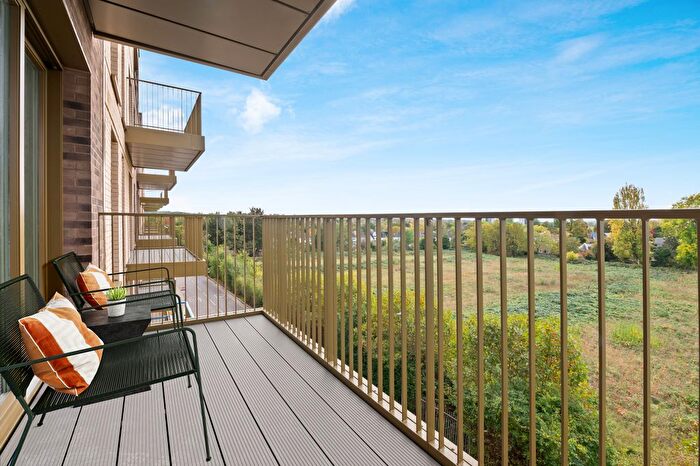
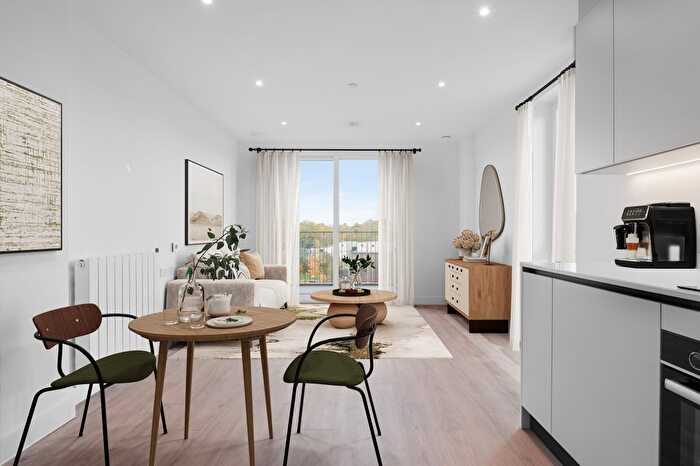
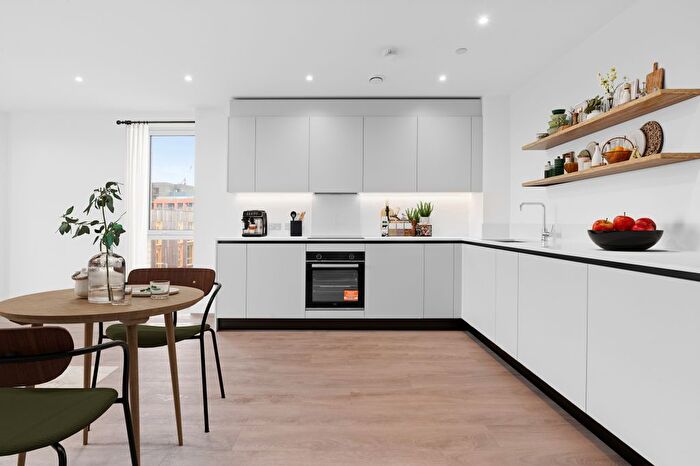
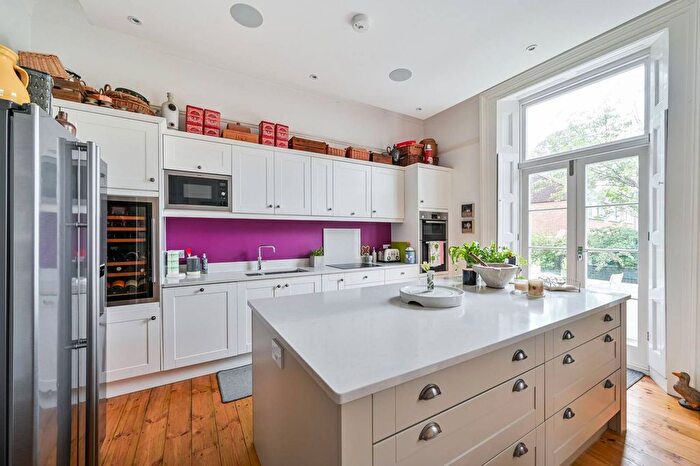
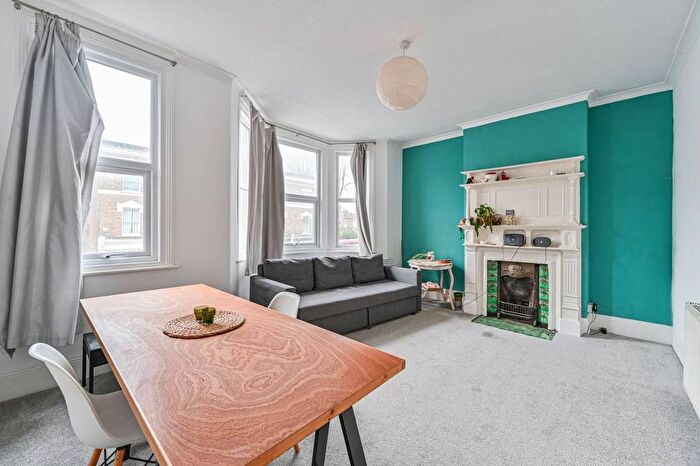
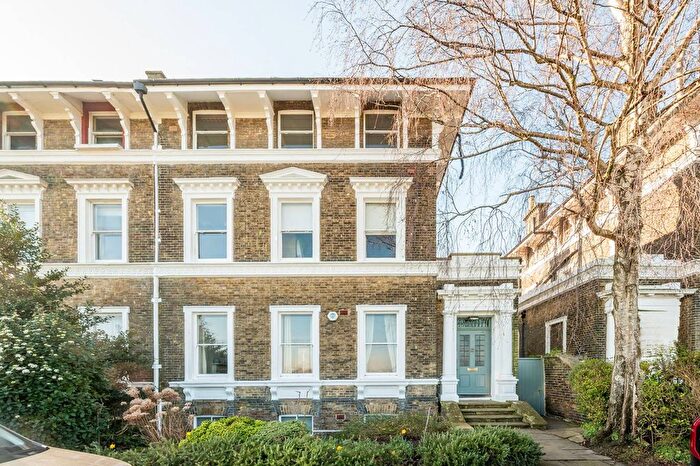
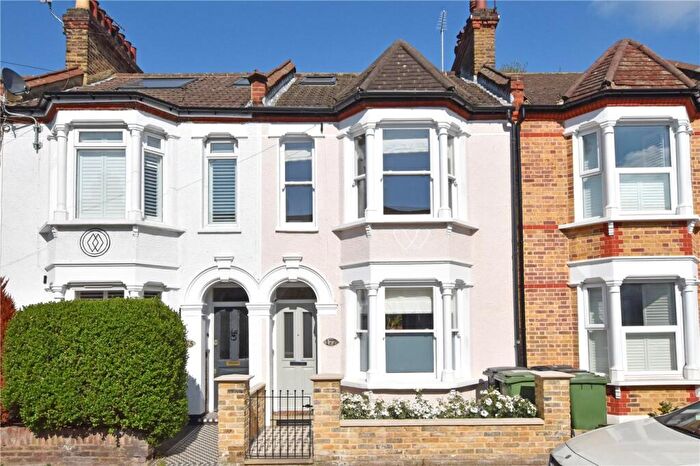
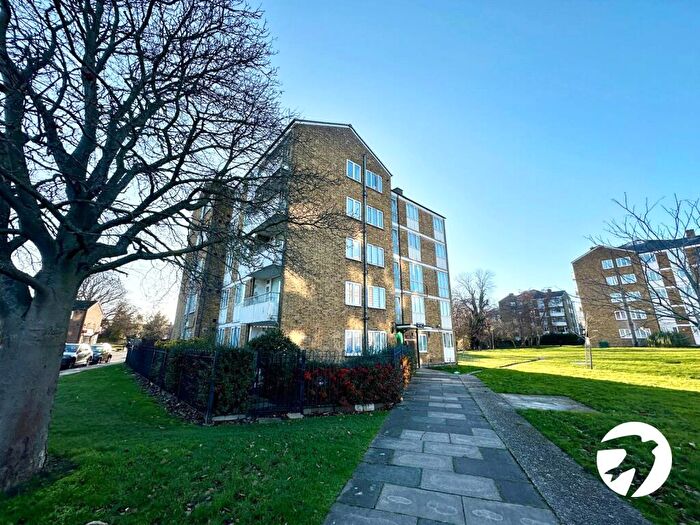
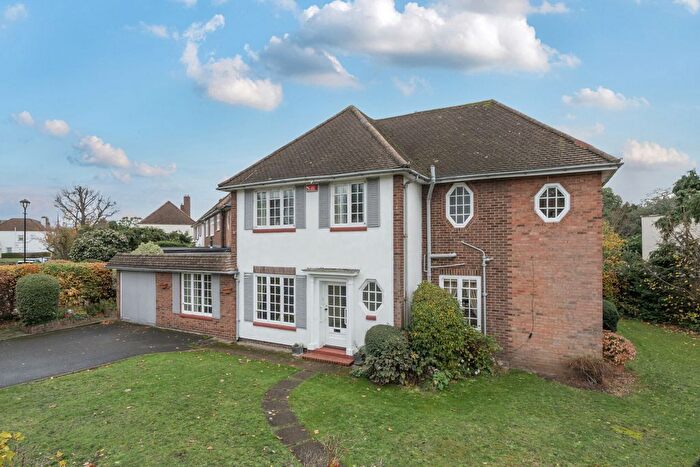
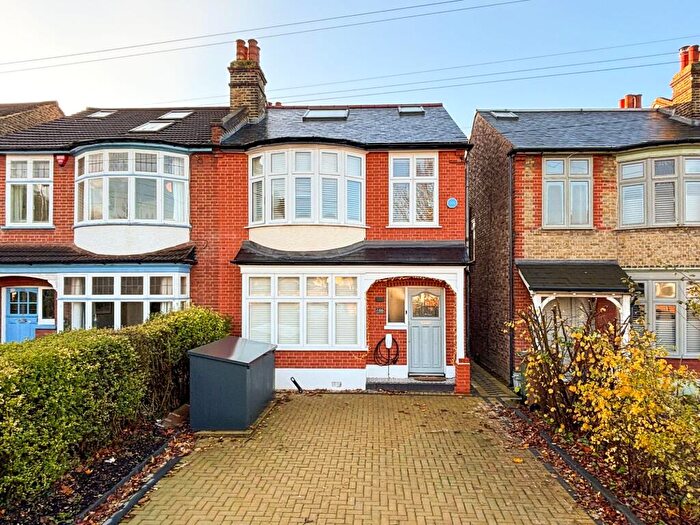
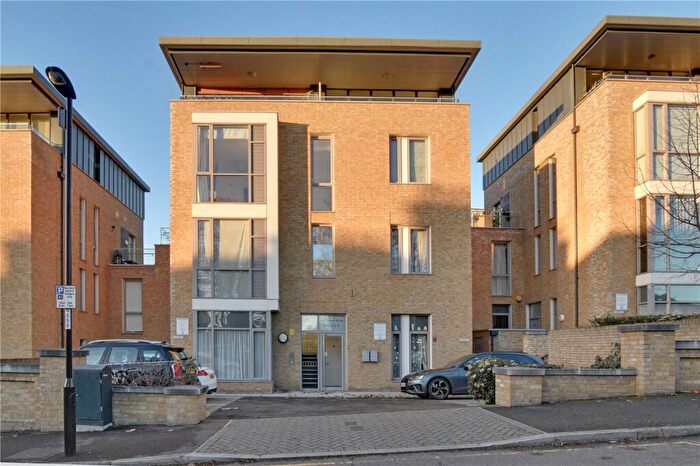
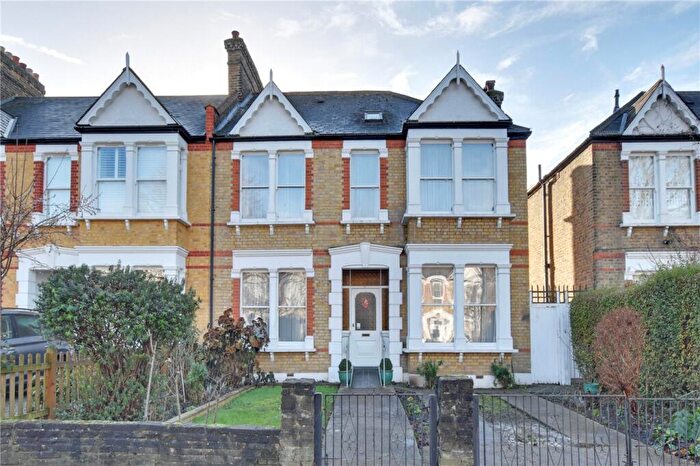
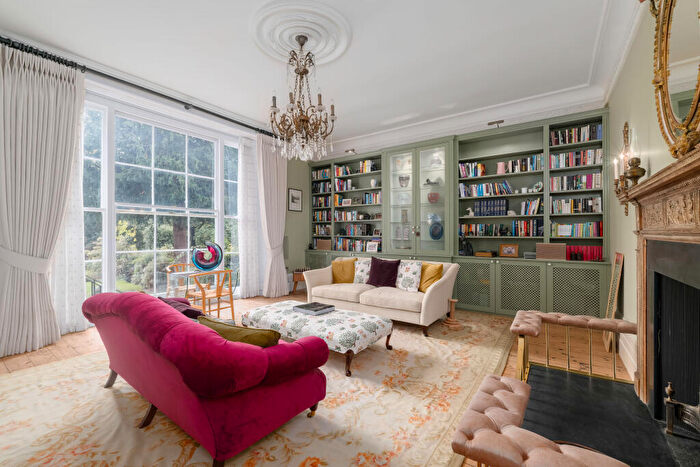
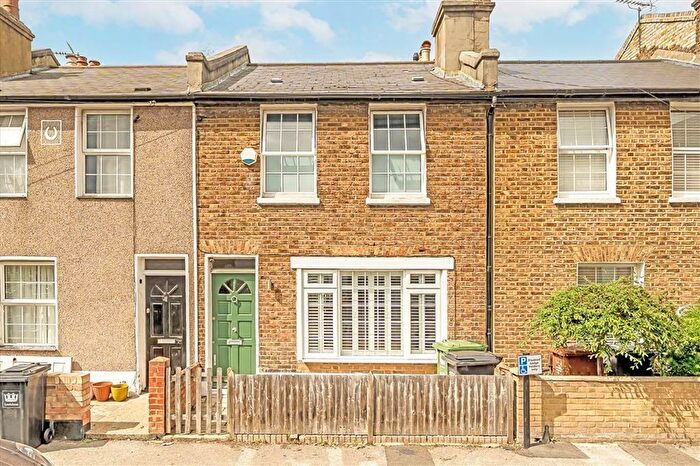
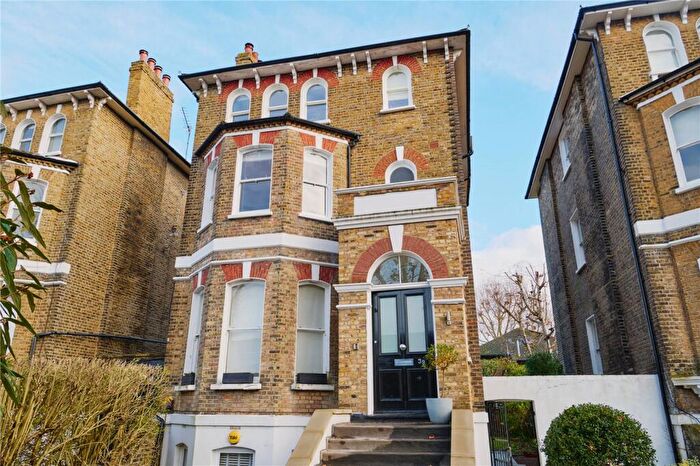
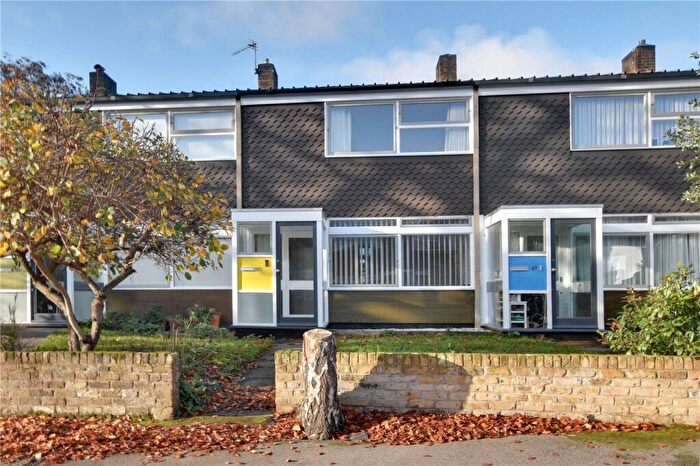
Properties for sale near SE3 9RU, Lee Road
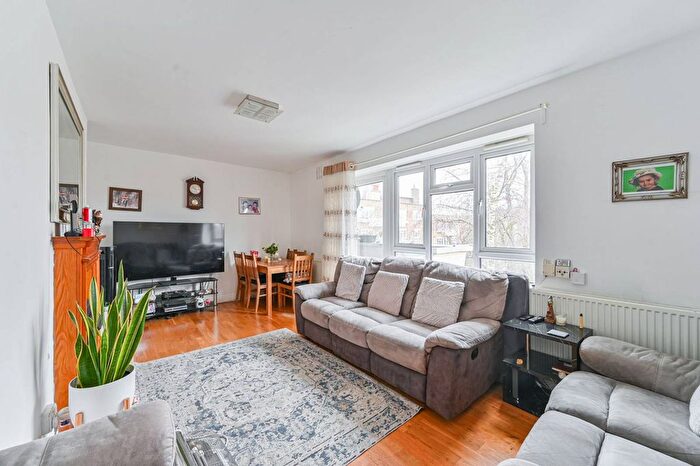
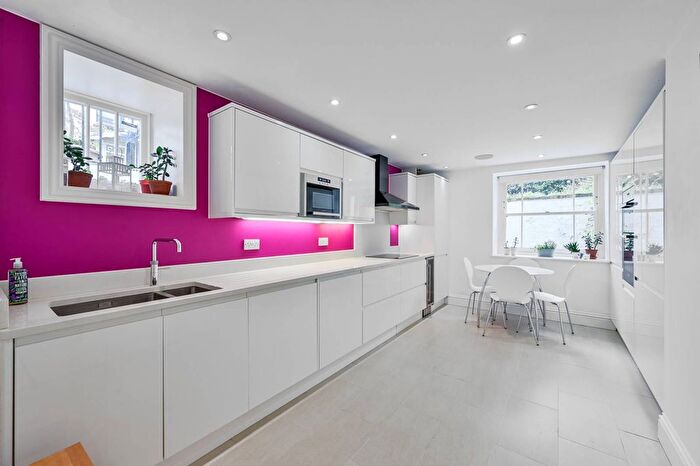
![]()
If you are looking to sell your house, let it out, or receive a property valuation, an expert can help you.
Click the button below to get started.


Price Paid in Lee Road, SE3 9RU, Blackheath
38 FLAT 3 Lee Road, SE3 9RU, Blackheath London
Property 38 FLAT 3 has been sold 4 times. The last time it was sold was in 30/06/2021 and the sold price was £550,000.00.
This is a Flat which was sold as a leasehold in 30/06/2021
| Date | Price | Property Type | Tenure | Classification |
|---|---|---|---|---|
| 30/06/2021 | £550,000.00 | Flat | leasehold | Established Building |
| 29/09/2006 | £334,950.00 | Flat | leasehold | Established Building |
| 09/12/1999 | £199,950.00 | Flat | leasehold | Established Building |
| 01/03/1996 | £134,000.00 | Flat | leasehold | Established Building |
36 Lee Road, SE3 9RU, Blackheath London
Property 36 has been sold 1 time. The last time it was sold was in 04/11/2004 and the sold price was £945,000.00.
This detached house, sold as a freehold on 04/11/2004, is a 253 sqm detached house with an EPC rating of D.
| Date | Price | Property Type | Tenure | Classification |
|---|---|---|---|---|
| 04/11/2004 | £945,000.00 | Detached House | freehold | Established Building |
Postcodes in Lee Road, Blackheath
Navigate through other locations in Lee Road, Blackheath, London to see more property listings for sale or to rent.
Transport near SE3 9RU, Lee Road
-
 Blackheath Station
 -
Hither Green Station
-
Lee Station
-
Kidbrooke Station
-
 Lewisham Station
 -
Elverson Road Station
-
Ladywell Station
-
St.John's Station
-
St Johns Station
-
Maze Hill Station
House price paid reports for SE3 9RU, Lee Road
Click on the buttons below to see price paid reports by year or property price:
- Price Paid By Year
Property Price Paid in SE3 9RU, Lee Road by Year
The average sold property price by year was:
| Year | Average Sold Price | Price Change |
Sold Properties
|
|---|---|---|---|
| 2021 | £550,000 | 39% |
1 Property |
| 2006 | £334,950 | -182% |
1 Property |
| 2004 | £945,000 | 79% |
1 Property |
| 1999 | £199,950 | 33% |
1 Property |
| 1996 | £134,000 | - |
1 Property |