
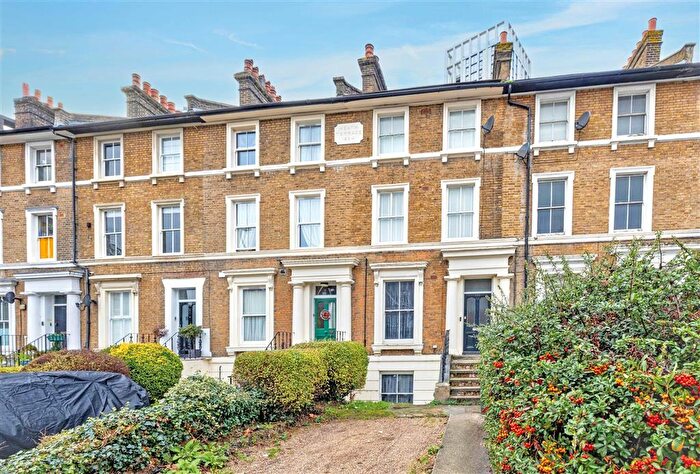
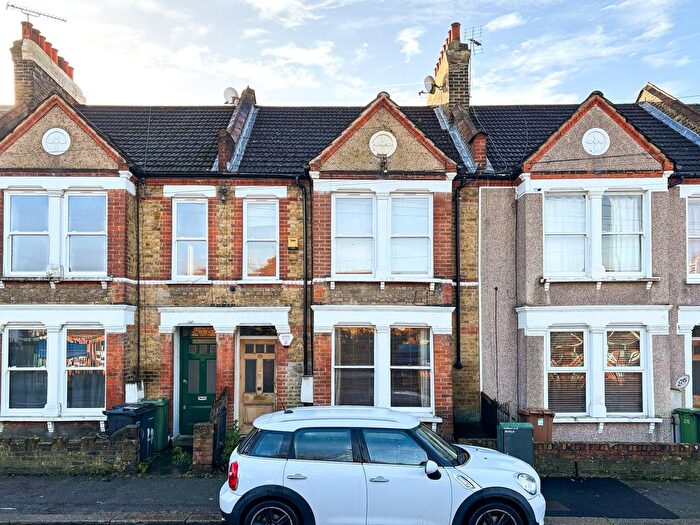
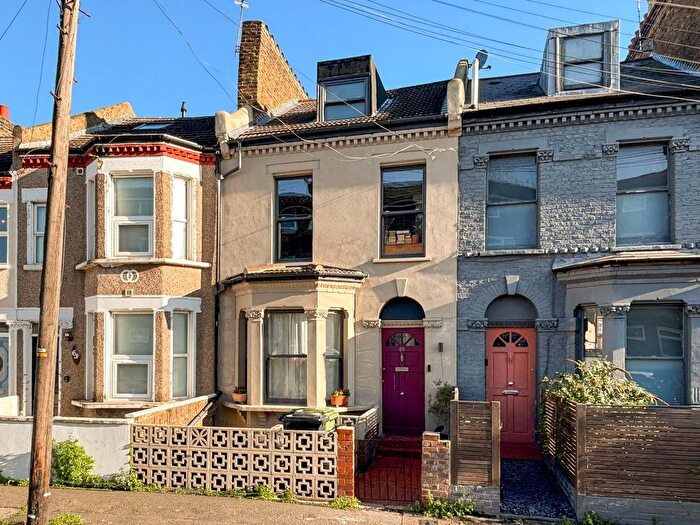
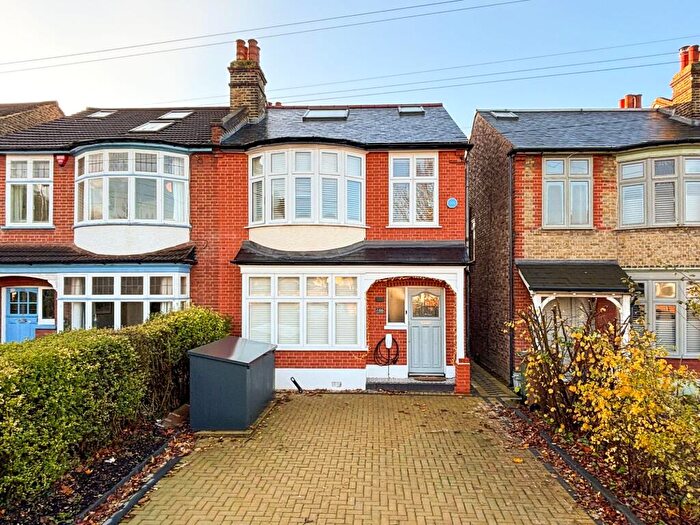
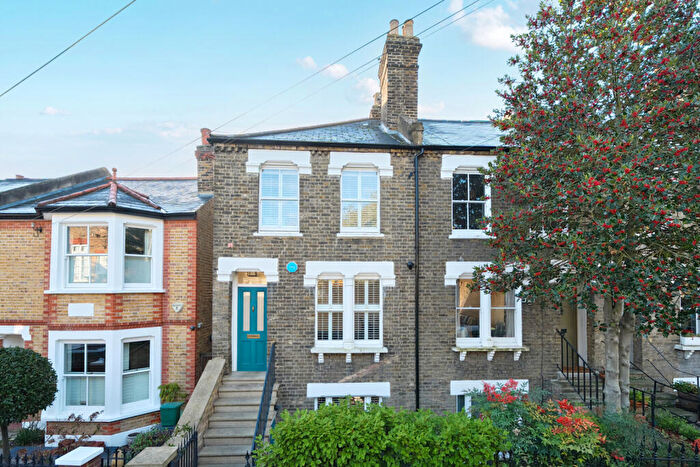
Houses for sale & to rent in Blackheath, London
House Prices in Blackheath
Properties in this part of Blackheath within London have an average house price of £696,827.00 and had 699 Property Transactions within the last 3 years¹. This area has 6,273 households² , where the most expensive property was sold for £10,515,000.00.
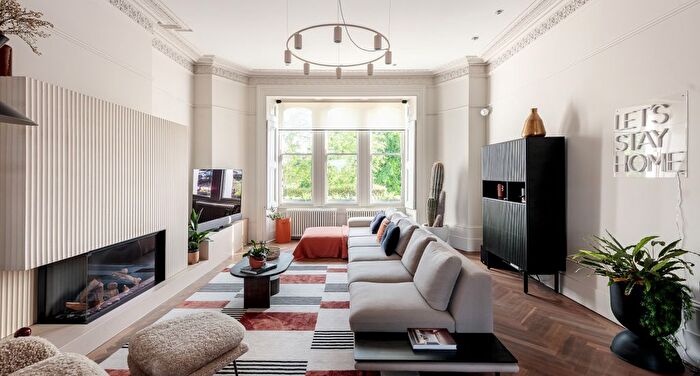
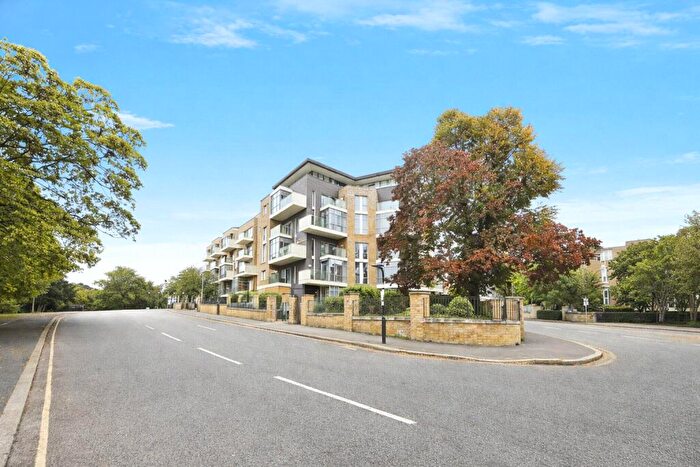
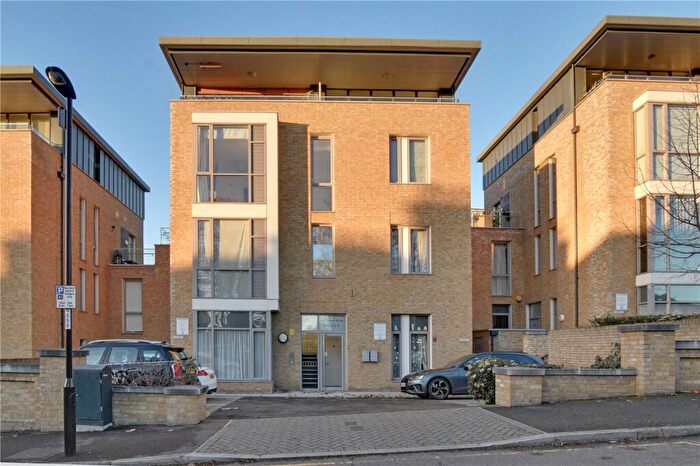
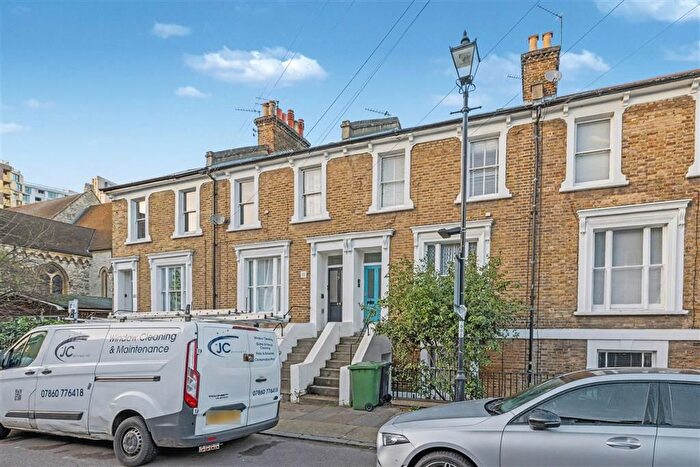
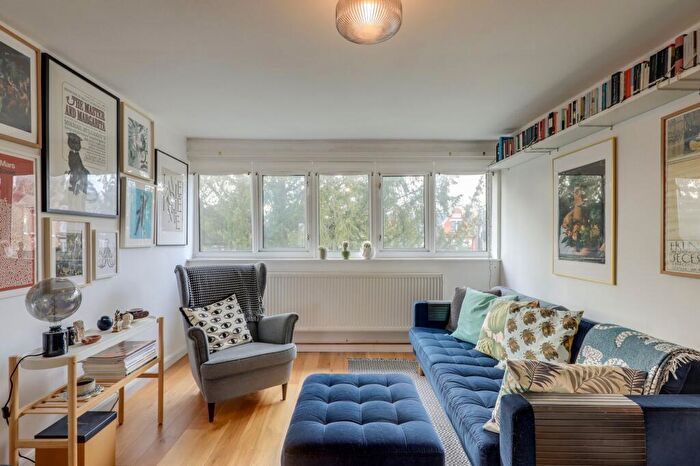
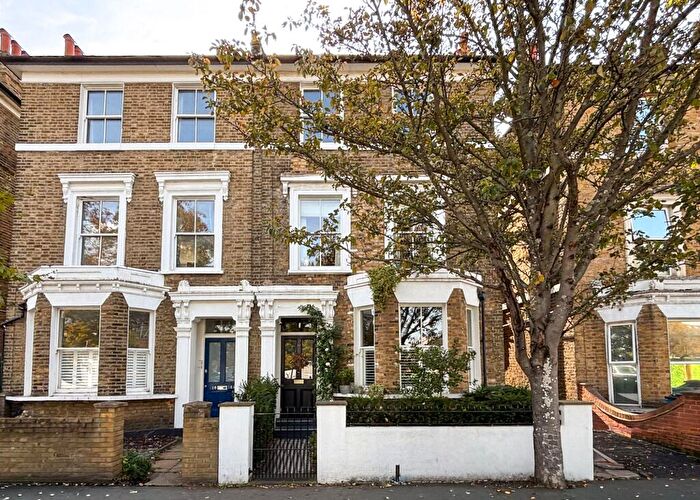
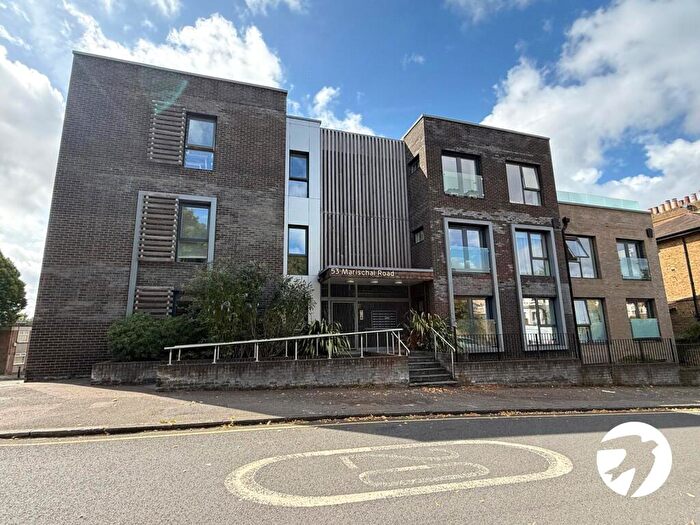
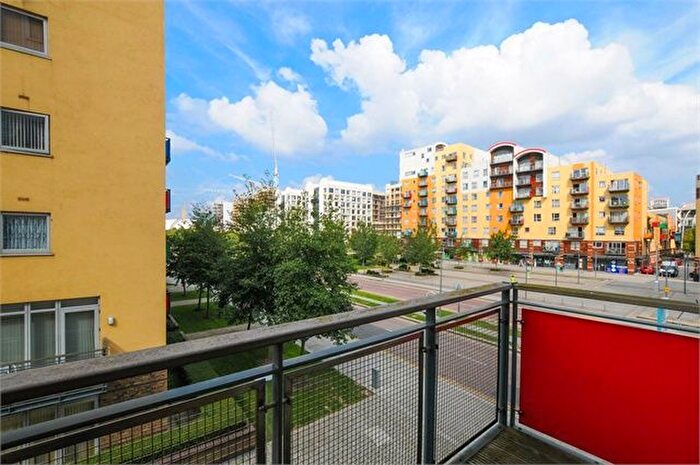
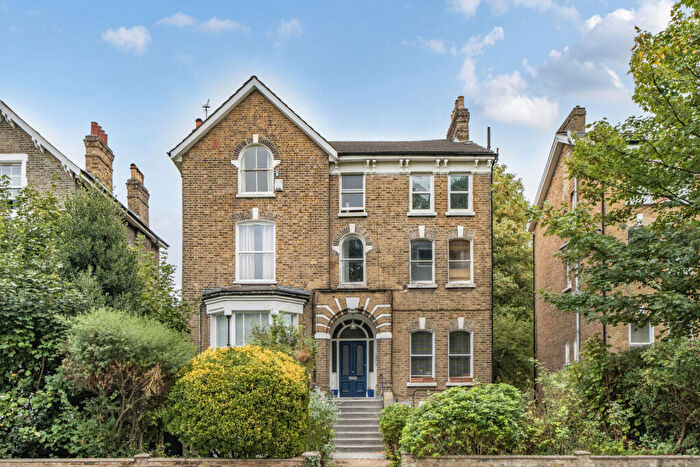
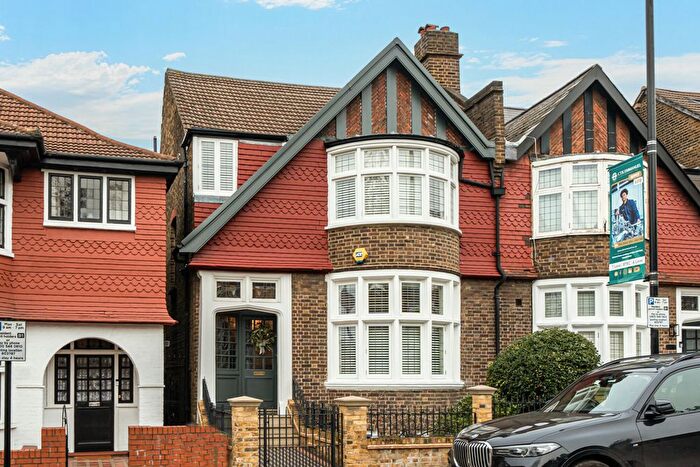
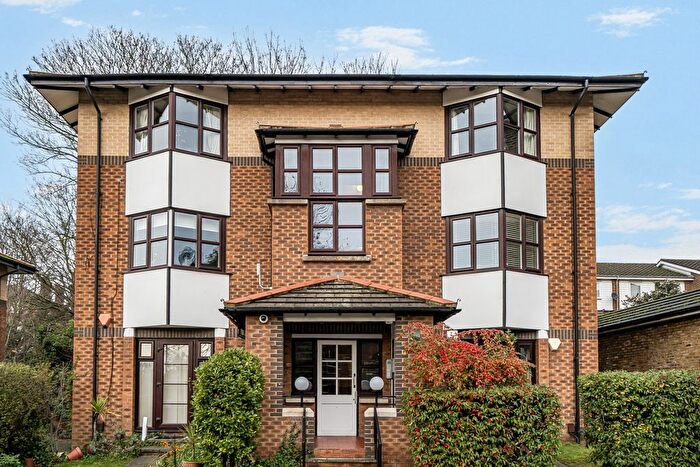
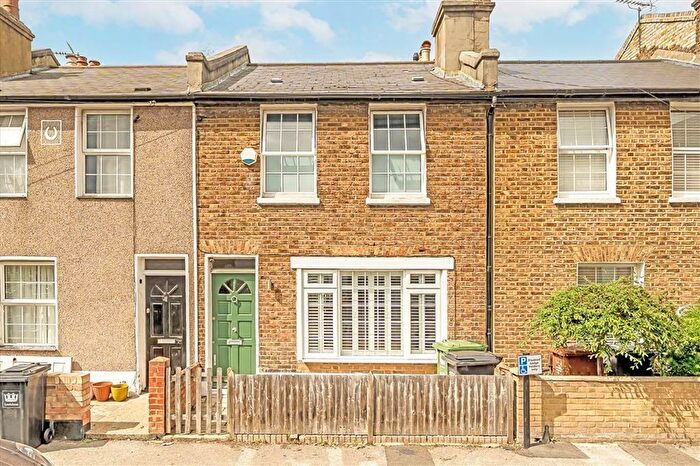
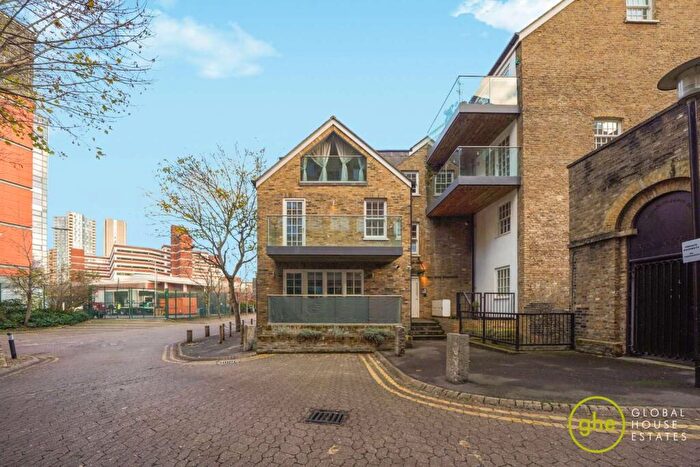
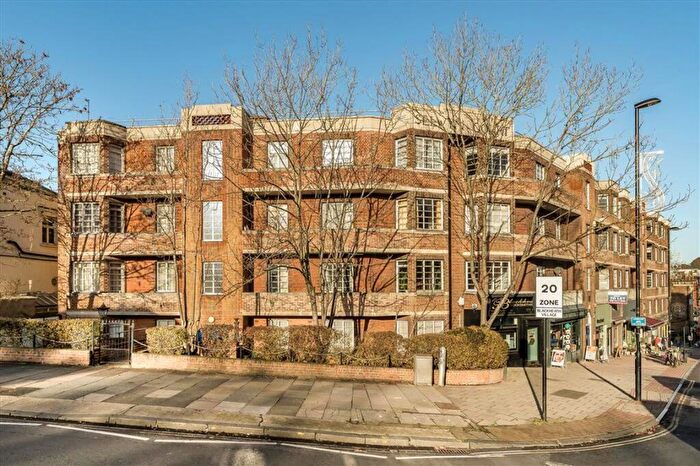
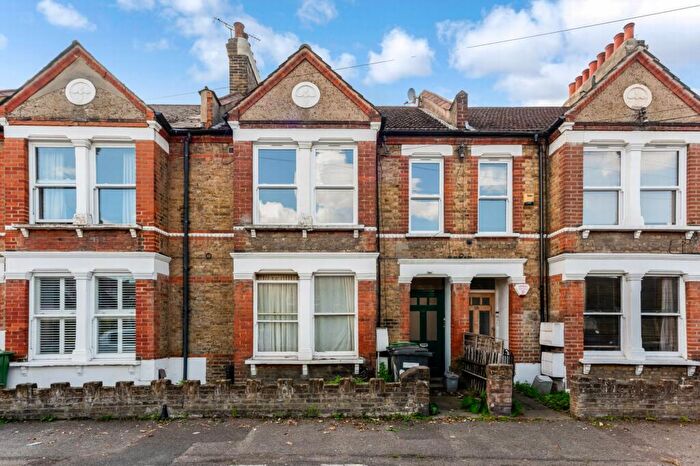
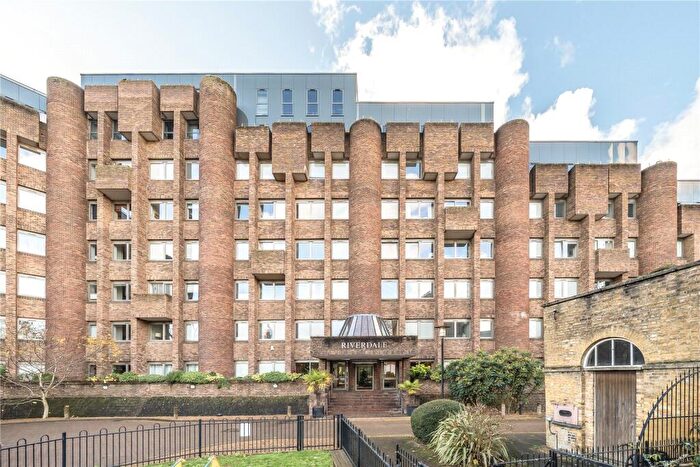
Properties for sale in Blackheath
![]()
If you are looking to sell your house, let it out, or receive a property valuation, an expert can help you.
Click the button below to get started.


Roads and Postcodes in Blackheath
Navigate through our locations to find the location of your next house in Blackheath, London for sale or to rent.
Transport near Blackheath
-
 Blackheath Station
 -
 Lewisham Station
 -
Elverson Road Station
-
Hither Green Station
-
St.John's Station
-
St Johns Station
-
Greenwich Station
-
Ladywell Station
-
Deptford Bridge Station
-
Maze Hill Station
- FAQ
- Price Paid By Year
- Property Type Price
Frequently asked questions about Blackheath
What is the average price for a property for sale in Blackheath?
The average price for a property for sale in Blackheath is £696,827. This amount is 31% higher than the average price in London. There are 3,553 property listings for sale in Blackheath.
What streets have the most expensive properties for sale in Blackheath?
The streets with the most expensive properties for sale in Blackheath are Cardigan Place at an average of £4,200,000, Eliot Vale at an average of £2,287,500 and Heathfield Gardens at an average of £1,950,001.
What streets have the most affordable properties for sale in Blackheath?
The streets with the most affordable properties for sale in Blackheath are Manor Park Parade at an average of £231,000, Celestial Gardens at an average of £242,379 and Drewery Court at an average of £252,500.
Which train stations are available in or near Blackheath?
Some of the train stations available in or near Blackheath are Blackheath, Lewisham and Hither Green.
Property Price Paid in Blackheath by Year
The average sold property price by year was:
| Year | Average Sold Price | Price Change |
Sold Properties
|
|---|---|---|---|
| 2025 | £717,924 | 8% |
129 Properties |
| 2024 | £663,783 | -12% |
188 Properties |
| 2023 | £743,017 | 8% |
156 Properties |
| 2022 | £680,390 | 4% |
226 Properties |
| 2021 | £651,396 | -8% |
207 Properties |
| 2020 | £701,998 | 10% |
177 Properties |
| 2019 | £628,726 | 15% |
162 Properties |
| 2018 | £536,600 | -1% |
239 Properties |
| 2017 | £543,348 | -9% |
200 Properties |
| 2016 | £594,087 | -2% |
212 Properties |
| 2015 | £606,269 | 17% |
225 Properties |
| 2014 | £501,188 | 13% |
240 Properties |
| 2013 | £434,338 | 4% |
282 Properties |
| 2012 | £417,371 | -1% |
229 Properties |
| 2011 | £422,939 | 5% |
187 Properties |
| 2010 | £402,882 | 12% |
180 Properties |
| 2009 | £352,576 | -0,2% |
171 Properties |
| 2008 | £353,363 | -8% |
145 Properties |
| 2007 | £382,205 | 17% |
330 Properties |
| 2006 | £318,581 | 9% |
343 Properties |
| 2005 | £289,643 | 3% |
304 Properties |
| 2004 | £279,831 | 3% |
358 Properties |
| 2003 | £272,828 | 7% |
316 Properties |
| 2002 | £253,721 | 17% |
352 Properties |
| 2001 | £211,764 | 3% |
356 Properties |
| 2000 | £205,572 | 23% |
342 Properties |
| 1999 | £158,032 | 11% |
370 Properties |
| 1998 | £140,856 | 17% |
347 Properties |
| 1997 | £117,414 | 11% |
371 Properties |
| 1996 | £104,568 | -8% |
282 Properties |
| 1995 | £113,088 | - |
219 Properties |
Property Price per Property Type in Blackheath
Here you can find historic sold price data in order to help with your property search.
The average Property Paid Price for specific property types in the last three years are:
| Property Type | Average Sold Price | Sold Properties |
|---|---|---|
| Flat | £454,143.00 | 454 Flats |
| Semi Detached House | £1,318,390.00 | 56 Semi Detached Houses |
| Detached House | £1,780,190.00 | 36 Detached Houses |
| Terraced House | £934,537.00 | 153 Terraced Houses |