Houses for sale & to rent in Aveland, Bourne
House Prices in Aveland
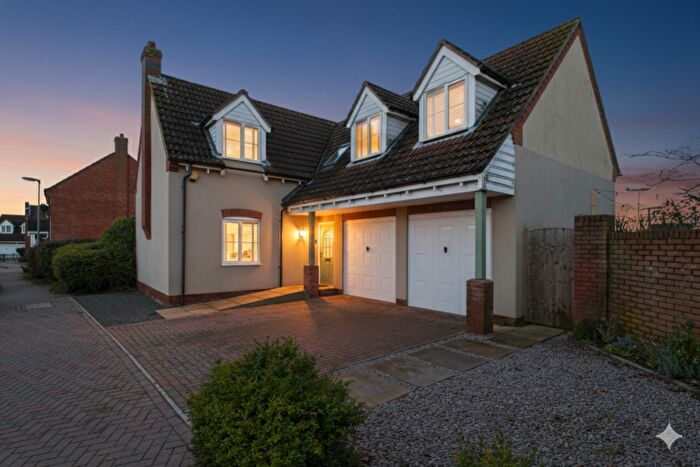
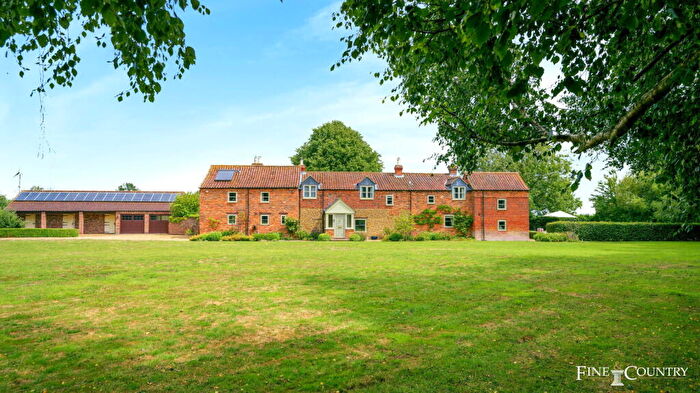
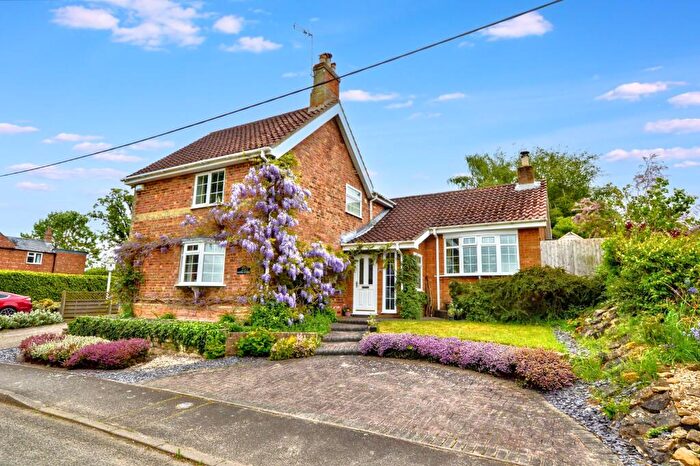
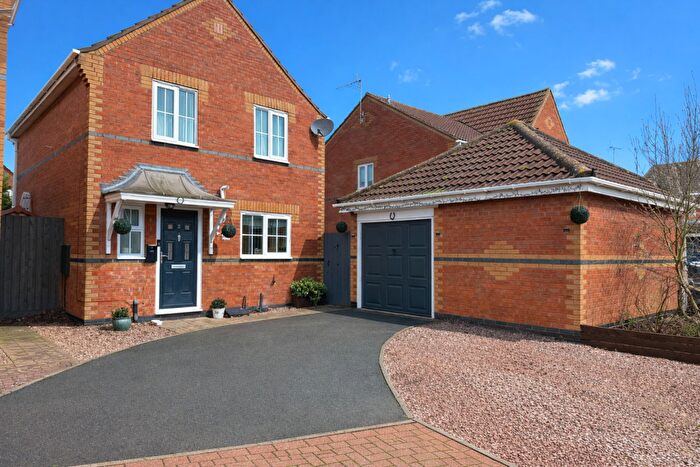
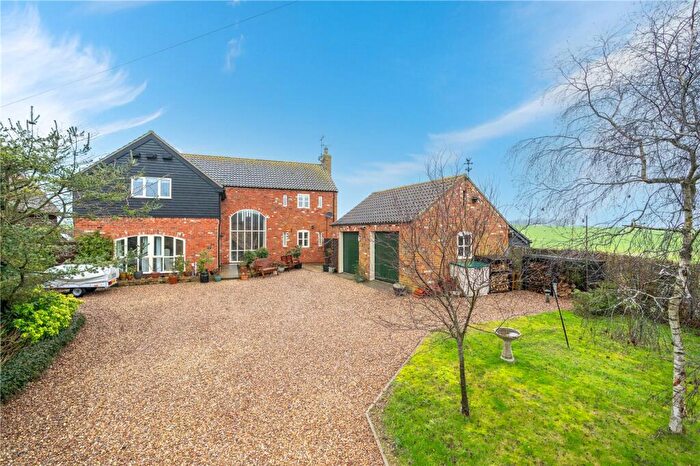
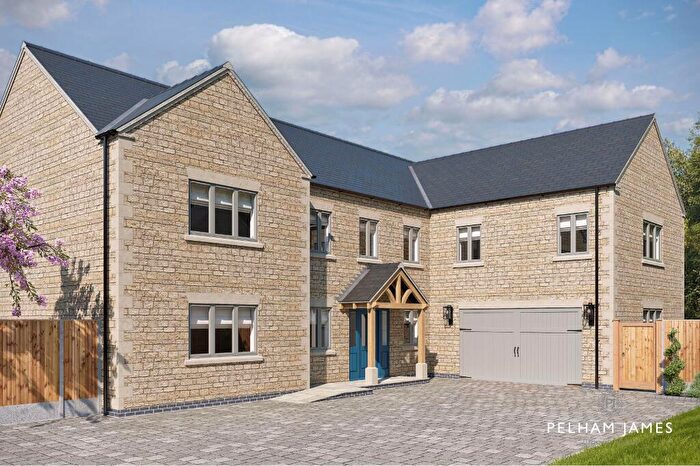
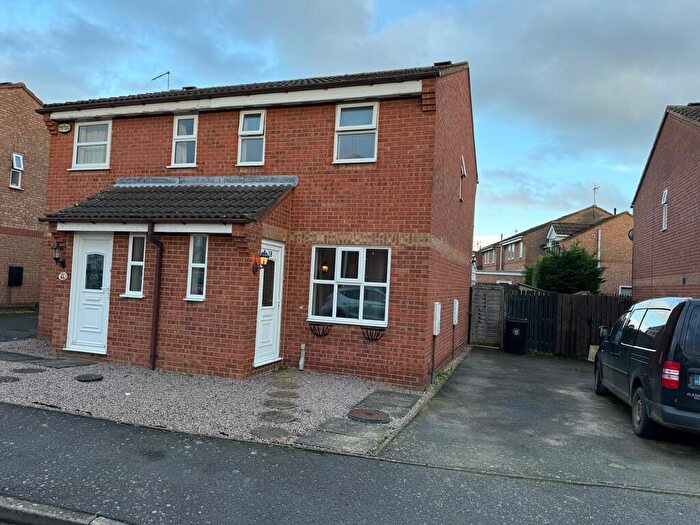
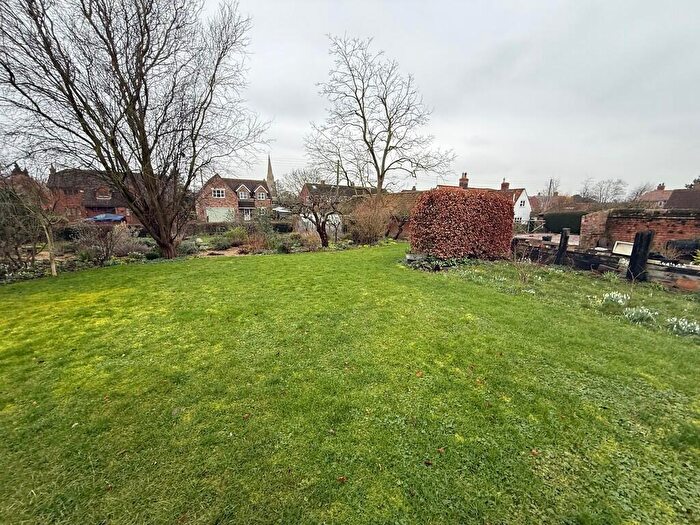
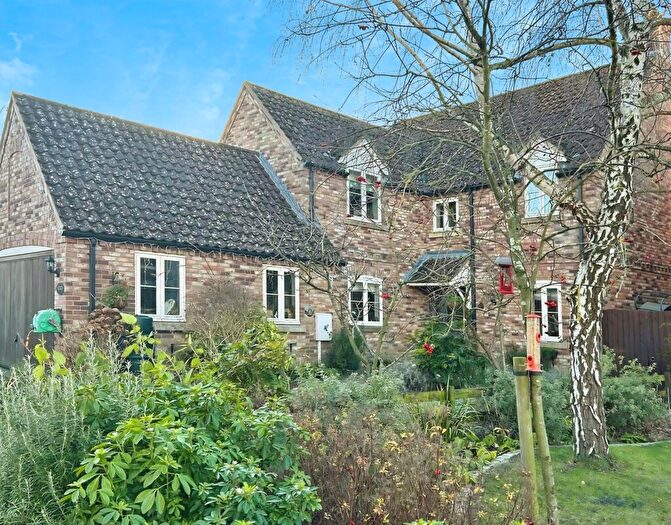
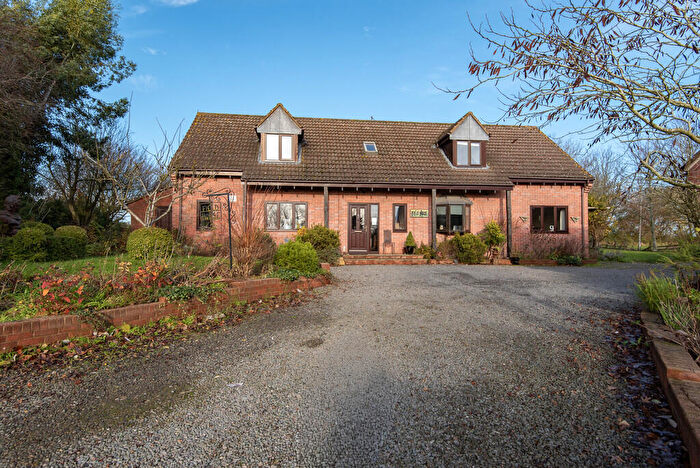
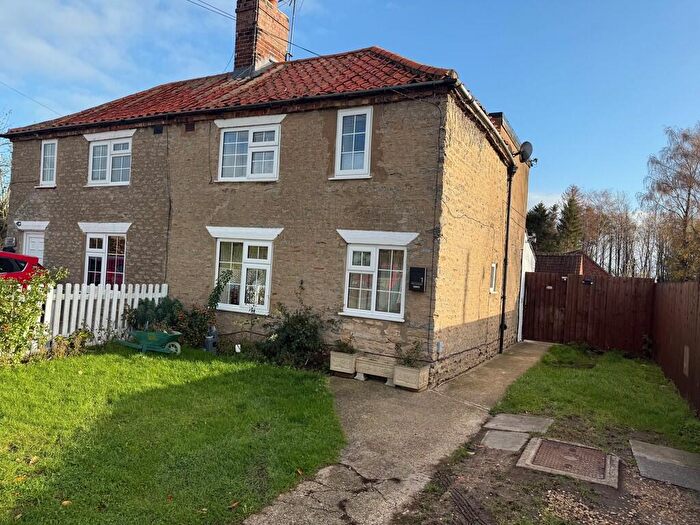
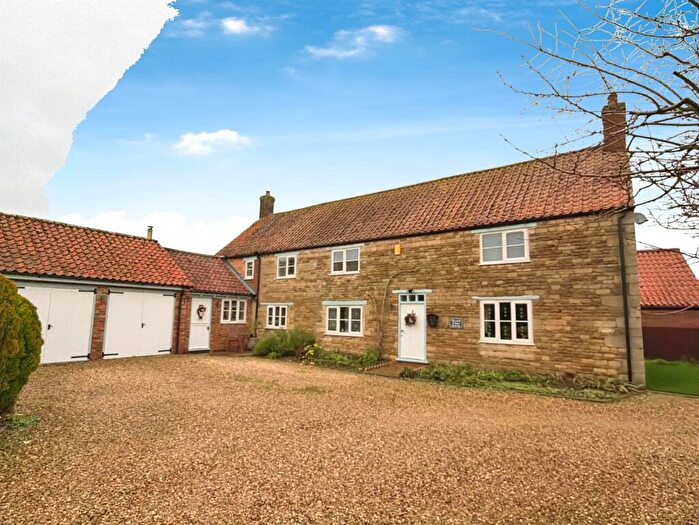
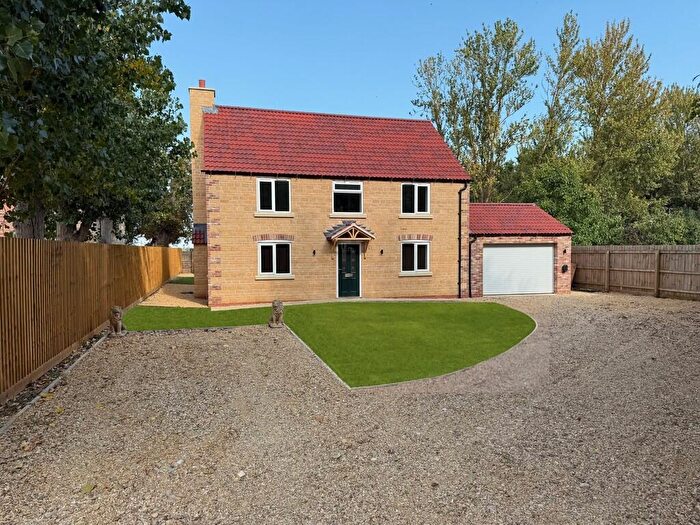
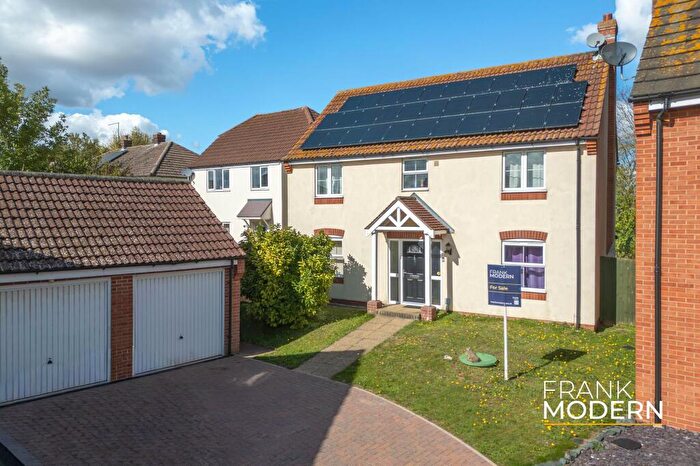
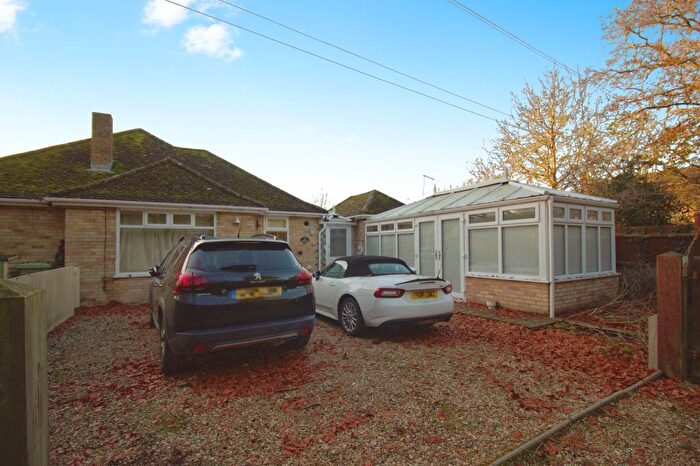
Properties in Aveland have an average house price of £408,673.00 and had 49 Property Transactions within the last 3 years¹.
Aveland is an area in Bourne, Lincolnshire with 555 households², where the most expensive property was sold for £930,000.00.
Properties for sale in Aveland
Roads and Postcodes in Aveland
Navigate through our locations to find the location of your next house in Aveland, Bourne for sale or to rent.
| Streets | Postcodes |
|---|---|
| Aslackby Road | PE10 0SL |
| Barnberry Way | PE10 0SE |
| Blanchard Close | PE10 0TJ |
| Brambling Walk | PE10 0WB |
| Callans Lane | PE10 0SA |
| Charlton Court | PE10 0SN |
| Cross Roads | PE10 0TE |
| Doctors Lane | PE10 0ST PE10 0UA |
| Dovecote Estate | PE10 0SY |
| Dowsby Fen | PE10 0TU PE10 0TX |
| Dowsby Road | PE10 0TF |
| Dunsby Fen | PE10 0UH |
| East Street | PE10 0SS |
| Fen Road | PE10 0TG PE10 0TR PE10 0TS PE10 0TT PE10 0UE PE10 0TP |
| Grinders Lane | PE10 0SZ |
| High Street | PE10 0SR |
| Horse Chestnut Lane | PE10 0TW |
| Kirkby Underwood Road | PE10 0RP |
| Linnet Drive | PE10 0WA |
| Main Road | PE10 0SP PE10 0TL PE10 0UB PE10 0UD |
| Middle Street | PE10 0SU |
| Millers Close | PE10 0TH |
| Pinfold Close | PE10 0TB |
| Rippingale Road | PE10 0SH |
| Sands Court | PE10 0TY |
| Scarborough Close | PE10 0SW |
| Siskin Close | PE10 0WD |
| Stainfield Road | PE10 0SG PE10 0XB |
| Station Street | PE10 0SX PE10 0TA PE10 0TD |
| The Green | PE10 0SF |
| The Kennels | PE10 0SB |
| The Old Nursery | PE10 0YG |
| Wendover Close | PE10 0TQ |
| Wyer Close | PE10 0NB |
| PE10 0SD PE10 0XD |
Transport near Aveland
-
Spalding Station
-
Heckington Station
-
Rauceby Station
-
Sleaford Station
-
Swineshead Station
-
Grantham Station
-
Ancaster Station
-
Stamford Station
-
Ruskington Station
-
Hubberts Bridge Station
- FAQ
- Price Paid By Year
- Property Type Price
Frequently asked questions about Aveland
What is the average price for a property for sale in Aveland?
The average price for a property for sale in Aveland is £408,673. This amount is 49% higher than the average price in Bourne. There are 684 property listings for sale in Aveland.
What streets have the most expensive properties for sale in Aveland?
The streets with the most expensive properties for sale in Aveland are Station Street at an average of £536,142, Grinders Lane at an average of £483,000 and Main Road at an average of £465,000.
What streets have the most affordable properties for sale in Aveland?
The streets with the most affordable properties for sale in Aveland are Dovecote Estate at an average of £155,000, The Green at an average of £165,000 and Stainfield Road at an average of £202,500.
Which train stations are available in or near Aveland?
Some of the train stations available in or near Aveland are Spalding, Heckington and Rauceby.
Property Price Paid in Aveland by Year
The average sold property price by year was:
| Year | Average Sold Price | Price Change |
Sold Properties
|
|---|---|---|---|
| 2025 | £331,727 | -22% |
11 Properties |
| 2024 | £406,204 | -14% |
22 Properties |
| 2023 | £464,968 | 30% |
16 Properties |
| 2022 | £326,252 | 6% |
19 Properties |
| 2021 | £307,391 | 5% |
23 Properties |
| 2020 | £291,423 | -18% |
13 Properties |
| 2019 | £343,944 | 32% |
18 Properties |
| 2018 | £234,117 | -26% |
17 Properties |
| 2017 | £294,866 | 26% |
34 Properties |
| 2016 | £219,026 | -6% |
19 Properties |
| 2015 | £233,111 | 2% |
22 Properties |
| 2014 | £228,087 | 7% |
31 Properties |
| 2013 | £211,687 | 0,2% |
21 Properties |
| 2012 | £211,361 | -12% |
13 Properties |
| 2011 | £235,965 | 12% |
16 Properties |
| 2010 | £208,653 | -5% |
16 Properties |
| 2009 | £218,964 | 1% |
14 Properties |
| 2008 | £216,601 | -10% |
15 Properties |
| 2007 | £238,028 | 2% |
27 Properties |
| 2006 | £232,086 | 7% |
22 Properties |
| 2005 | £215,576 | 4% |
32 Properties |
| 2004 | £206,740 | 21% |
37 Properties |
| 2003 | £163,843 | 5% |
30 Properties |
| 2002 | £156,166 | 24% |
52 Properties |
| 2001 | £119,218 | -8% |
32 Properties |
| 2000 | £128,450 | 31% |
46 Properties |
| 1999 | £88,045 | -7% |
30 Properties |
| 1998 | £94,098 | 29% |
38 Properties |
| 1997 | £67,178 | -9% |
23 Properties |
| 1996 | £73,033 | -27% |
22 Properties |
| 1995 | £92,454 | - |
12 Properties |
Property Price per Property Type in Aveland
Here you can find historic sold price data in order to help with your property search.
The average Property Paid Price for specific property types in the last three years are:
| Property Type | Average Sold Price | Sold Properties |
|---|---|---|
| Semi Detached House | £325,363.00 | 11 Semi Detached Houses |
| Detached House | £438,729.00 | 37 Detached Houses |
| Terraced House | £213,000.00 | 1 Terraced House |

