
Houses for sale in Lincolnshire, England
House Prices in Lincolnshire
Properties in Lincolnshire have
an average house price of
£245k
and had 34,768 Property Transactions
within the last 3 years.¹
Lincolnshire is a location in
England with
334,299 households², where the most expensive property was sold for £11.82M.
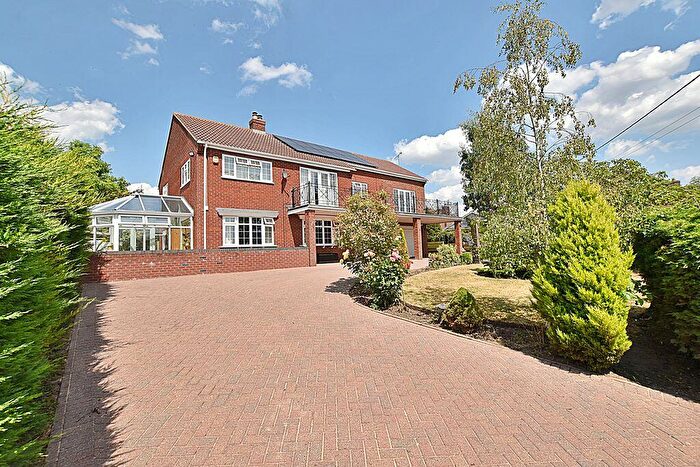
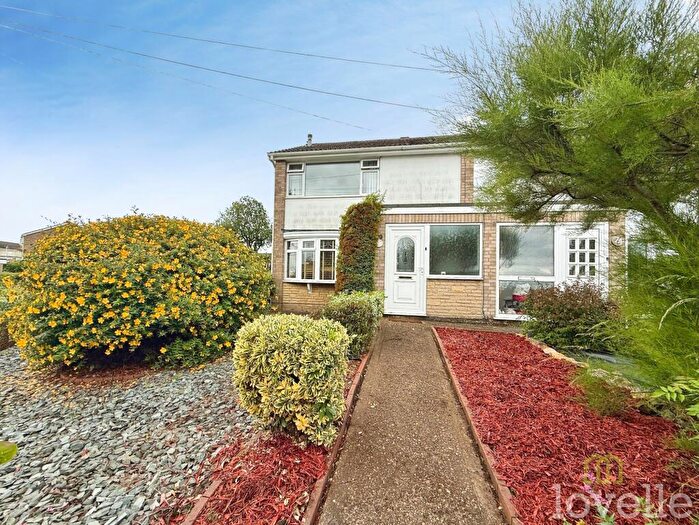
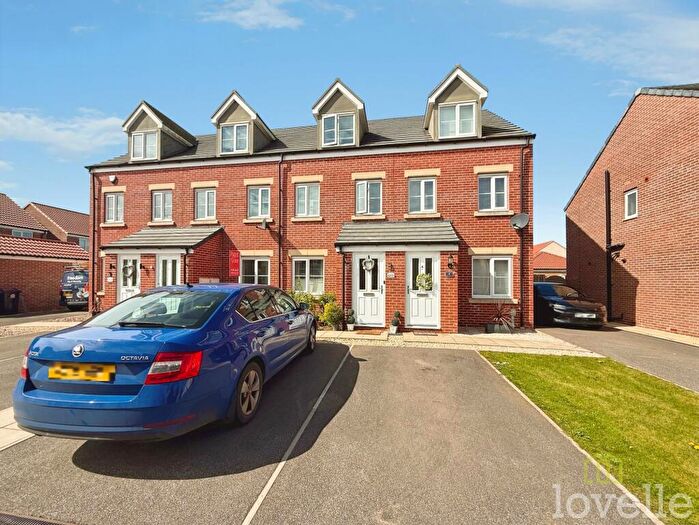
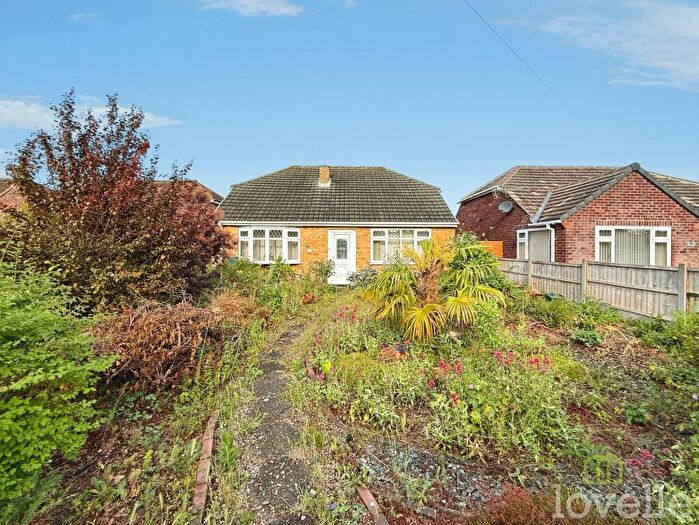
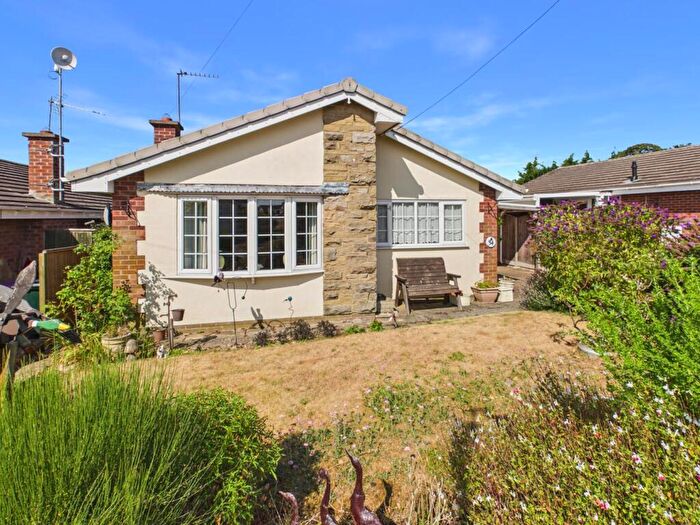
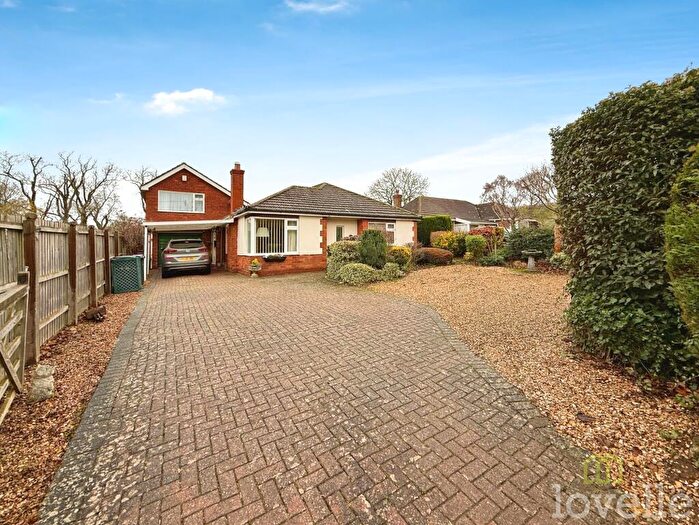
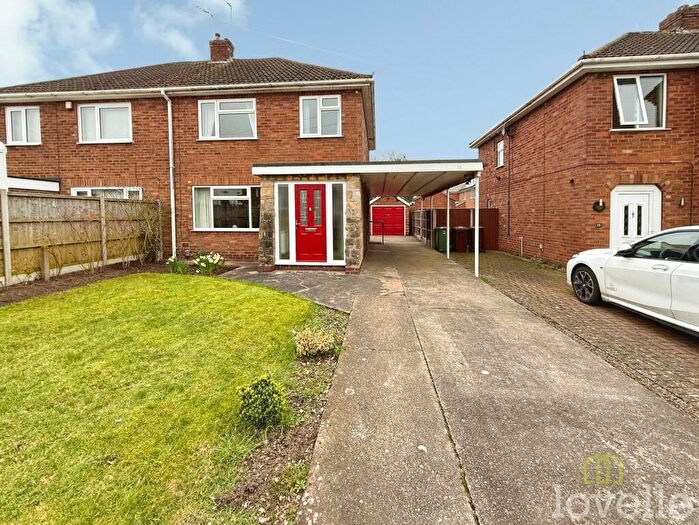
Properties for sale in Lincolnshire
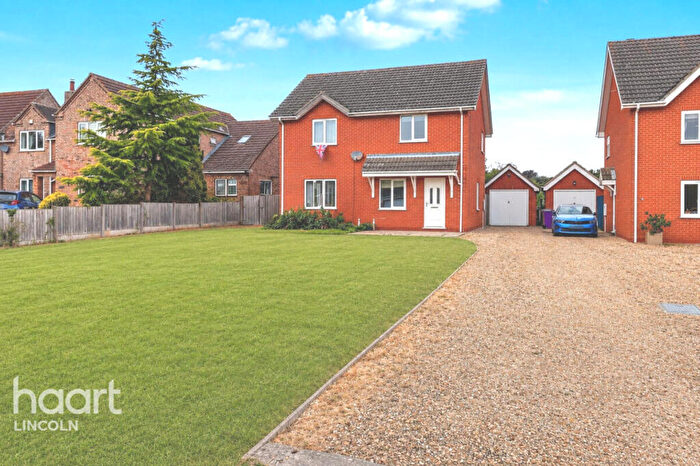
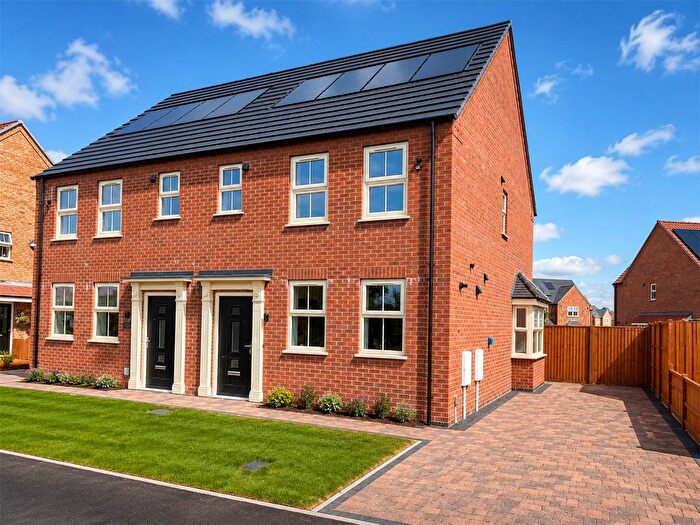
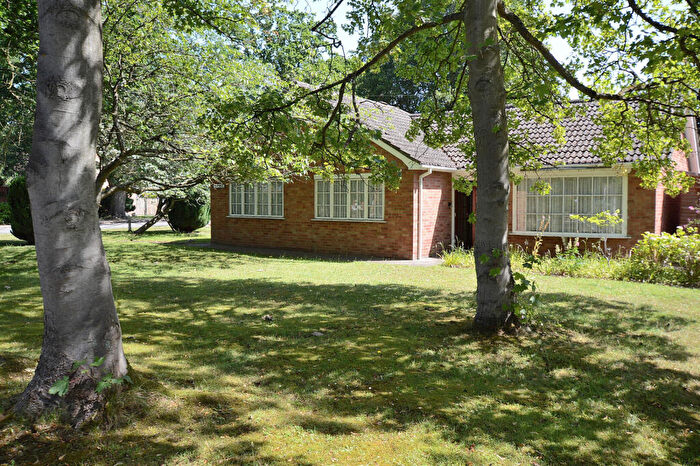
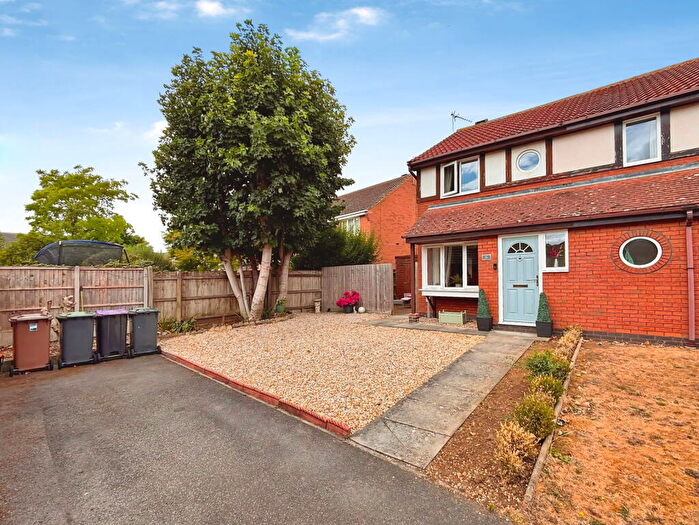
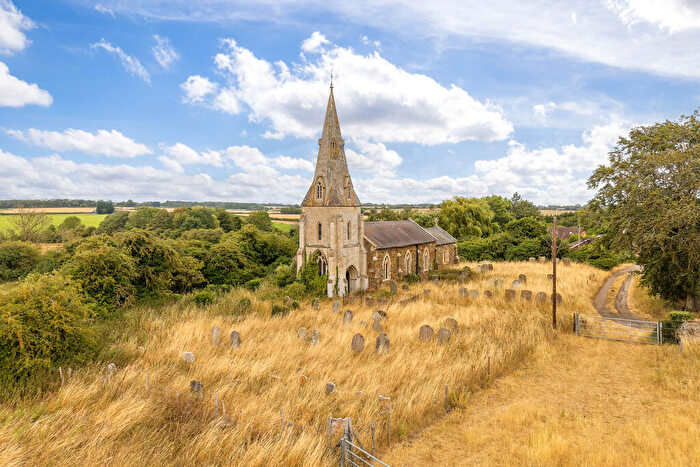
![]()
If you are looking to sell your house, let it out, or receive a property valuation, an expert can help you.
Click the button below to get started.


Towns in Lincolnshire
Navigate through our locations to find the location of your next house in Lincolnshire, England for sale or to rent.
- Barrow-upon-humber
- Gainsborough
- Alford
- Mablethorpe
- Spilsby
- Market Rasen
- Stamford
- Ulceby
- Skegness
- Newark
- Spalding
- Peterborough
- Nottingham
- Bourne
- Woodhall Spa
- Cleethorpes
- Barnetby
- Grimsby
- Sleaford
- Horncastle
- Scunthorpe
- Kings Lynn
- Barton-upon-Humber
- Brigg
- Doncaster
- Wisbech
- Lincoln
- Boston
- Grantham
- Immingham
- Louth
Property price trends in Lincolnshire
According to the latest Land Registry data, the average home in Lincolnshire sold for £237,035 in 2026. That figure comes from a substantial record of 443,385 sales logged over the past 31 years.
Prices have softened over the last three years. Compared with 2023, when the typical sale came in around £242,923, that's a fall of roughly 2.4%.
Looking back five years, average prices are up about 0.9% since 2021, a gain of around £2,182 in cash terms.
Zoom out to the past decade for the fuller picture. Back in 2016, homes here averaged £181,678, so the typical sold price has climbed about 30.5% since then, roughly 2.7% a year. Stretch the view to fifteen years and that annual pace edges up closer to 3%.
Frequently asked questions about Lincolnshire
What is the average price for a property for sale in Lincolnshire?
The average price for a property for sale in Lincolnshire is £244,837. This amount is 32% lower than the average price in England. There are more than 10,000 property listings for sale in Lincolnshire.
What locations have the most expensive properties for sale in Lincolnshire?
The locations with the most expensive properties for sale in Lincolnshire are Brigg at an average of £432,857, Newark at an average of £397,480 and Stamford at an average of £379,135.
What locations have the most affordable properties for sale in Lincolnshire?
The locations with the most affordable properties for sale in Lincolnshire are Gainsborough at an average of £169,018, Skegness at an average of £198,275 and Mablethorpe at an average of £201,570.
Which train stations are available in or near Lincolnshire?
Some of the train stations available in or near Lincolnshire are Ruskington, Metheringham and Heckington.
Property Price Paid in Lincolnshire by Year
The average sold property price by year was:
| Year | Average Sold Price | Price Change |
Sold Properties
|
|---|---|---|---|
| 2026 | £237,035 | -5% |
2,137 Properties |
| 2025 | £248,635 | 2% |
11,510 Properties |
| 2024 | £244,139 | 0,5% |
11,013 Properties |
| 2023 | £242,923 | -2% |
10,108 Properties |
| 2022 | £248,829 | 6% |
13,669 Properties |
| 2021 | £234,853 | 8% |
17,671 Properties |
| 2020 | £217,048 | 6% |
12,123 Properties |
| 2019 | £204,284 | 2% |
14,205 Properties |
| 2018 | £199,216 | 4% |
14,632 Properties |
| 2017 | £191,711 | 5% |
14,768 Properties |
Property Price per Property Type in Lincolnshire
Here you can find historic sold price data in order to help with your property search.
The average Property Paid Price for specific property types in the last three years are:
| Property Type | Average Sold Price | Sold Properties |
|---|---|---|
| Semi Detached House | £202,113.00 | 9,556 Semi Detached Houses |
| Terraced House | £164,666.00 | 7,651 Terraced Houses |
| Detached House | £320,905.00 | 15,957 Detached Houses |
| Flat | £125,044.00 | 1,604 Flats |
Transport in Lincolnshire
Please see below transportation links in this area:
