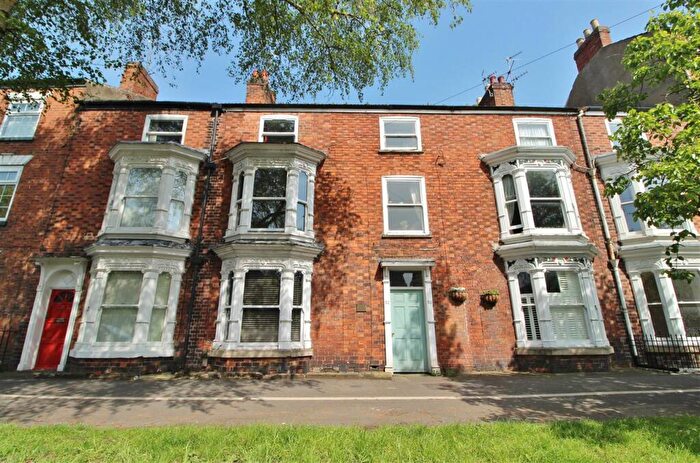
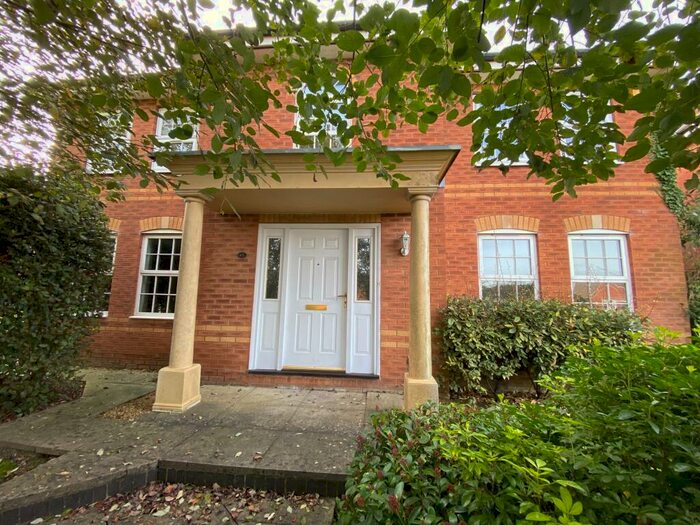
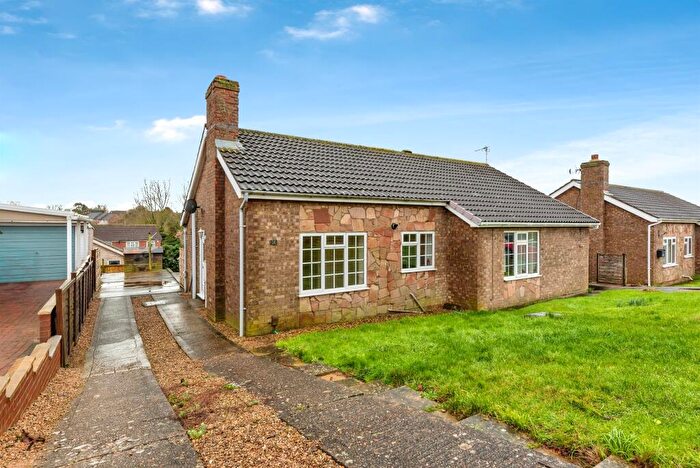
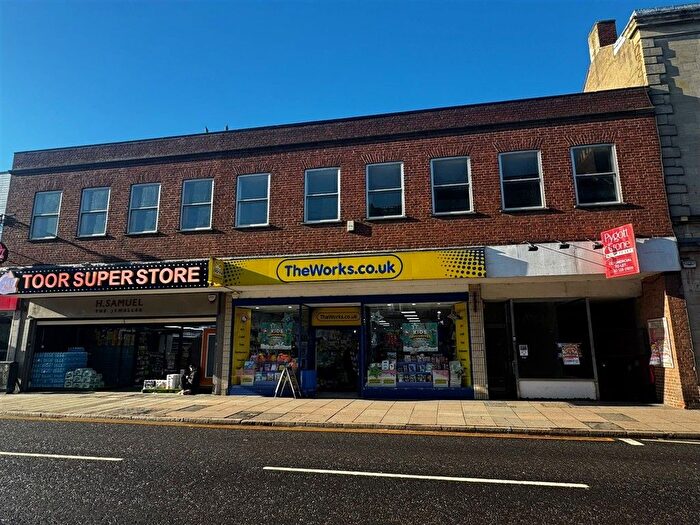
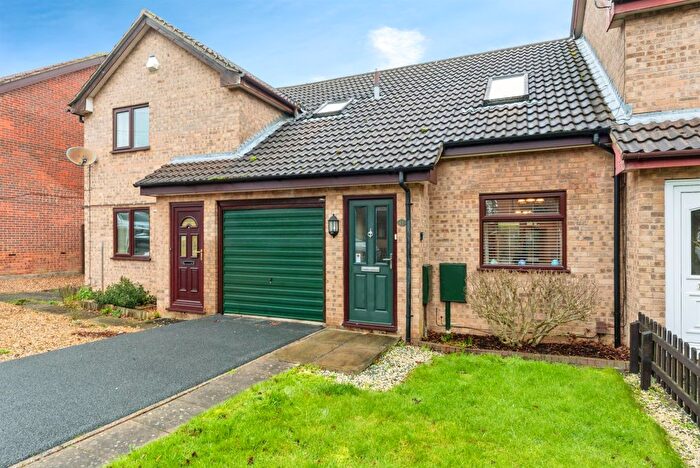
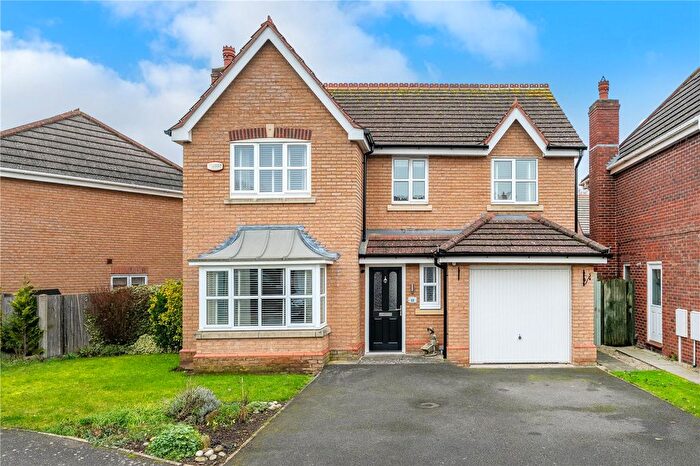
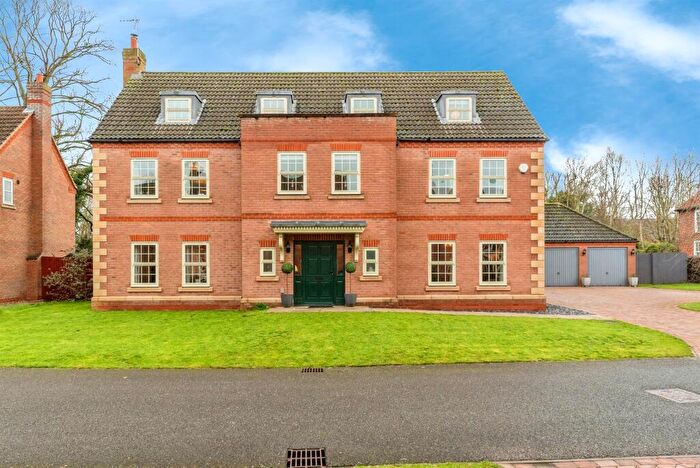
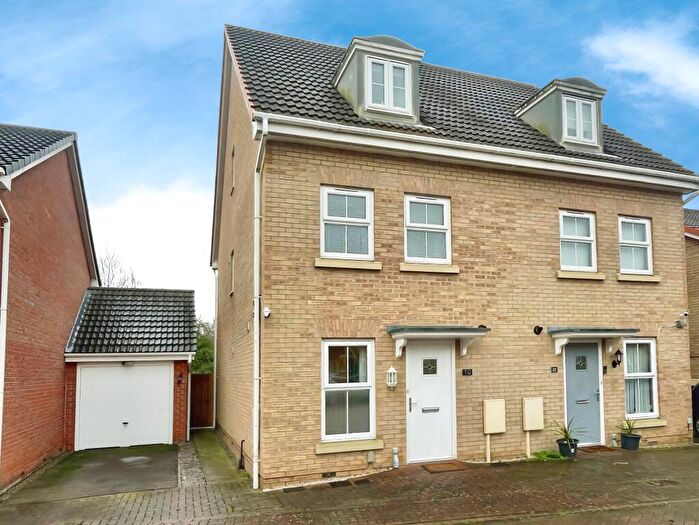
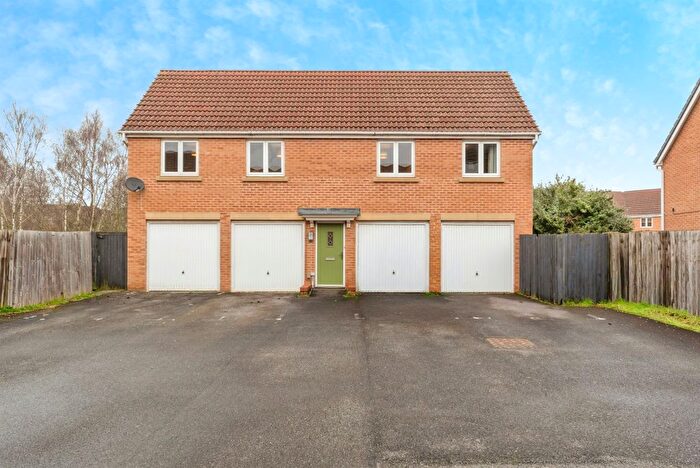
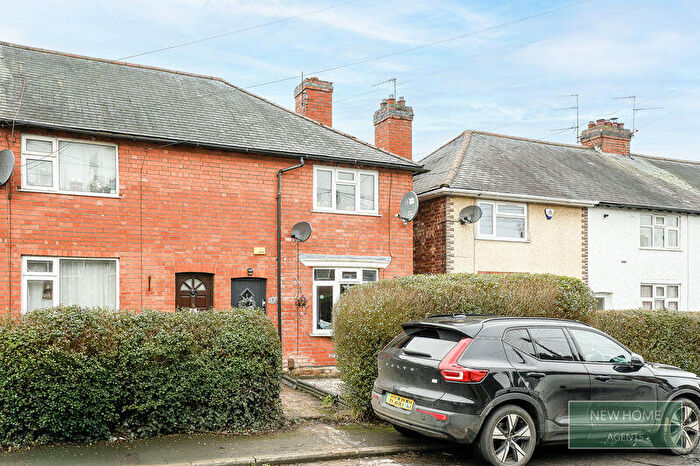
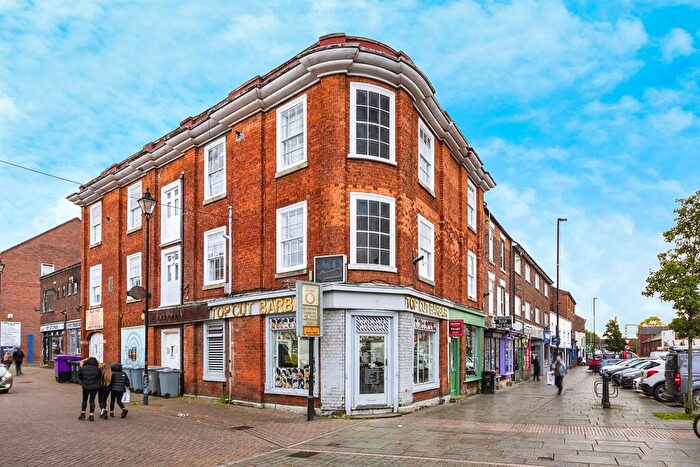
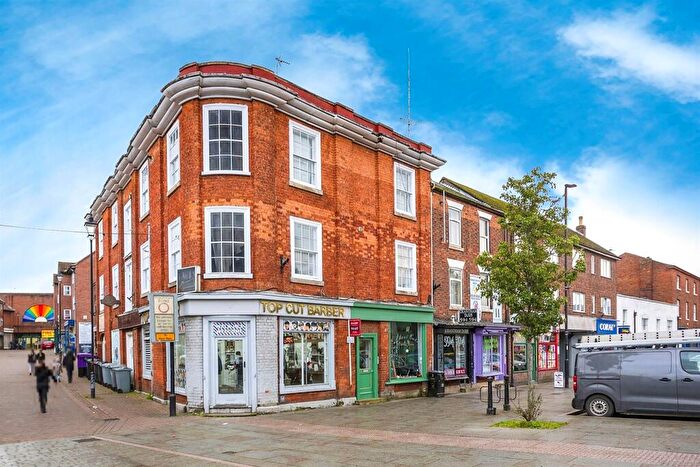
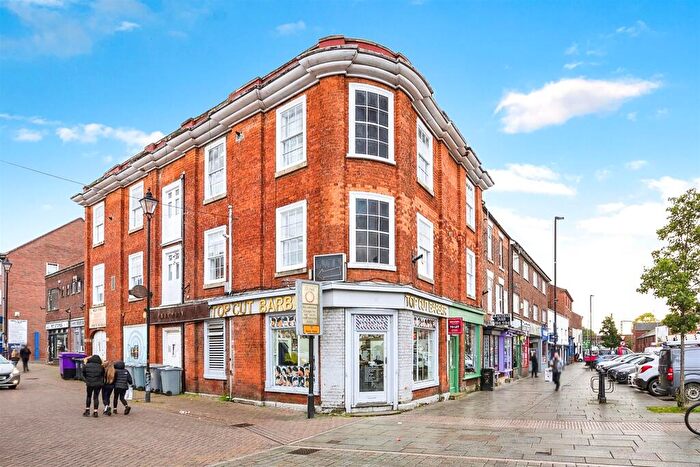
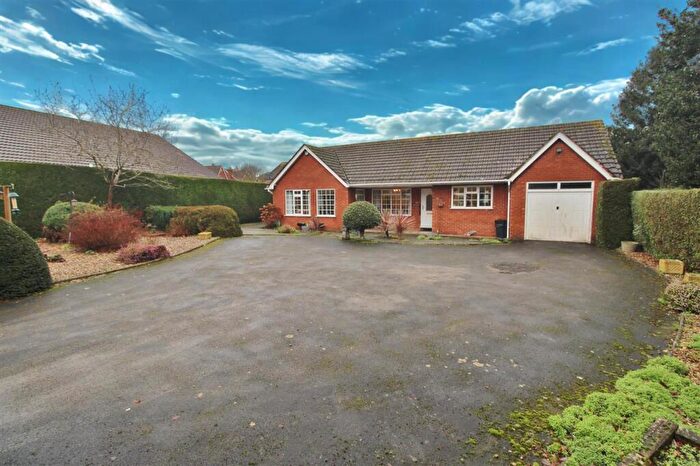
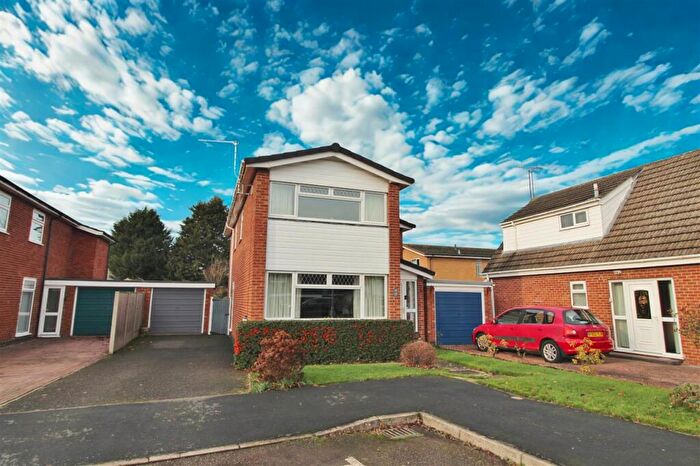
Houses for sale & to rent in Greyfriars, Grantham
House Prices in Greyfriars
Properties in Greyfriars have an average house price of £235,395.00 and had 159 Property Transactions within the last 3 years¹.
Greyfriars is an area in Grantham, Lincolnshire with 1,656 households², where the most expensive property was sold for £735,325.00.
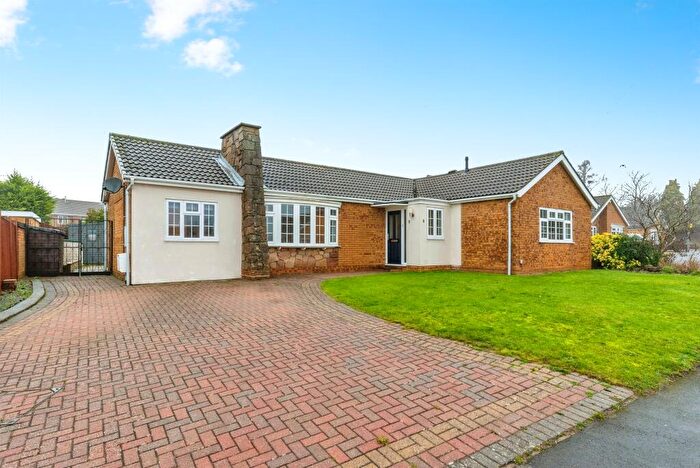
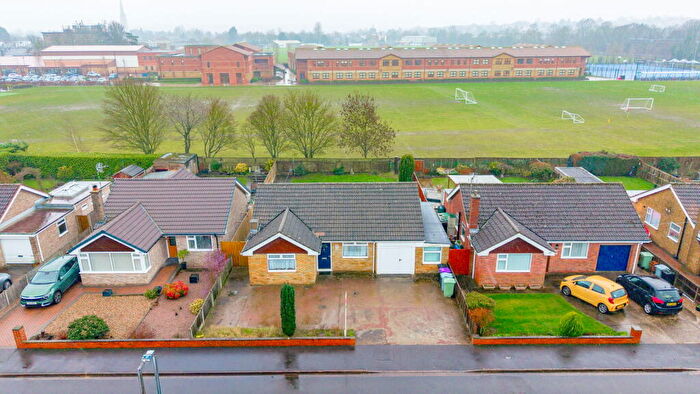
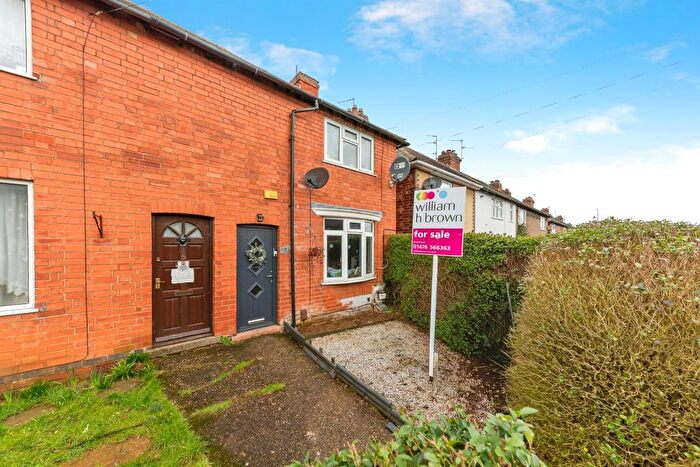
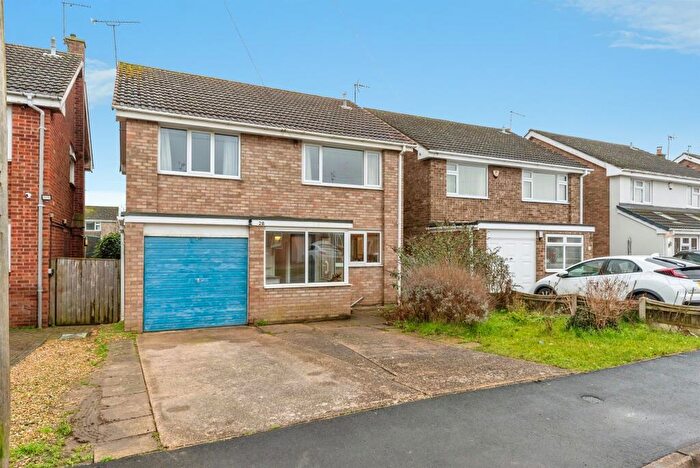
Properties for sale in Greyfriars
Roads and Postcodes in Greyfriars
Navigate through our locations to find the location of your next house in Greyfriars, Grantham for sale or to rent.
| Streets | Postcodes |
|---|---|
| Applewood Drive | NG31 8QN |
| Arnold Avenue | NG31 8HN |
| Arnoldfield Court | NG31 8GL |
| Ashley Drive | NG31 8JL |
| Avenue Road | NG31 6TA NG31 6TF NG31 6TH |
| Barrowby Road | NG31 6PD |
| Beaumont Drive | NG31 8QG |
| Bell Close | NG31 8GJ |
| Birchwood Close | NG31 8GP |
| Bramblewood Close | NG31 8QH |
| Briarwood Close | NG31 8GW |
| Broomwood Close | NG31 8GU |
| Cambrian Close | NG31 8GQ |
| Castlegate | NG31 6SE NG31 6SN NG31 6SW |
| Cedarwood Close | NG31 8QJ |
| Cherrywood Drive | NG31 8QL |
| Cheviot Close | NG31 8GF |
| Chiltern Close | NG31 8HG |
| Cliffe Road | NG31 8HL NG31 8HP NG31 8HS NG31 8HW |
| Cochran Close | NG31 8QD |
| Cotswold Drive | NG31 8GE |
| East Street | NG31 6QW |
| Elmer Street North | NG31 6RE |
| Finkin Street | NG31 6QZ |
| George Street | NG31 6QL |
| Gonerby Court | NG31 8HT |
| Gonerby Road | NG31 8HE NG31 8HQ NG31 8HU |
| Grey Friars | NG31 6PG |
| Grove End Road | NG31 6TL |
| Hazelwood Drive | NG31 8GX NG31 8GZ |
| High Street | NG31 6NN NG31 6NR NG31 6PN |
| Hollywood Close | NG31 8GR |
| Kimberley Terrace | NG31 8JH |
| Kings Gardens | NG31 8TY |
| Ladysmith Terrace | NG31 8JG |
| Lewes Avenue | NG31 8UQ |
| Lilacwood Drive | NG31 8GS |
| Lynden Avenue | NG31 8JW |
| Malim Way | NG31 8QF |
| Maltings Lane | NG31 8JD NG31 8JE |
| Malvern Drive | NG31 8GA |
| Maplewood Close | NG31 8GY |
| Market Place | NG31 6LP |
| Mendip Close | NG31 8GB |
| Mount Street | NG31 6PE |
| New Row | NG31 8HJ |
| New Street | NG31 8FP |
| North Parade | NG31 8AT |
| North Street | NG31 6NU |
| Ogden Square | NG31 8HH |
| Orangewood Close | NG31 8QW |
| Orchard Close | NG31 8HD |
| Ostler Close | NG31 8QE |
| Palmwood Close | NG31 8GN |
| Peachwood Close | NG31 8QP |
| Pinewood Drive | NG31 8QQ |
| Pretoria Road | NG31 8JQ |
| Riverside | NG31 6QT |
| Rowanwood Drive | NG31 8GT |
| St Peters Hill | NG31 6QB NG31 6QF |
| Stephenson Avenue | NG31 8QA NG31 8QB |
| Swallows Close | NG31 8HF |
| The Grange | NG31 6PA |
| The Haverlands | NG31 8HB |
| Vale Road | NG31 8HR |
| Vernon Avenue | NG31 8JJ |
| Vine Street | NG31 6RQ |
| Vivian Close | NG31 8JN |
| Webster Way | NG31 8GH |
| Welby Street | NG31 6DY NG31 6EA |
| Welham Street | NG31 6QQ NG31 6QU |
| Westgate | NG31 6LE NG31 6LY |
Transport near Greyfriars
- FAQ
- Price Paid By Year
- Property Type Price
Frequently asked questions about Greyfriars
What is the average price for a property for sale in Greyfriars?
The average price for a property for sale in Greyfriars is £235,395. This amount is 7% lower than the average price in Grantham. There are 1,082 property listings for sale in Greyfriars.
What streets have the most expensive properties for sale in Greyfriars?
The streets with the most expensive properties for sale in Greyfriars are Gonerby Court at an average of £735,325, Maplewood Close at an average of £576,250 and North Parade at an average of £430,000.
What streets have the most affordable properties for sale in Greyfriars?
The streets with the most affordable properties for sale in Greyfriars are Welby Street at an average of £58,000, New Street at an average of £92,333 and Market Place at an average of £96,000.
Which train stations are available in or near Greyfriars?
Some of the train stations available in or near Greyfriars are Grantham, Bottesford and Ancaster.
Property Price Paid in Greyfriars by Year
The average sold property price by year was:
| Year | Average Sold Price | Price Change |
Sold Properties
|
|---|---|---|---|
| 2025 | £230,205 | -5% |
60 Properties |
| 2024 | £240,708 | 2% |
53 Properties |
| 2023 | £236,043 | -12% |
46 Properties |
| 2022 | £263,229 | 21% |
61 Properties |
| 2021 | £206,779 | 11% |
76 Properties |
| 2020 | £183,177 | -9% |
59 Properties |
| 2019 | £198,794 | 4% |
58 Properties |
| 2018 | £190,760 | 10% |
69 Properties |
| 2017 | £172,379 | 11% |
64 Properties |
| 2016 | £152,898 | 1% |
70 Properties |
| 2015 | £151,748 | -10% |
82 Properties |
| 2014 | £166,553 | 5% |
85 Properties |
| 2013 | £157,490 | 7% |
66 Properties |
| 2012 | £146,099 | 7% |
46 Properties |
| 2011 | £135,768 | -7% |
46 Properties |
| 2010 | £144,985 | 10% |
45 Properties |
| 2009 | £131,146 | -22% |
49 Properties |
| 2008 | £160,225 | 0,4% |
78 Properties |
| 2007 | £159,554 | -6% |
101 Properties |
| 2006 | £169,244 | 18% |
106 Properties |
| 2005 | £138,862 | 2% |
77 Properties |
| 2004 | £136,656 | 13% |
109 Properties |
| 2003 | £118,739 | 22% |
98 Properties |
| 2002 | £92,071 | 18% |
114 Properties |
| 2001 | £75,647 | 10% |
142 Properties |
| 2000 | £68,364 | 0,3% |
118 Properties |
| 1999 | £68,160 | 11% |
125 Properties |
| 1998 | £60,609 | 12% |
114 Properties |
| 1997 | £53,583 | 1% |
121 Properties |
| 1996 | £53,276 | 1% |
86 Properties |
| 1995 | £52,638 | - |
106 Properties |
Property Price per Property Type in Greyfriars
Here you can find historic sold price data in order to help with your property search.
The average Property Paid Price for specific property types in the last three years are:
| Property Type | Average Sold Price | Sold Properties |
|---|---|---|
| Semi Detached House | £218,487.00 | 39 Semi Detached Houses |
| Detached House | £319,975.00 | 61 Detached Houses |
| Terraced House | £181,314.00 | 40 Terraced Houses |
| Flat | £112,407.00 | 19 Flats |

