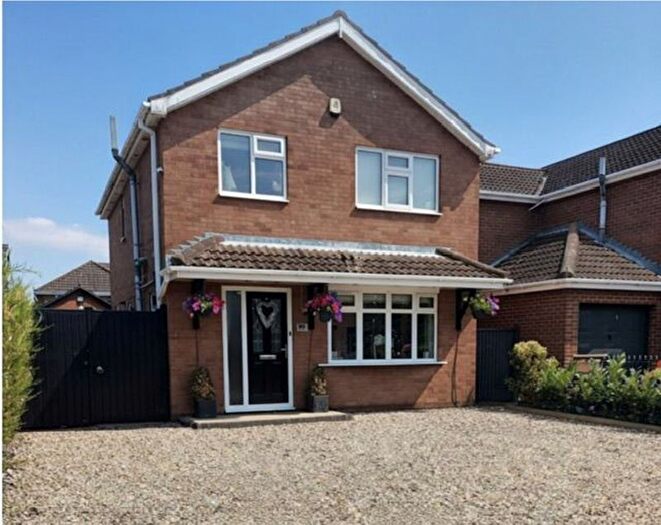
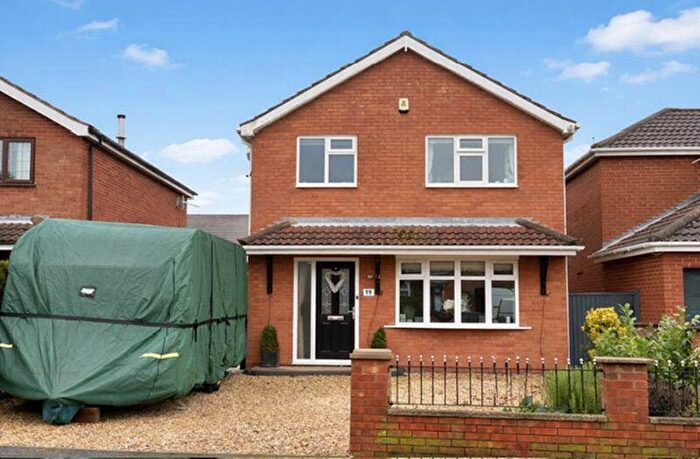
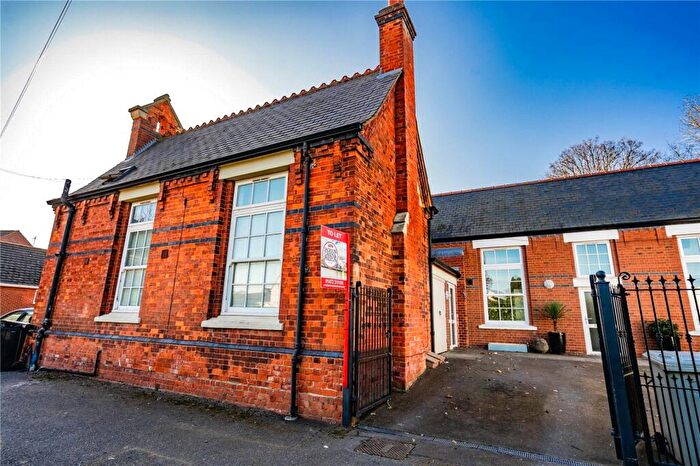
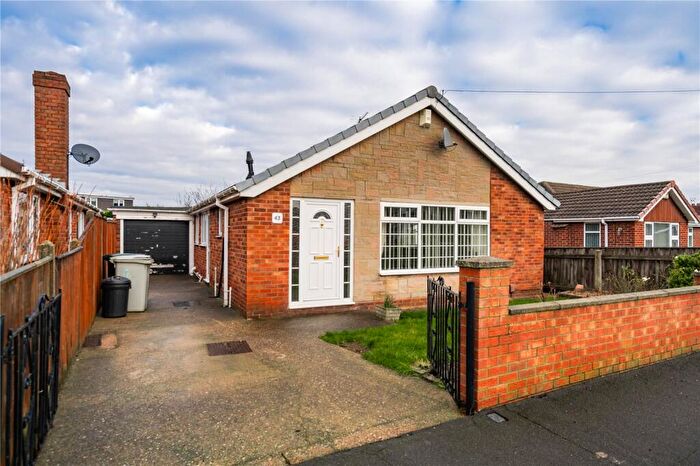
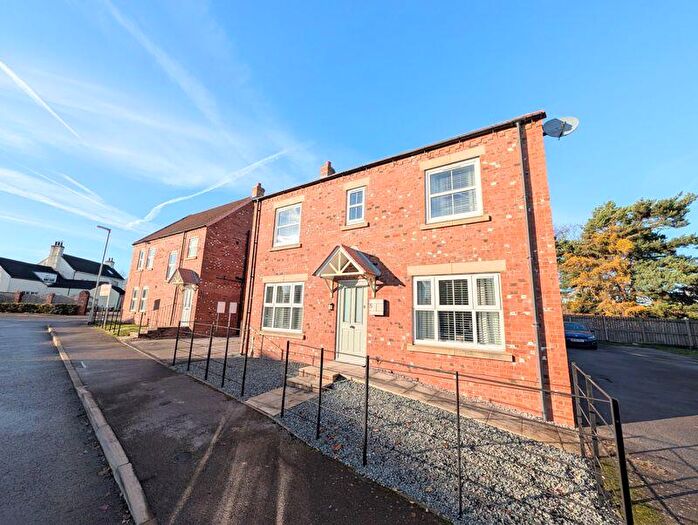
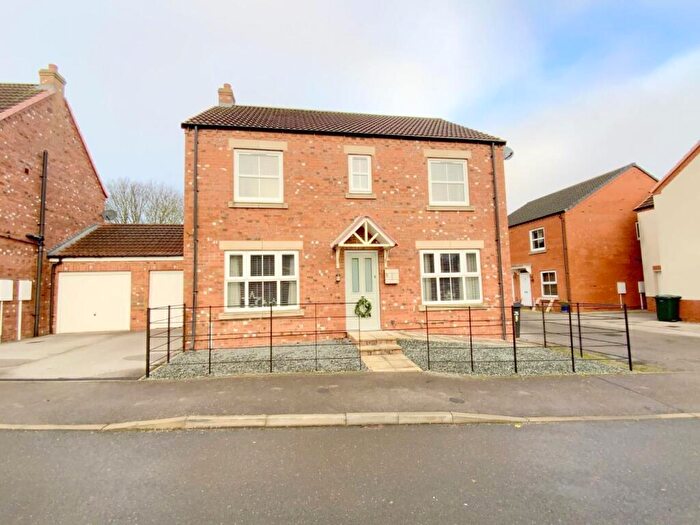
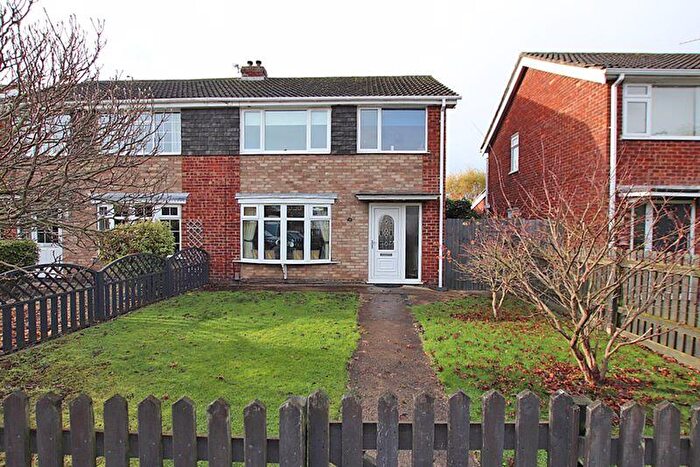
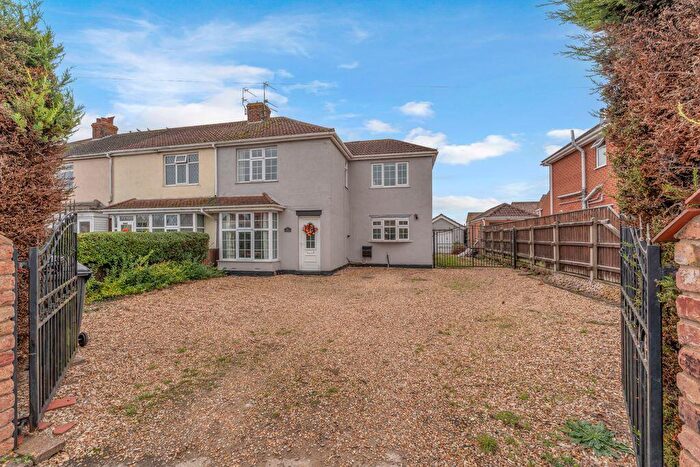
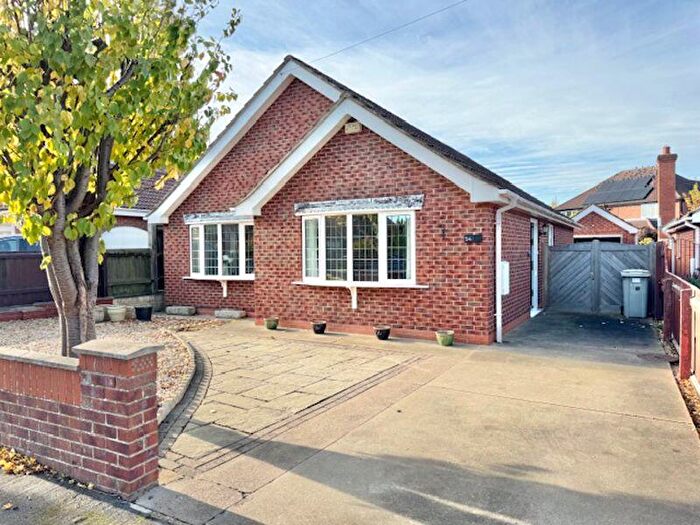
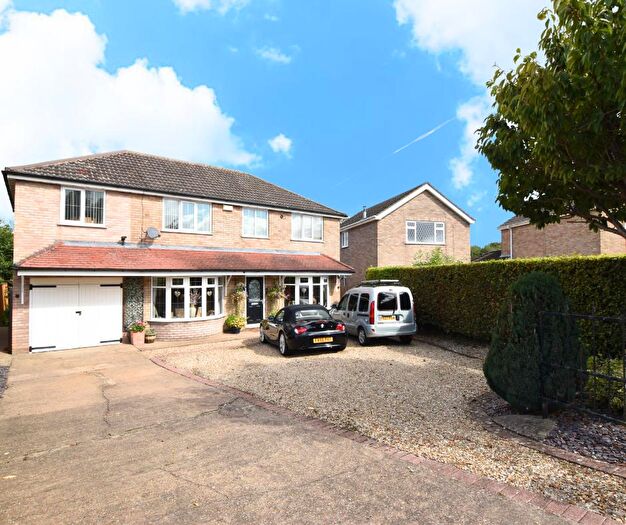
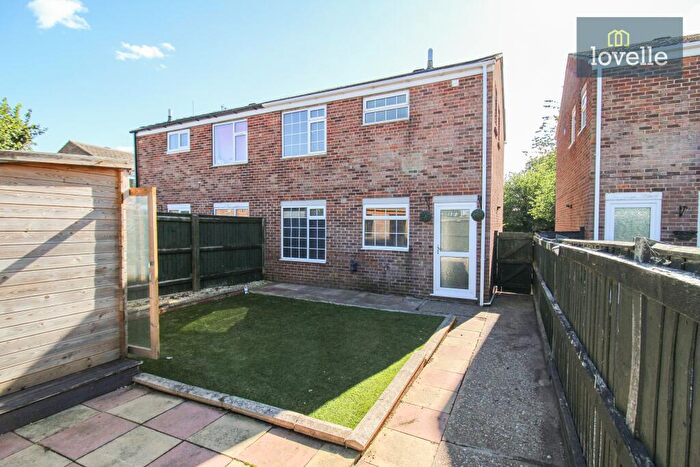
Houses for sale & to rent in Holton Le Clay, Grimsby
House Prices in Holton Le Clay
Properties in Holton Le Clay have an average house price of £209,552.00 and had 124 Property Transactions within the last 3 years¹.
Holton Le Clay is an area in Grimsby, Lincolnshire with 1,542 households², where the most expensive property was sold for £542,000.00.
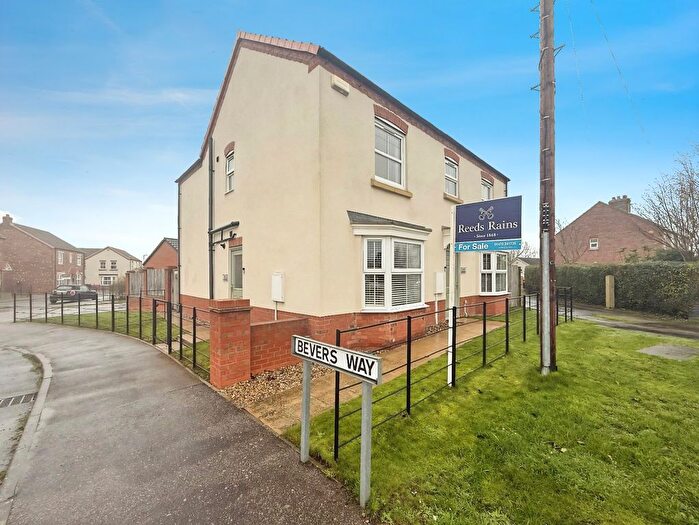
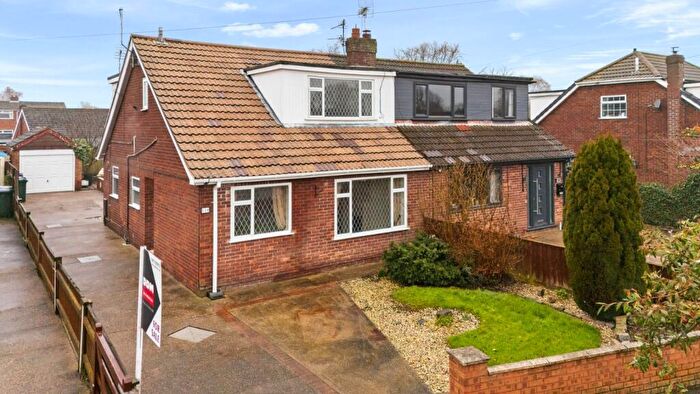
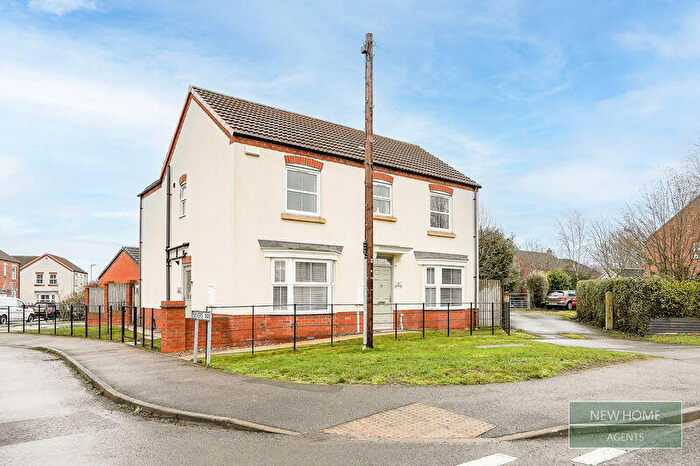
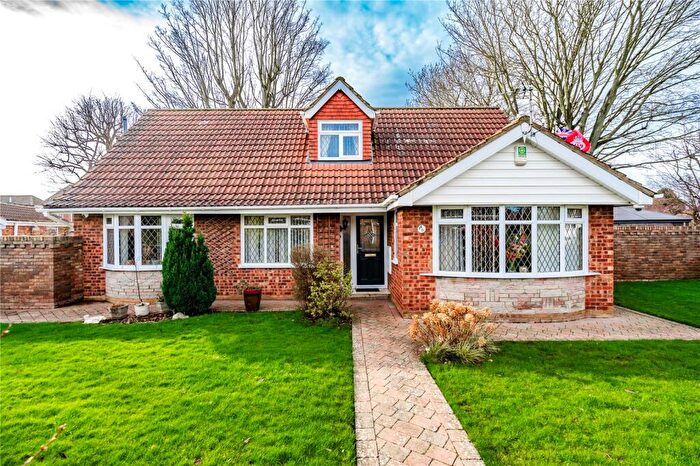
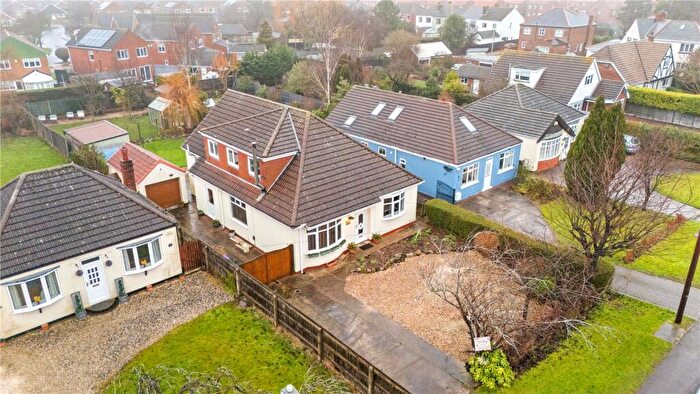
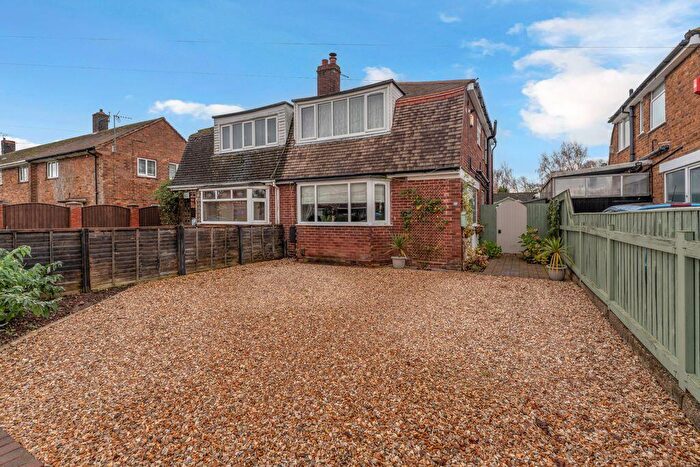
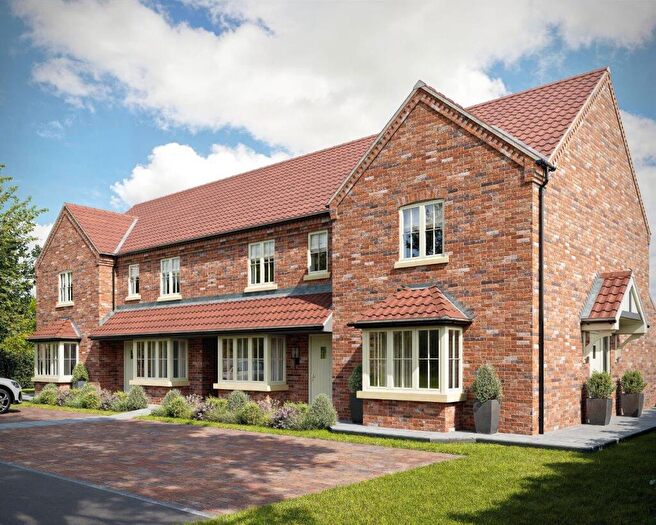
Properties for sale in Holton Le Clay
Roads and Postcodes in Holton Le Clay
Navigate through our locations to find the location of your next house in Holton Le Clay, Grimsby for sale or to rent.
| Streets | Postcodes |
|---|---|
| Ashby Close | DN36 5BD |
| Beaumonde | DN36 5HH |
| Beechgrove | DN36 5YL |
| Belmont | DN36 5HQ |
| Beverley Close | DN36 5HG |
| Bevers Way | DN36 5FH |
| Cambrian Way | DN36 5DE |
| Campions Close | DN36 5HF |
| Carmen Crescent | DN36 5DD |
| Church Close | DN36 5FD |
| Church Lane | DN36 5AH DN36 5AL DN36 5AQ DN36 5AW |
| Church Walk | DN36 5AN |
| Clay Lane | DN36 5AG |
| Eastfield Rise | DN36 5AJ |
| Edinburgh Drive | DN36 5DF |
| Evendine Court | DN36 5BB |
| Fenwick Court | DN36 5DG |
| Forge Way | DN36 5YB |
| Freeman Court | DN36 5DB |
| Garthway | DN36 5DW |
| Glebe Close | DN36 5YA |
| Grainsby Avenue | DN36 5BL DN36 5BP DN36 5DA |
| Heron Way | DN36 5YD |
| Holton Court | DN36 5EE DN36 5EF |
| Holton Mount | DN36 5EB DN36 5EH DN36 5EN DN36 5EQ |
| Kristen Turton Close | DN36 5FG |
| Langton Road | DN36 5AZ DN36 5BA DN36 5BE DN36 5BH DN36 5BJ DN36 5BY DN36 5BZ |
| Lime Grove | DN36 5YH |
| Lindsey Drive | DN36 5EX DN36 5EZ DN36 5HA DN36 5HB DN36 5HE |
| Louth Road | DN36 5AA DN36 5AB DN36 5AD DN36 5AE DN36 5AF DN36 5DZ DN36 5EA DN36 5HL DN36 5HN |
| Magnolia Drive | DN36 5YR |
| Mount Pleasant | DN36 5ED |
| Newstead Avenue | DN36 5BQ DN36 5BU DN36 5BX |
| Nursery Gardens | DN36 5FB |
| Osbourne Drive | DN36 5DP DN36 5DS |
| Pelham Road | DN36 5ES DN36 5EU |
| Peppercorn Walk | DN36 5DQ |
| Picksley Crescent | DN36 5DR DN36 5YE DN36 5YF |
| Pinfold Gardens | DN36 5YJ |
| Pinfold Lane | DN36 5DH DN36 5DL DN36 5DN DN36 5DT DN36 5DU |
| Ravendale Close | DN36 5BN |
| Riby Court | DN36 5BT |
| Silver Street | DN36 5DX DN36 5DY |
| South View | DN36 5BW |
| Southfield Road | DN36 5YG DN36 5YQ |
| St Peters Close | DN36 5DJ |
| Station Road | DN36 5HU |
| Tetney Lane | DN36 5AP DN36 5AR DN36 5AS DN36 5AT DN36 5AU DN36 5AX DN36 5AY |
| The Crescent | DN36 5EL DN36 5ER DN36 5EW DN36 5HJ |
| Wayside Close | DN36 5XZ |
| Whisby Court | DN36 5BG |
| Wold View | DN36 5EG DN36 5EJ |
| Worsley Close | DN36 5EY |
| Yarborough Close | DN36 5ET |
Transport near Holton Le Clay
- FAQ
- Price Paid By Year
- Property Type Price
Frequently asked questions about Holton Le Clay
What is the average price for a property for sale in Holton Le Clay?
The average price for a property for sale in Holton Le Clay is £209,552. This amount is 13% lower than the average price in Grimsby. There are 206 property listings for sale in Holton Le Clay.
What streets have the most expensive properties for sale in Holton Le Clay?
The streets with the most expensive properties for sale in Holton Le Clay are Edinburgh Drive at an average of £330,000, Lindsey Drive at an average of £284,100 and Fenwick Court at an average of £279,316.
What streets have the most affordable properties for sale in Holton Le Clay?
The streets with the most affordable properties for sale in Holton Le Clay are Beverley Close at an average of £96,990, South View at an average of £109,780 and Freeman Court at an average of £150,000.
Which train stations are available in or near Holton Le Clay?
Some of the train stations available in or near Holton Le Clay are Cleethorpes, Grimsby Town and New Clee.
Property Price Paid in Holton Le Clay by Year
The average sold property price by year was:
| Year | Average Sold Price | Price Change |
Sold Properties
|
|---|---|---|---|
| 2025 | £187,363 | -11% |
37 Properties |
| 2024 | £208,269 | -11% |
48 Properties |
| 2023 | £232,181 | -0,3% |
39 Properties |
| 2022 | £232,951 | 14% |
68 Properties |
| 2021 | £200,106 | 18% |
74 Properties |
| 2020 | £165,056 | -6% |
69 Properties |
| 2019 | £175,385 | 2% |
66 Properties |
| 2018 | £171,169 | 4% |
71 Properties |
| 2017 | £164,764 | 4% |
64 Properties |
| 2016 | £158,501 | -0,2% |
67 Properties |
| 2015 | £158,860 | 6% |
66 Properties |
| 2014 | £149,859 | 1% |
70 Properties |
| 2013 | £148,848 | 6% |
59 Properties |
| 2012 | £140,160 | -12% |
52 Properties |
| 2011 | £156,568 | 2% |
42 Properties |
| 2010 | £153,858 | 3% |
43 Properties |
| 2009 | £148,825 | 2% |
44 Properties |
| 2008 | £146,097 | -10% |
39 Properties |
| 2007 | £161,252 | 9% |
88 Properties |
| 2006 | £147,497 | 3% |
84 Properties |
| 2005 | £143,028 | 14% |
43 Properties |
| 2004 | £123,432 | 14% |
71 Properties |
| 2003 | £106,013 | 22% |
71 Properties |
| 2002 | £82,313 | 24% |
73 Properties |
| 2001 | £62,289 | 1% |
82 Properties |
| 2000 | £61,592 | 6% |
64 Properties |
| 1999 | £57,856 | -2% |
82 Properties |
| 1998 | £58,751 | 9% |
69 Properties |
| 1997 | £53,678 | 1% |
85 Properties |
| 1996 | £53,014 | 15% |
81 Properties |
| 1995 | £44,928 | - |
67 Properties |
Property Price per Property Type in Holton Le Clay
Here you can find historic sold price data in order to help with your property search.
The average Property Paid Price for specific property types in the last three years are:
| Property Type | Average Sold Price | Sold Properties |
|---|---|---|
| Semi Detached House | £172,139.00 | 36 Semi Detached Houses |
| Detached House | £249,152.00 | 73 Detached Houses |
| Terraced House | £147,500.00 | 6 Terraced Houses |
| Flat | £79,372.00 | 9 Flats |

