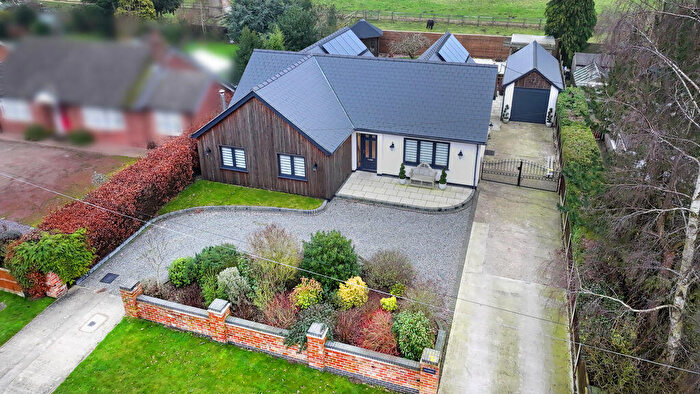
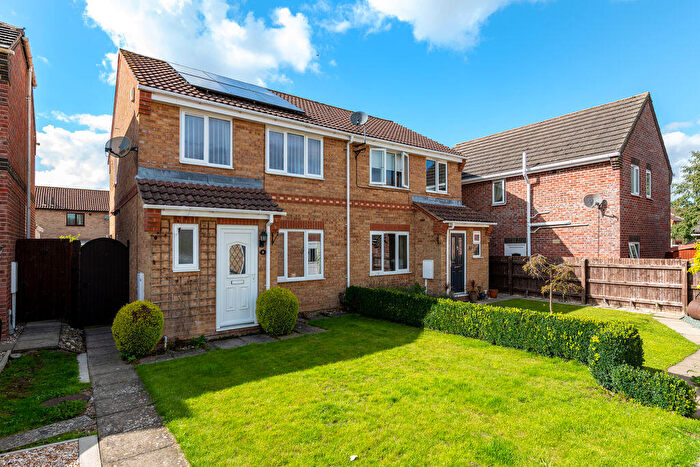
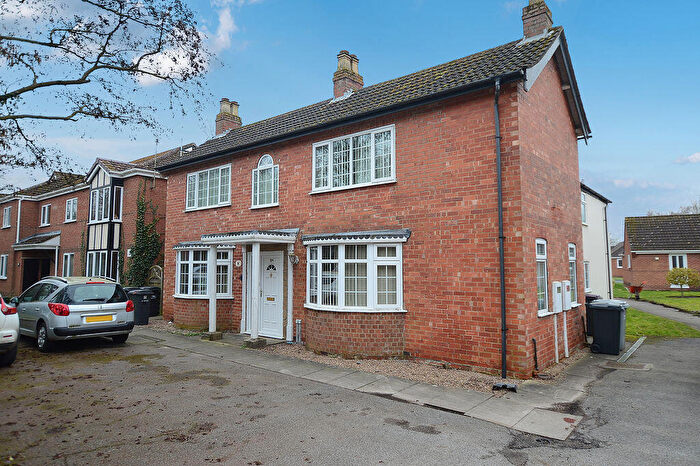
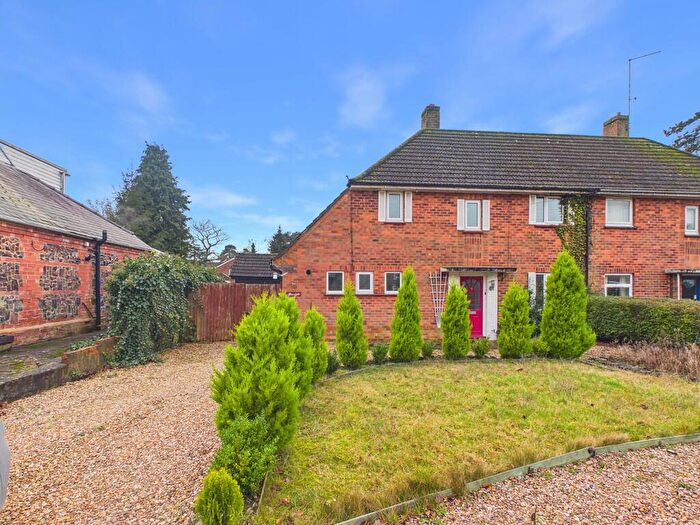
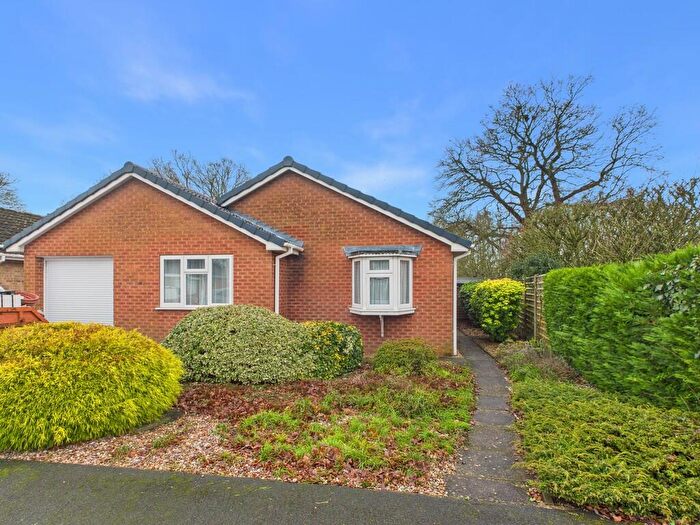
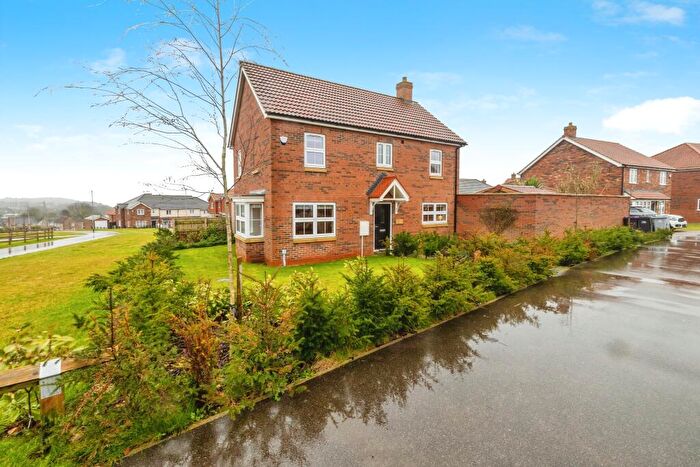
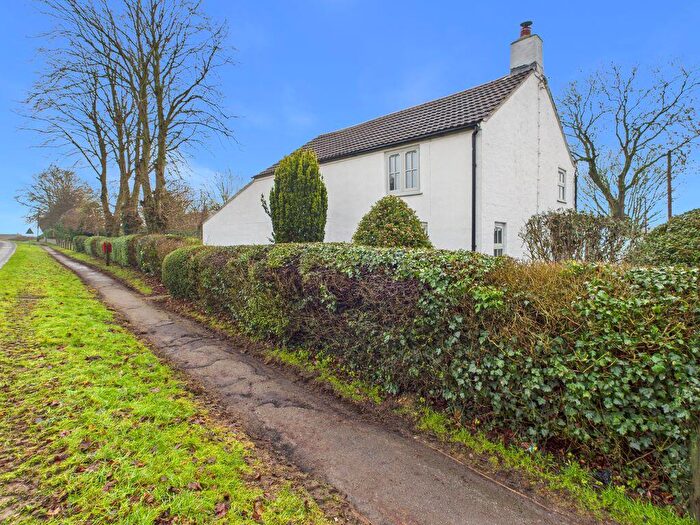
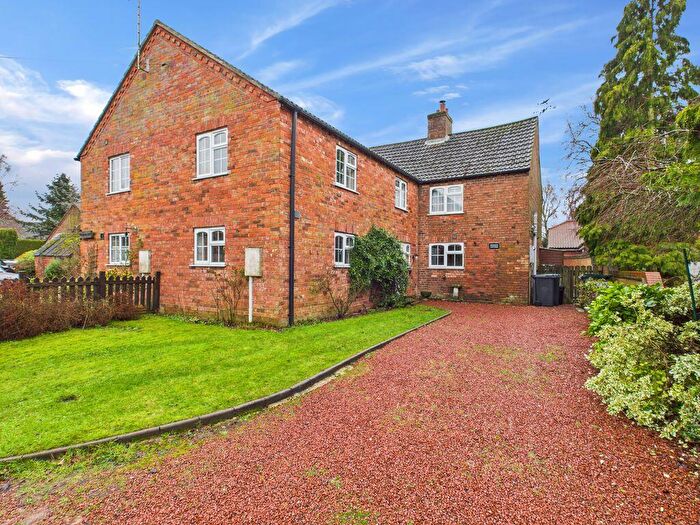
Houses for sale & to rent in Roughton, Horncastle
House Prices in Roughton
Properties in Roughton have an average house price of £409,204.00 and had 22 Property Transactions within the last 3 years¹.
Roughton is an area in Horncastle, Lincolnshire with 376 households², where the most expensive property was sold for £1,050,000.00.
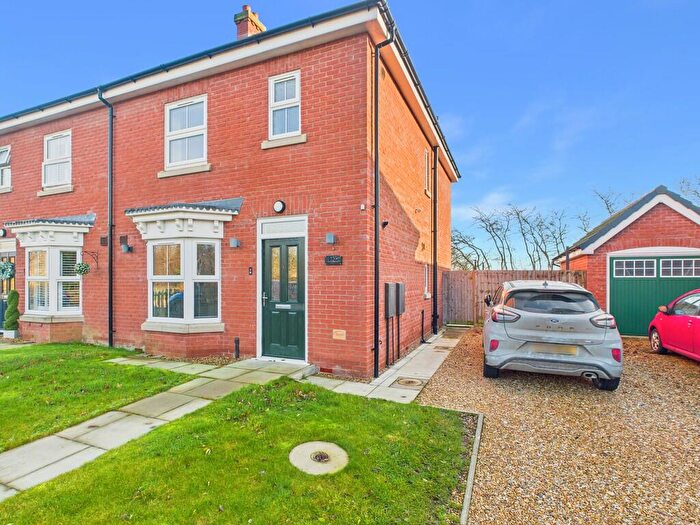
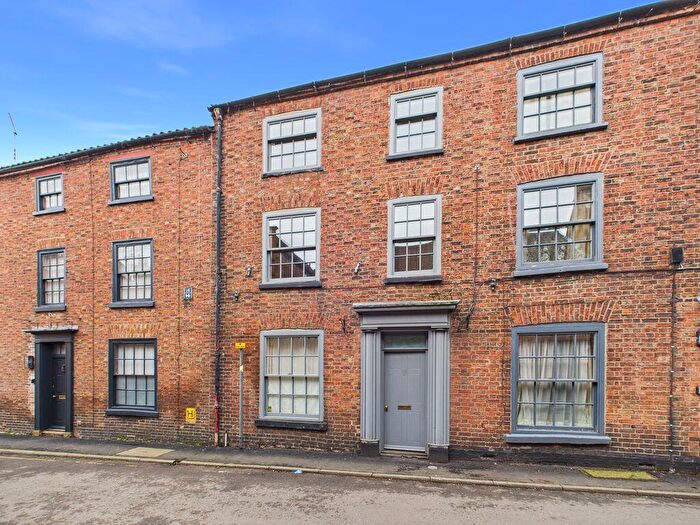
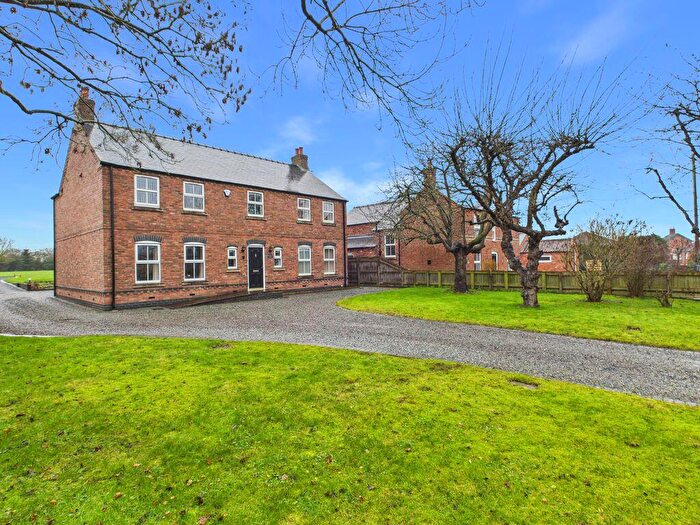
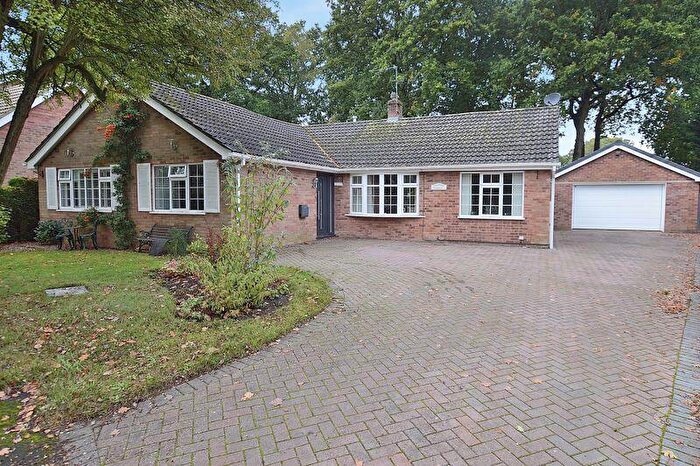
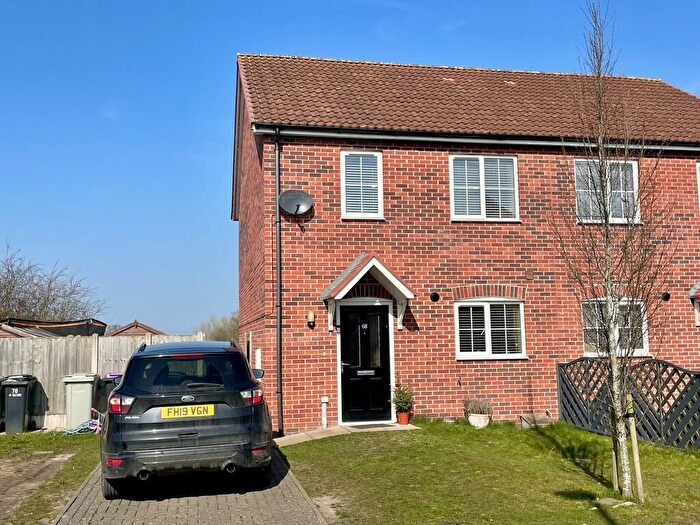
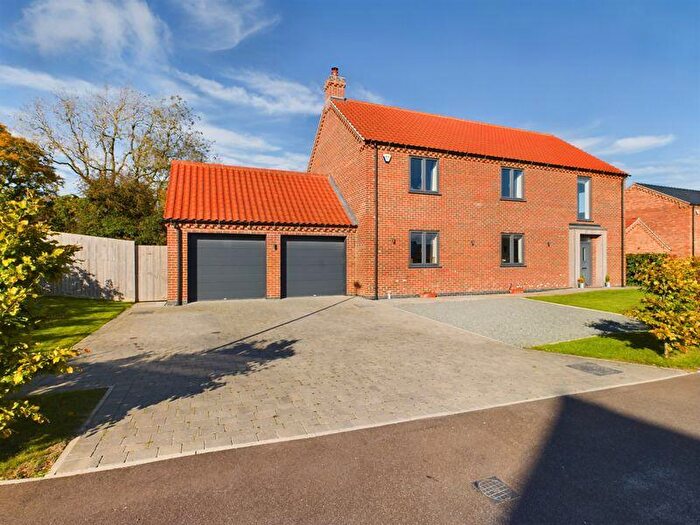
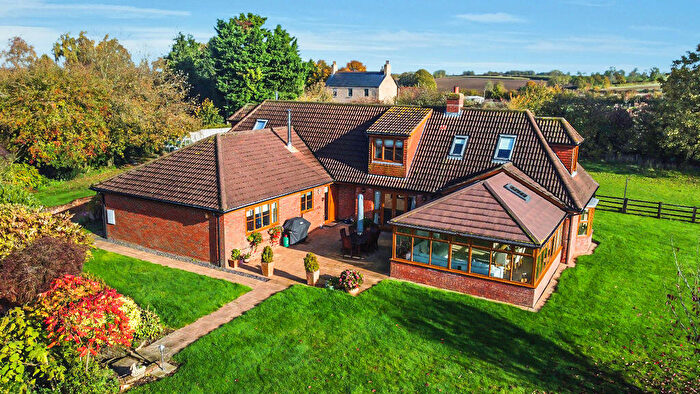
Properties for sale in Roughton
Roads and Postcodes in Roughton
Navigate through our locations to find the location of your next house in Roughton, Horncastle for sale or to rent.
| Streets | Postcodes |
|---|---|
| Chapel Lane | LN9 5NQ LN9 5RX |
| Church Lane | LN9 5JX LN9 5RS LN9 6JF |
| Fifty Acres | LN9 5LB |
| Grundys Lane | LN9 5SB |
| Hungram Lane | LN9 5NN |
| Lincoln Road | LN9 5ND LN9 5NS LN9 5NW LN9 5NA LN9 5NJ LN9 5NP |
| Main Road | LN9 5JT LN9 5JU LN9 6JE LN9 6JQ LN9 5JL |
| Mill Lane | LN9 5PJ |
| Ox Pasture Lane | LN9 5JY |
| Pinfold Lane | LN9 5RR |
| Priory View | LN9 5RU |
| Silver Street | LN9 5NH LN9 5RP |
| Sturton Lane | LN9 5NU |
| The Green | LN9 5RT |
| Top Yard | LN9 5PB |
| West Lane | LN9 5NG LN9 6JG |
| Wispington Road | LN9 5RL |
| Wood Enderby Lane | LN9 6JH |
| Woodland View | LN9 5LA |
| LN9 5JR LN9 5JZ LN9 5NE LN9 5NL LN9 5NR LN9 5NT LN9 5NX LN9 5PE LN9 5RJ LN9 5RN LN9 5RY LN9 5SA LN9 6JD LN9 5NB LN9 5NF LN9 5PA LN9 5PH LN9 5RW LN9 5RZ |
Transport near Roughton
- FAQ
- Price Paid By Year
- Property Type Price
Frequently asked questions about Roughton
What is the average price for a property for sale in Roughton?
The average price for a property for sale in Roughton is £409,204. This amount is 71% higher than the average price in Horncastle. There are 1,248 property listings for sale in Roughton.
What streets have the most expensive properties for sale in Roughton?
The streets with the most expensive properties for sale in Roughton are Chapel Lane at an average of £774,000 and Silver Street at an average of £337,000.
What streets have the most affordable properties for sale in Roughton?
The streets with the most affordable properties for sale in Roughton are Church Lane at an average of £169,875 and West Lane at an average of £306,666.
Which train stations are available in or near Roughton?
Some of the train stations available in or near Roughton are Metheringham, Market Rasen and Lincoln Central.
Property Price Paid in Roughton by Year
The average sold property price by year was:
| Year | Average Sold Price | Price Change |
Sold Properties
|
|---|---|---|---|
| 2025 | £456,750 | 7% |
10 Properties |
| 2024 | £422,857 | 30% |
7 Properties |
| 2023 | £295,000 | -18% |
5 Properties |
| 2022 | £348,192 | -8% |
13 Properties |
| 2021 | £376,700 | 28% |
15 Properties |
| 2020 | £272,500 | 24% |
5 Properties |
| 2019 | £207,582 | -50% |
8 Properties |
| 2018 | £310,597 | 30% |
9 Properties |
| 2017 | £217,400 | -22% |
10 Properties |
| 2016 | £264,153 | 36% |
13 Properties |
| 2015 | £169,840 | -60% |
22 Properties |
| 2014 | £272,352 | 10% |
17 Properties |
| 2013 | £245,150 | 15% |
13 Properties |
| 2012 | £208,562 | -14% |
8 Properties |
| 2011 | £238,416 | -0,1% |
6 Properties |
| 2010 | £238,687 | 8% |
8 Properties |
| 2009 | £219,983 | -39% |
3 Properties |
| 2008 | £305,785 | 16% |
7 Properties |
| 2007 | £257,158 | 19% |
16 Properties |
| 2006 | £208,714 | -2% |
14 Properties |
| 2005 | £212,842 | 9% |
7 Properties |
| 2004 | £193,126 | 27% |
15 Properties |
| 2003 | £140,714 | -6% |
14 Properties |
| 2002 | £149,300 | 39% |
13 Properties |
| 2001 | £91,423 | 5% |
13 Properties |
| 2000 | £86,546 | 9% |
16 Properties |
| 1999 | £78,666 | -23% |
9 Properties |
| 1998 | £96,541 | 15% |
12 Properties |
| 1997 | £81,925 | 32% |
14 Properties |
| 1996 | £55,613 | -59% |
11 Properties |
| 1995 | £88,621 | - |
9 Properties |
Property Price per Property Type in Roughton
Here you can find historic sold price data in order to help with your property search.
The average Property Paid Price for specific property types in the last three years are:
| Property Type | Average Sold Price | Sold Properties |
|---|---|---|
| Semi Detached House | £219,833.00 | 3 Semi Detached Houses |
| Detached House | £469,735.00 | 17 Detached Houses |
| Terraced House | £178,750.00 | 2 Terraced Houses |

