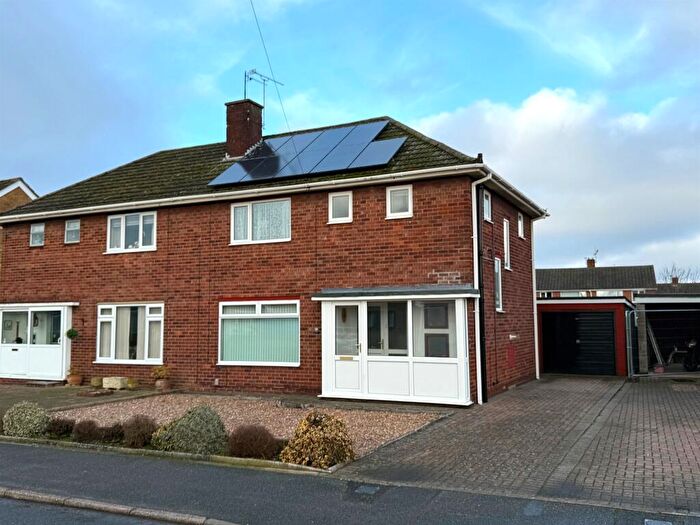
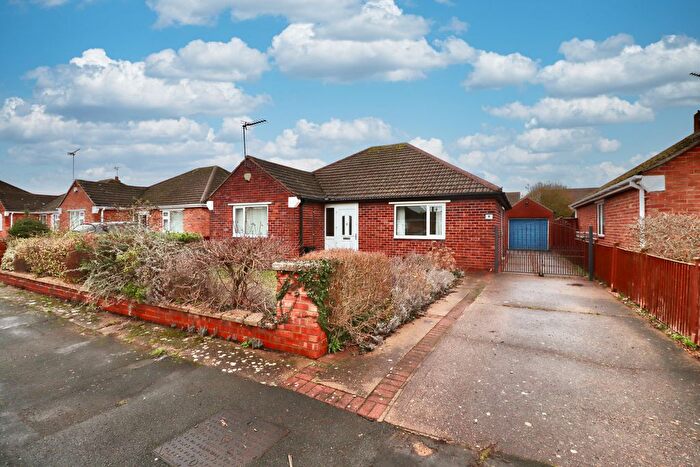
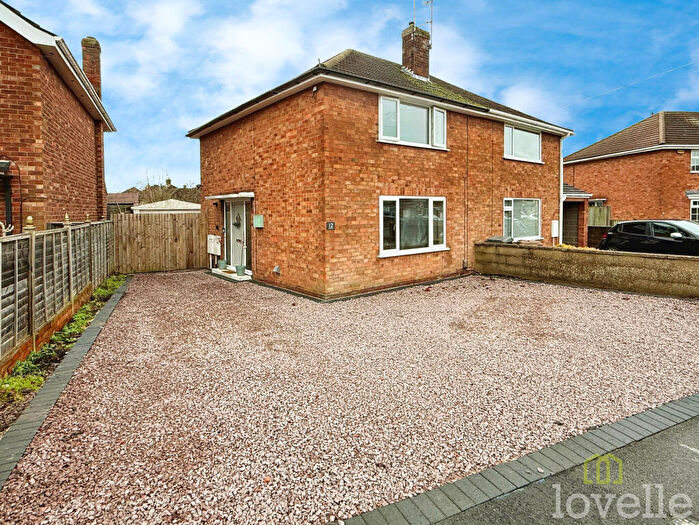
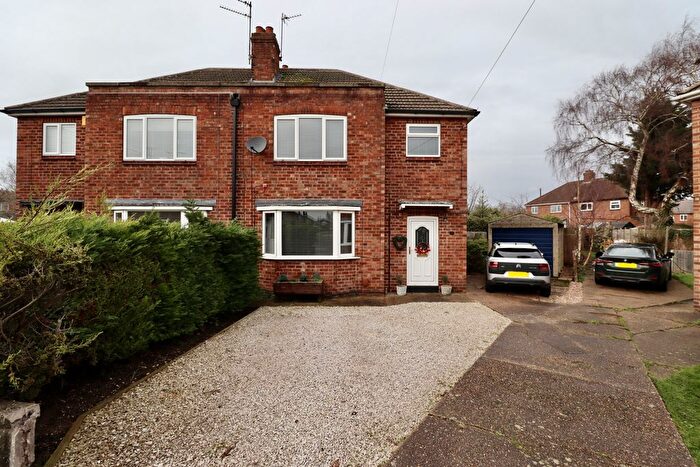
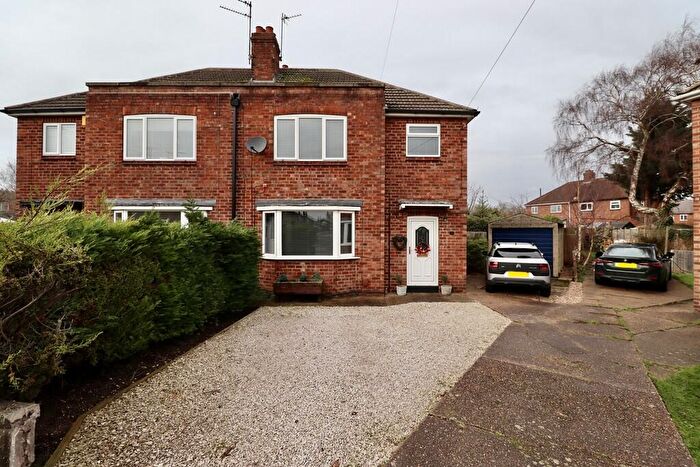
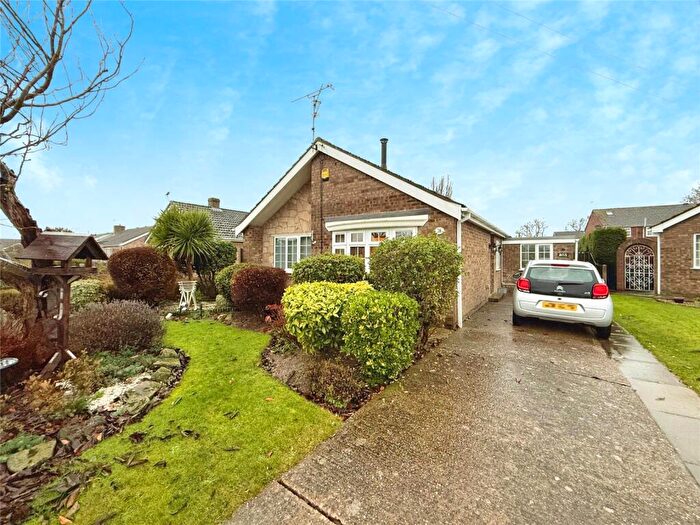
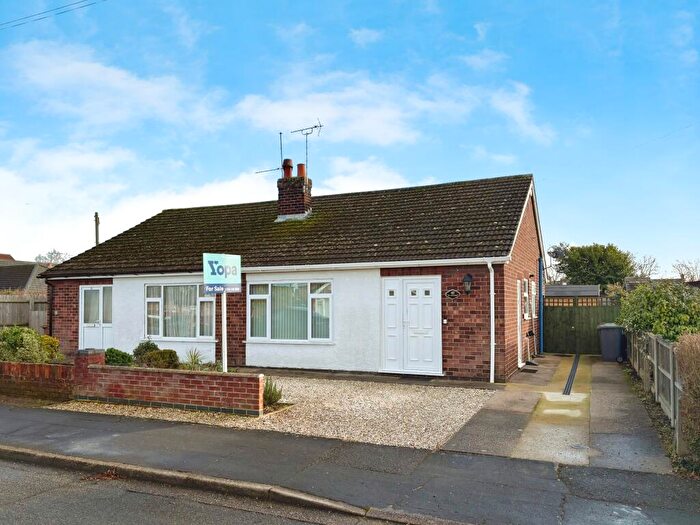
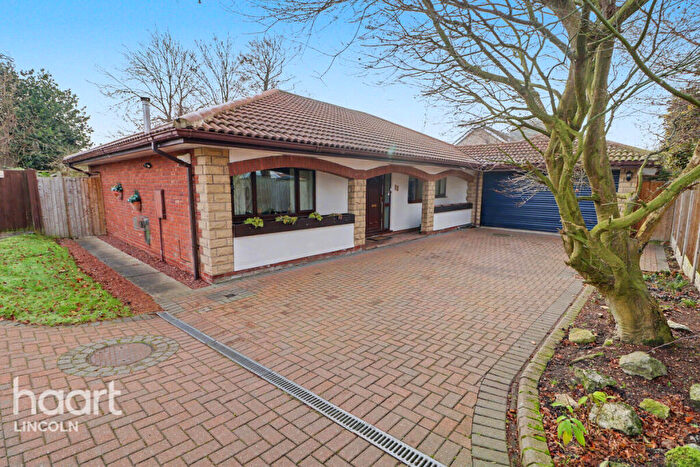
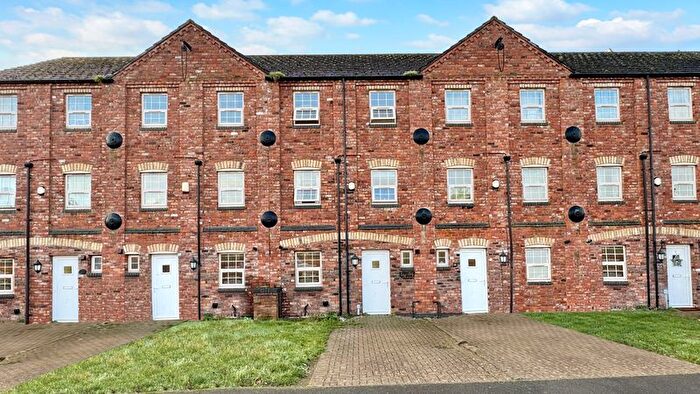
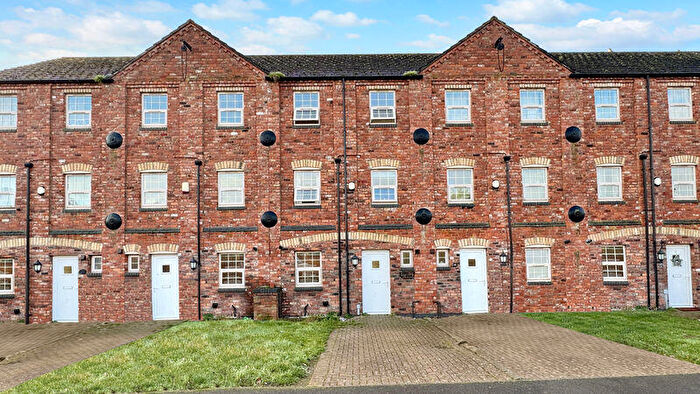
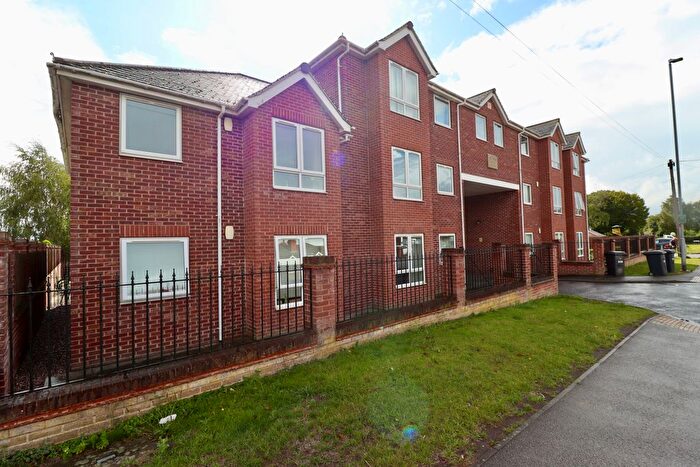
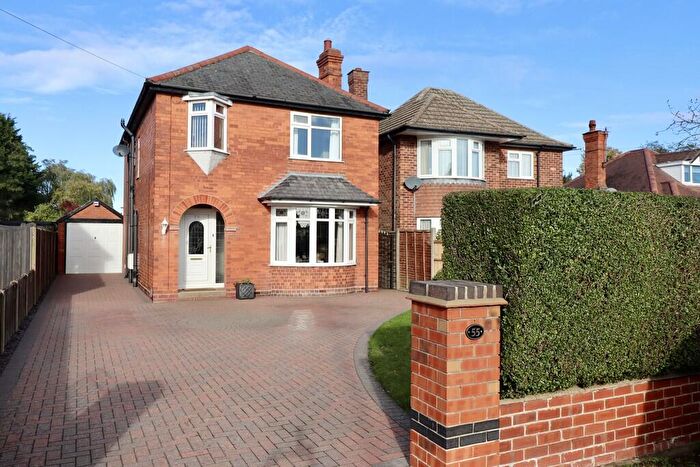
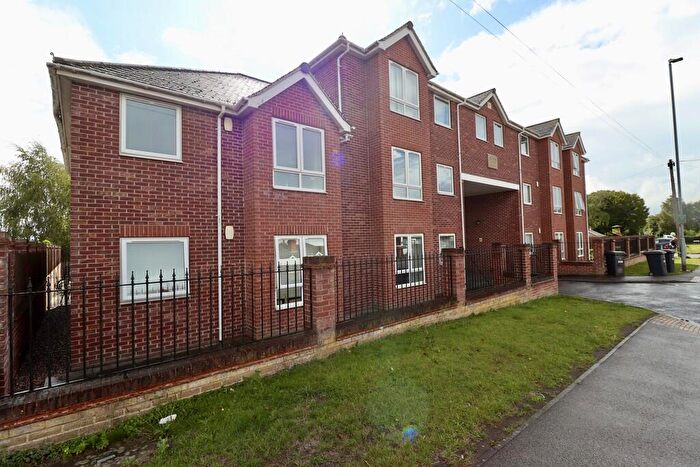
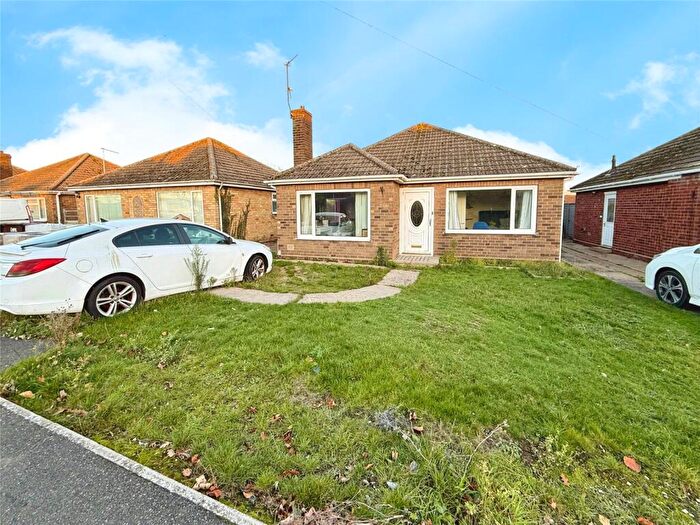
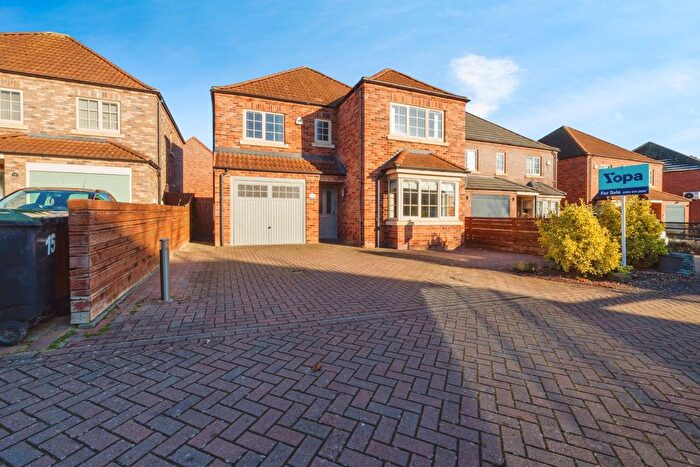
Houses for sale & to rent in North Hykeham Moor, Lincoln
House Prices in North Hykeham Moor
Properties in North Hykeham Moor have an average house price of £221,575.00 and had 124 Property Transactions within the last 3 years¹.
North Hykeham Moor is an area in Lincoln, Lincolnshire with 1,032 households², where the most expensive property was sold for £566,000.00.
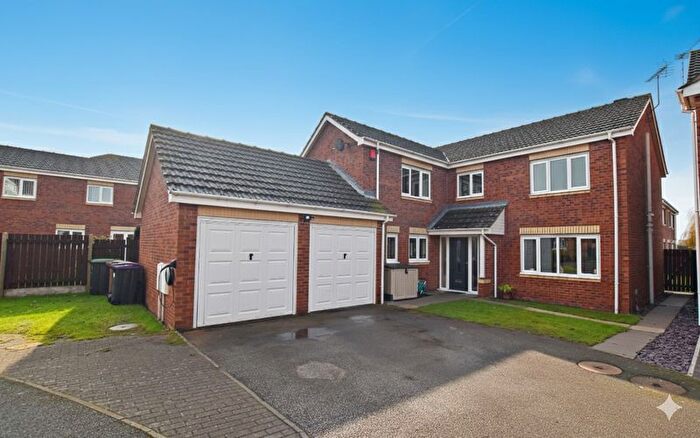
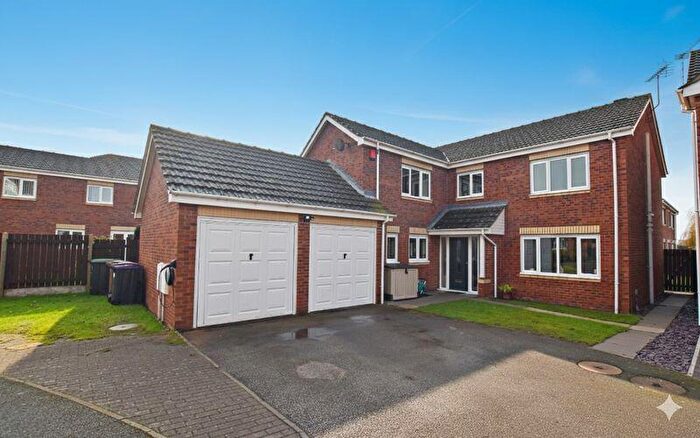
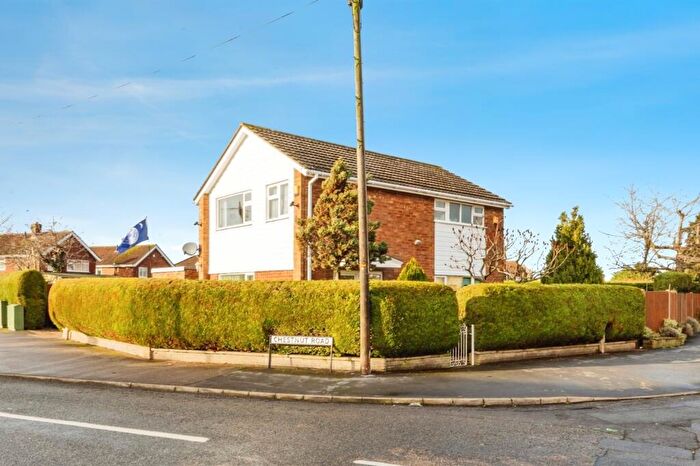
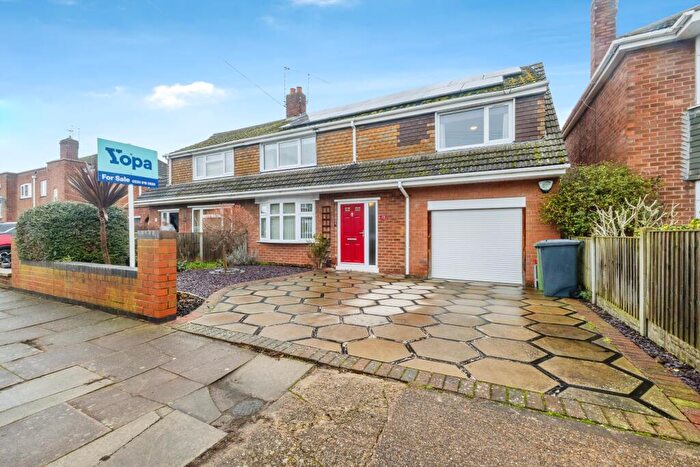
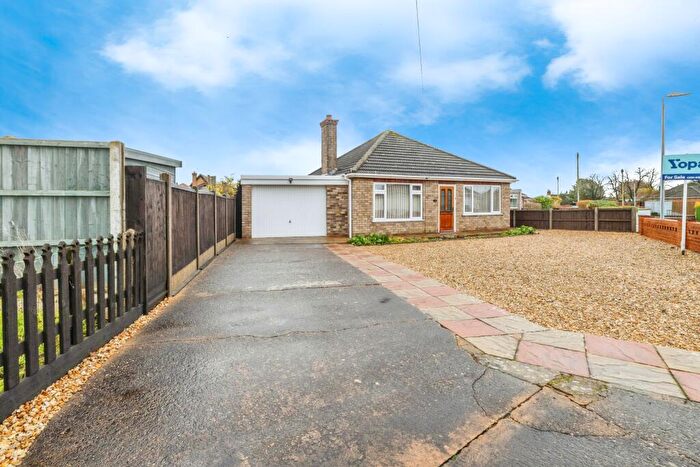
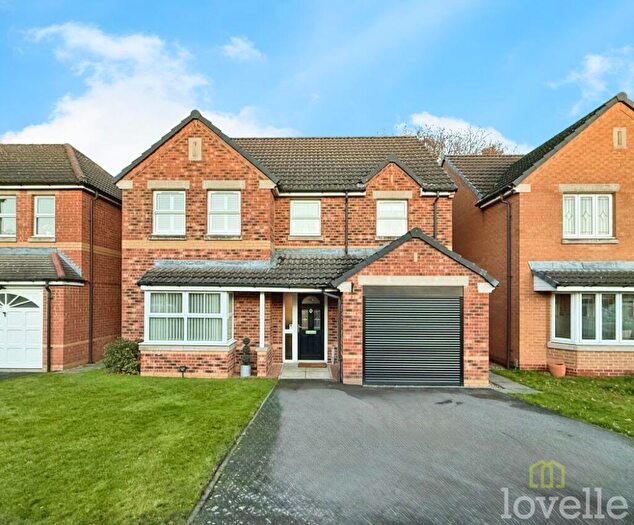
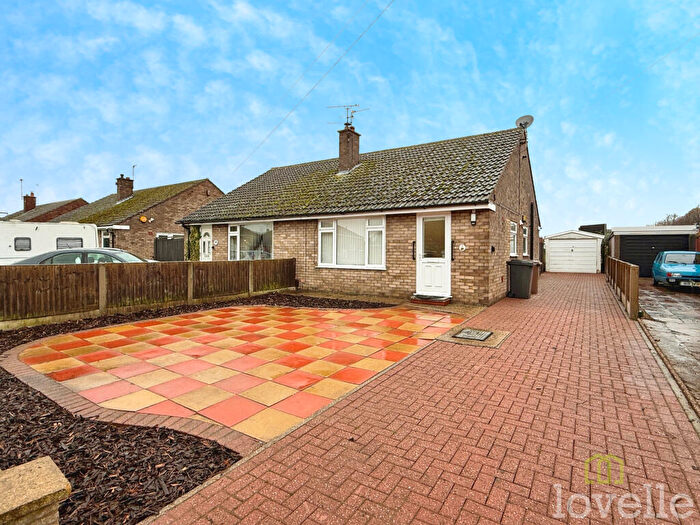
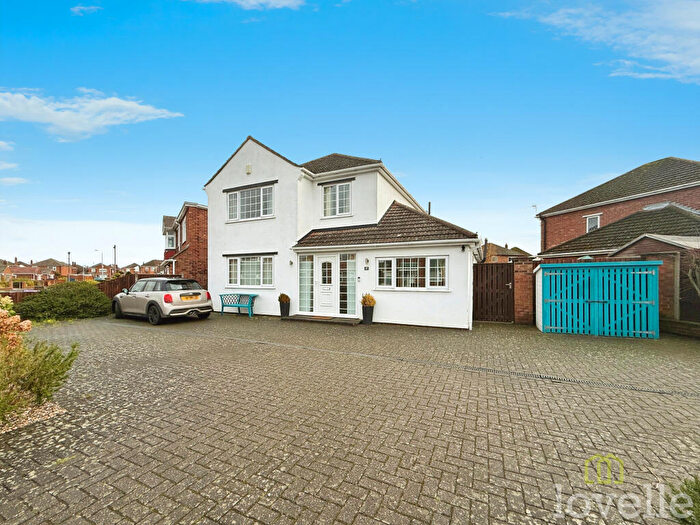
Properties for sale in North Hykeham Moor
Roads and Postcodes in North Hykeham Moor
Navigate through our locations to find the location of your next house in North Hykeham Moor, Lincoln for sale or to rent.
| Streets | Postcodes |
|---|---|
| Alexandre Avenue | LN6 8NR |
| Ambleside Park | LN6 8PA |
| Antonius Way | LN6 9AD |
| Bakewell Mews | LN6 8TU |
| Bamford Close | LN6 8PW |
| Birch Close | LN6 8LR |
| Bodmin Moor Close | LN6 9BB |
| Carlisle Close | LN6 8NS |
| Chatsworth Drive | LN6 8LD |
| Cherry Tree Close | LN6 8PS |
| Chestnut Road | LN6 8LS |
| Dore Avenue | LN6 8ED LN6 8LF LN6 8LL LN6 8LN LN6 8LP LN6 8LQ LN6 8LW |
| Dove Dale | LN6 8PL |
| Elm Close | LN6 8LT |
| Eyam Way | LN6 8PG |
| Fosseway Court | LN6 8FG |
| Gleedale | LN6 8PJ LN6 8PN LN6 8PQ |
| Green Lane | LN6 8NL |
| Hathersage Avenue | LN6 8LA LN6 8LJ |
| Hutson Drive | LN6 8EA LN6 8EB |
| Lincoln Road | LN6 8EE LN6 8NH LN6 8NU LN6 8NX LN6 8PB |
| Manor Road | LN6 8NP LN6 8NT |
| Matlock Drive | LN6 8PP LN6 8PR LN6 8PU |
| Millers Dale | LN6 8LH |
| Monsal Dale | LN6 8PH LN6 8PT |
| Montrose Close | LN6 8NW |
| Moor Lane | LN6 9AA LN6 9AB LN6 9AE LN6 9AF LN6 9AG LN6 9AX LN6 9AY LN6 9BA |
| Moorside Court | LN6 9XA |
| Nash Lane | LN6 9BD |
| Newark Road | LN6 8JX LN6 8LE LN6 8JY LN6 8LB |
| Peak Dale | LN6 8LG |
| Ravensmoor Close | LN6 9AZ |
| Robertson Road | LN6 8NN |
Transport near North Hykeham Moor
- FAQ
- Price Paid By Year
- Property Type Price
Frequently asked questions about North Hykeham Moor
What is the average price for a property for sale in North Hykeham Moor?
The average price for a property for sale in North Hykeham Moor is £221,575. This amount is 8% lower than the average price in Lincoln. There are 950 property listings for sale in North Hykeham Moor.
What streets have the most expensive properties for sale in North Hykeham Moor?
The streets with the most expensive properties for sale in North Hykeham Moor are Bakewell Mews at an average of £320,900, Moor Lane at an average of £254,722 and Bodmin Moor Close at an average of £252,800.
What streets have the most affordable properties for sale in North Hykeham Moor?
The streets with the most affordable properties for sale in North Hykeham Moor are Hutson Drive at an average of £153,166, Eyam Way at an average of £187,000 and Alexandre Avenue at an average of £191,000.
Which train stations are available in or near North Hykeham Moor?
Some of the train stations available in or near North Hykeham Moor are Hykeham, Lincoln Central and Swinderby.
Property Price Paid in North Hykeham Moor by Year
The average sold property price by year was:
| Year | Average Sold Price | Price Change |
Sold Properties
|
|---|---|---|---|
| 2025 | £218,973 | 4% |
19 Properties |
| 2024 | £210,695 | -0,3% |
32 Properties |
| 2023 | £211,410 | -12% |
28 Properties |
| 2022 | £236,735 | 10% |
45 Properties |
| 2021 | £213,673 | 3% |
58 Properties |
| 2020 | £206,670 | 10% |
56 Properties |
| 2019 | £186,248 | -5% |
42 Properties |
| 2018 | £196,474 | 7% |
41 Properties |
| 2017 | £183,004 | 10% |
44 Properties |
| 2016 | £165,383 | -3% |
33 Properties |
| 2015 | £170,828 | 15% |
33 Properties |
| 2014 | £145,050 | 3% |
38 Properties |
| 2013 | £140,528 | 3% |
16 Properties |
| 2012 | £136,791 | 8% |
17 Properties |
| 2011 | £126,301 | -10% |
34 Properties |
| 2010 | £139,328 | -3% |
28 Properties |
| 2009 | £143,849 | 10% |
33 Properties |
| 2008 | £129,164 | -9% |
21 Properties |
| 2007 | £140,370 | 0,3% |
52 Properties |
| 2006 | £139,948 | 2% |
54 Properties |
| 2005 | £137,430 | 2% |
31 Properties |
| 2004 | £134,478 | 15% |
39 Properties |
| 2003 | £114,469 | 21% |
36 Properties |
| 2002 | £90,813 | 20% |
56 Properties |
| 2001 | £72,373 | 14% |
50 Properties |
| 2000 | £62,410 | 17% |
54 Properties |
| 1999 | £51,829 | -8% |
50 Properties |
| 1998 | £55,775 | 3% |
35 Properties |
| 1997 | £53,828 | -2% |
54 Properties |
| 1996 | £54,855 | 13% |
51 Properties |
| 1995 | £47,842 | - |
29 Properties |
Property Price per Property Type in North Hykeham Moor
Here you can find historic sold price data in order to help with your property search.
The average Property Paid Price for specific property types in the last three years are:
| Property Type | Average Sold Price | Sold Properties |
|---|---|---|
| Semi Detached House | £212,005.00 | 70 Semi Detached Houses |
| Detached House | £270,121.00 | 37 Detached Houses |
| Terraced House | £172,111.00 | 9 Terraced Houses |
| Flat | £136,437.00 | 8 Flats |

