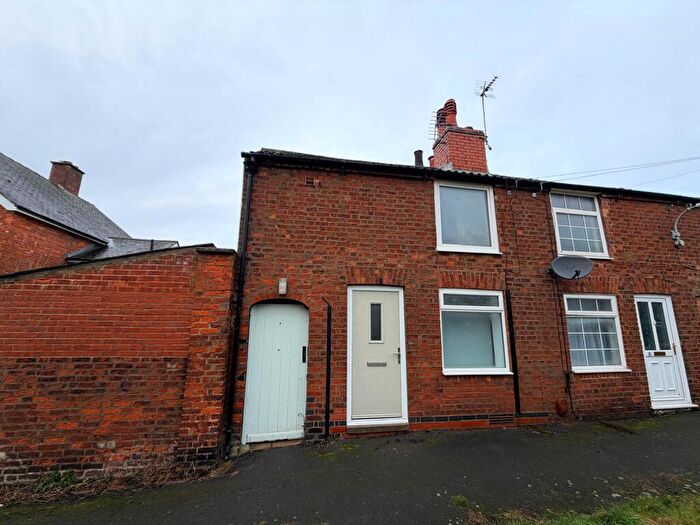
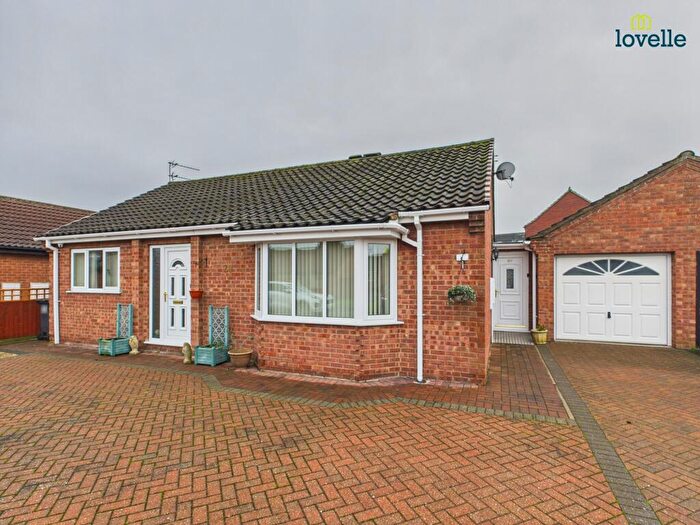
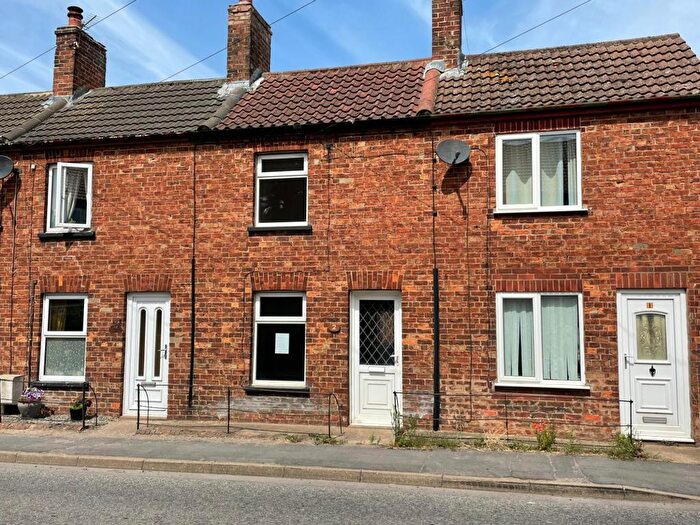
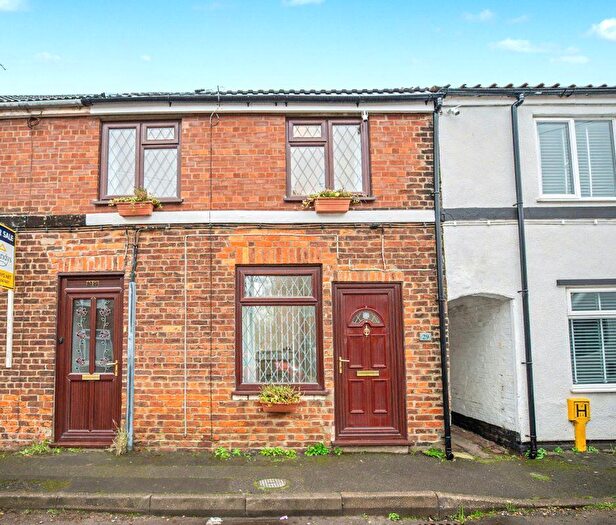
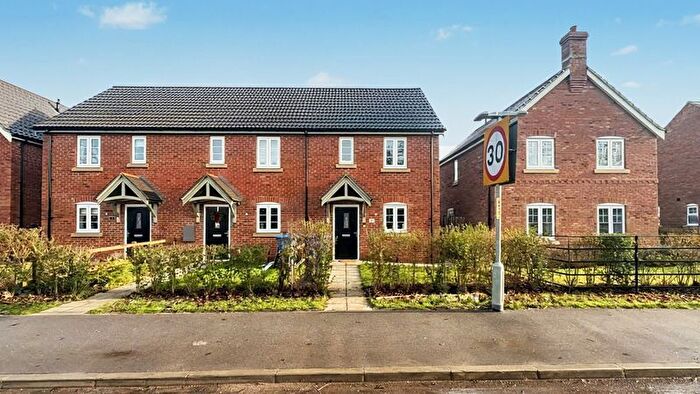
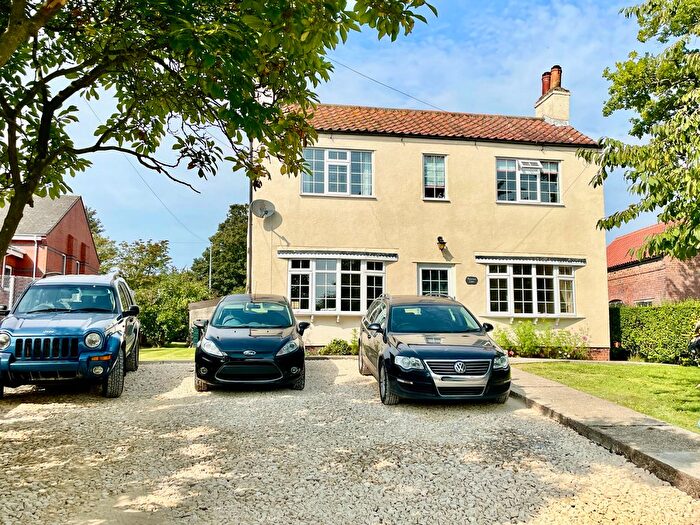
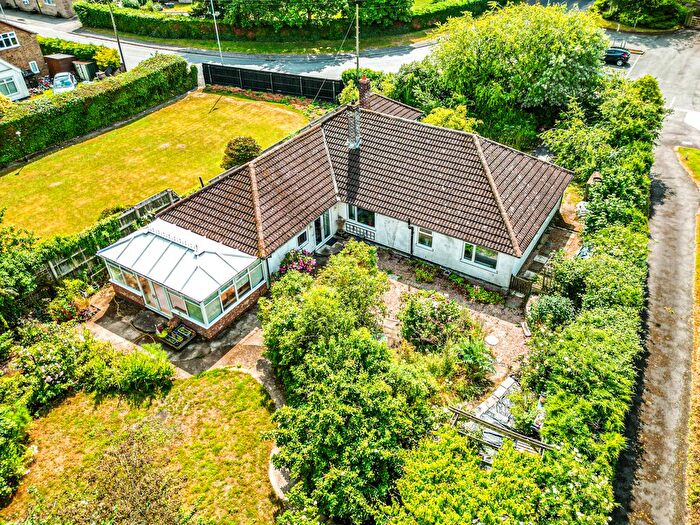
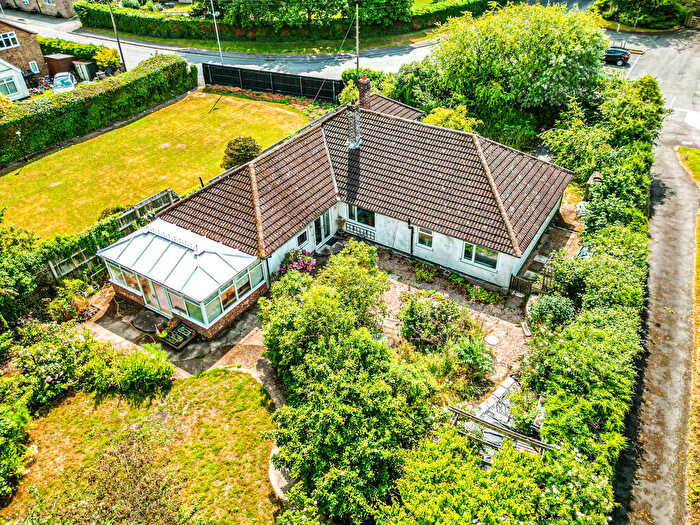
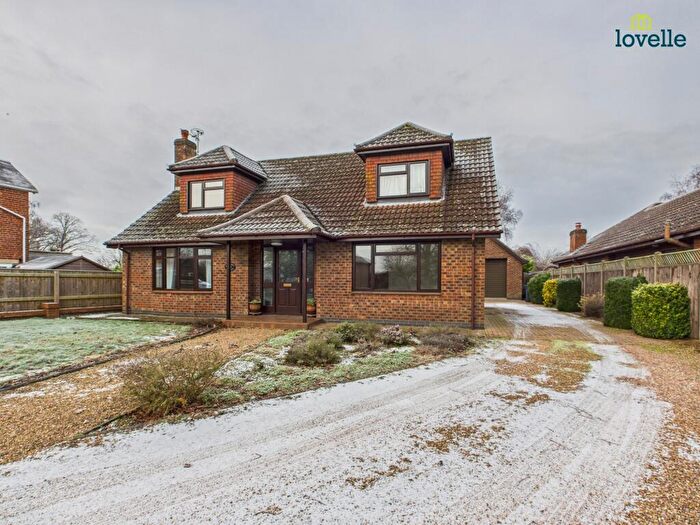
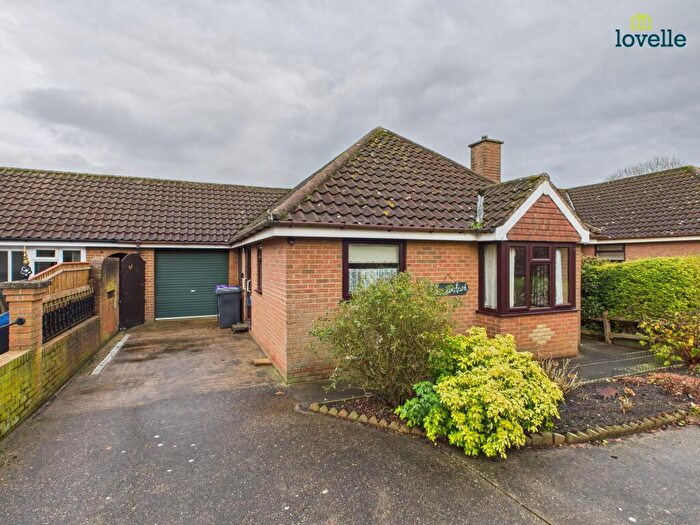
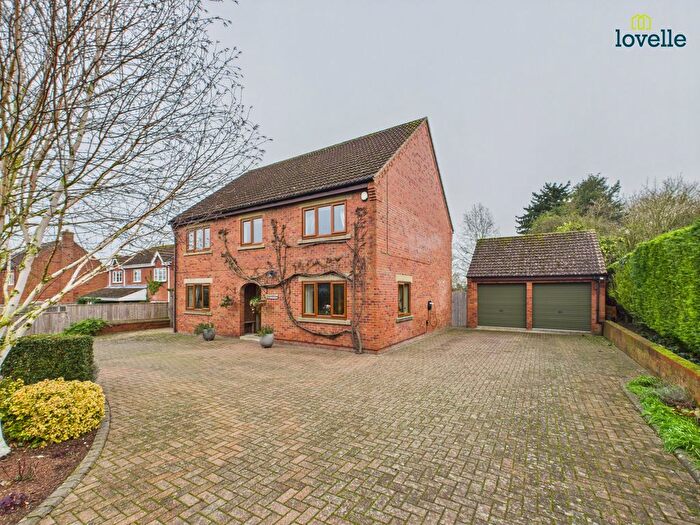
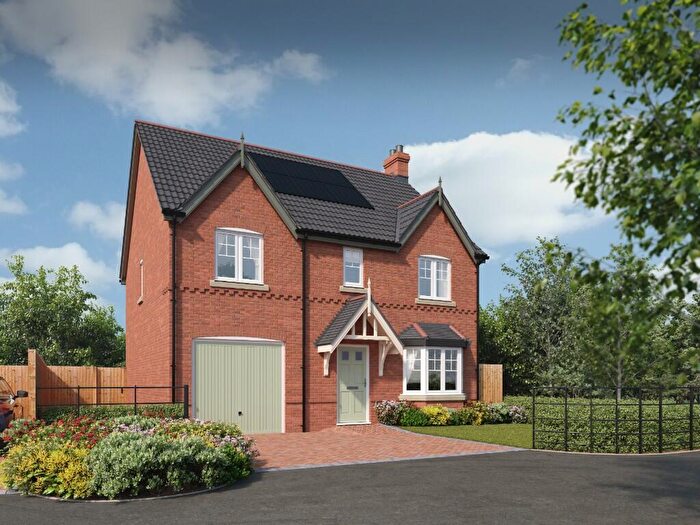
Houses for sale & to rent in Middle Rasen, Market Rasen
House Prices in Middle Rasen
Properties in Middle Rasen have an average house price of £281,728.00 and had 93 Property Transactions within the last 3 years¹.
Middle Rasen is an area in Market Rasen, Lincolnshire with 1,221 households², where the most expensive property was sold for £1,000,000.00.
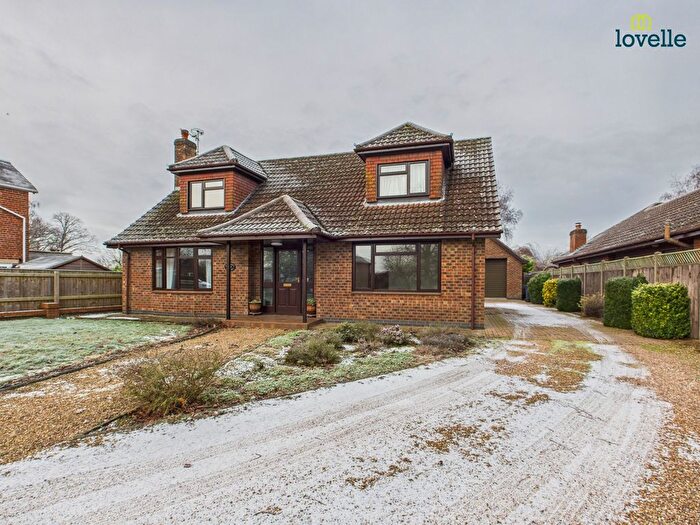
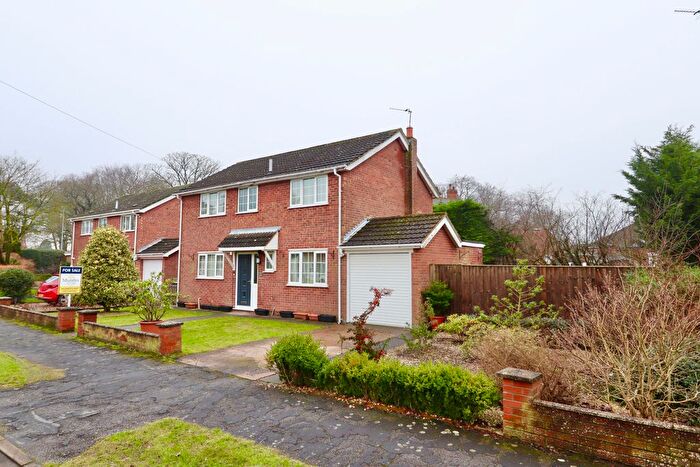
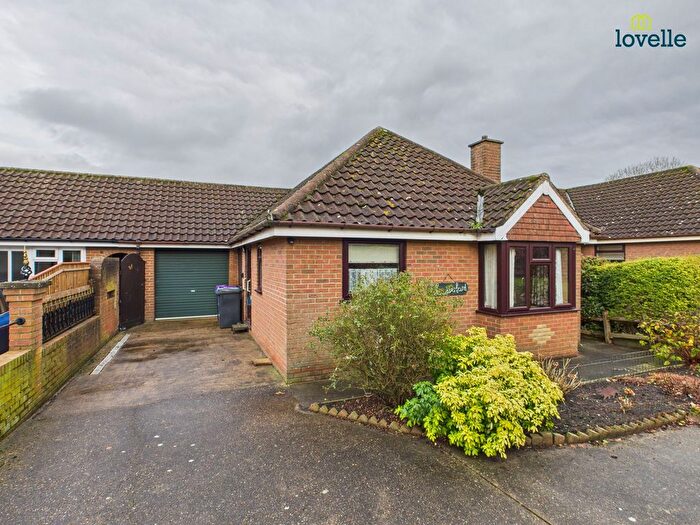
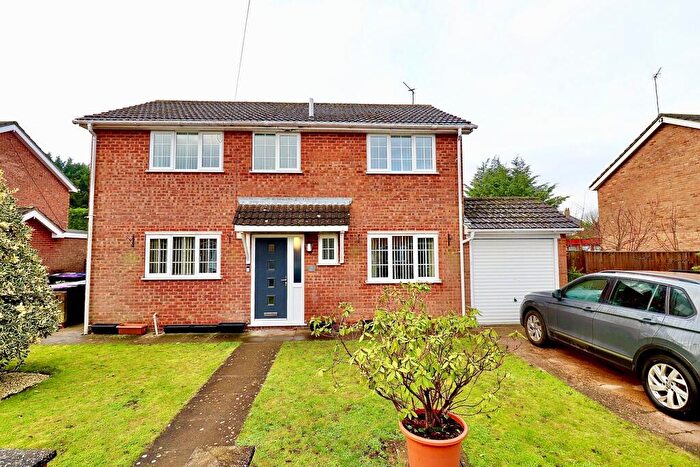
Properties for sale in Middle Rasen
Roads and Postcodes in Middle Rasen
Navigate through our locations to find the location of your next house in Middle Rasen, Market Rasen for sale or to rent.
| Streets | Postcodes |
|---|---|
| Abbott Close | LN8 3LA |
| Acre Close | LN8 3DL |
| Birchwoods Close | LN8 3NT |
| Bishopbridge | LN8 3LY |
| Bluebell Close | LN8 3NY |
| Bracken Way | LN8 3QA |
| Caistor Road | LN8 3FD LN8 3JA LN8 3JB LN8 3JE LN8 3JF LN8 3SY |
| Chambers Paddock | LN8 3PZ |
| Charlotte Lane | LN8 3LL |
| Church Lane | LN8 3PN |
| Church Street | LN8 3TR |
| Dovecote | LN8 3UD |
| Drax Court | LN8 3UE |
| Fern Drive | LN8 3NU |
| Fir Park | LN8 3YL |
| Folly Hill | LN8 3PW |
| Foxglove Road | LN8 3NX |
| Gainsborough Road | LN8 3JR LN8 3JS LN8 3JU LN8 3JW LN8 3JX LN8 3RY |
| Gallamore Court | LN8 3UH |
| Gallamore Lane | LN8 3HZ LN8 3UB |
| George Road | LN8 3LH |
| Gulham Road | LN8 3PS |
| Hoe Drive | LN8 3DJ |
| Jacksons Field | LN8 3LB |
| Lancaster Drive | LN8 3GX |
| Lawrence Lane | LN8 3LN |
| Lily Drive | LN8 3NZ |
| Lincoln Lane | LN8 3RZ |
| Low Church Road | LN8 3TY |
| Low Road | LN8 3SZ |
| Main Street | LN8 3PA LN8 3TA |
| Mallowfield | LN8 3TU |
| Manor Drive | LN8 3JY |
| Maple Drive | LN8 3QB |
| Mayfield Crescent | LN8 3UA |
| Meadowfield | LN8 3TP |
| Mill Lane | LN8 3LE LN8 3TB |
| Moor Road | LN8 3PR |
| Naylors Drive | LN8 3UQ |
| North Street | LN8 3TS |
| Old Gallamore Lane | LN8 3US |
| Paddock Close | LN8 3DG |
| Plough Drive | LN8 3DW |
| Primrose Close | LN8 3QX |
| Rase Close | LN8 3UF |
| Sand Lane | LN8 3TE |
| Skinners Lane | LN8 3JD |
| Snowdrop Place | LN8 3QD |
| South Lane | LN8 3LG |
| Stockmoor Lane | LN8 3TT |
| The Brambles | LN8 3NS |
| The Furlongs | LN8 3DF |
| The Orchards | LN8 3TL |
| Thornton Road | LN8 3PP |
| Toft Lane | LN8 3LR |
| Top Road | LN8 3TD LN8 3TG |
| Walesby Road | LN8 3EY LN8 3UJ |
| Washdyke Lane | LN8 3PB |
| Wilkinson Drive | LN8 3LD |
| LN7 6JD LN7 6JF LN8 3LS LN8 3LU LN8 3LX LN8 3LZ LN8 3PE LN8 3PJ LN8 3PU LN8 3YJ LN8 3YN LN8 3YP |
Transport near Middle Rasen
-
Market Rasen Station
-
Kirton Lindsey Station
-
Brigg Station
-
Barnetby Station
-
Lincoln Central Station
-
Habrough Station
-
Stallingborough Station
- FAQ
- Price Paid By Year
- Property Type Price
Frequently asked questions about Middle Rasen
What is the average price for a property for sale in Middle Rasen?
The average price for a property for sale in Middle Rasen is £281,728. This amount is 10% higher than the average price in Market Rasen. There are 997 property listings for sale in Middle Rasen.
What streets have the most expensive properties for sale in Middle Rasen?
The streets with the most expensive properties for sale in Middle Rasen are Gallamore Lane at an average of £576,666, Lincoln Lane at an average of £500,000 and Mill Lane at an average of £432,500.
What streets have the most affordable properties for sale in Middle Rasen?
The streets with the most affordable properties for sale in Middle Rasen are Lancaster Drive at an average of £158,166, Church Street at an average of £206,166 and Low Church Road at an average of £209,250.
Which train stations are available in or near Middle Rasen?
Some of the train stations available in or near Middle Rasen are Market Rasen, Kirton Lindsey and Brigg.
Property Price Paid in Middle Rasen by Year
The average sold property price by year was:
| Year | Average Sold Price | Price Change |
Sold Properties
|
|---|---|---|---|
| 2025 | £274,973 | 3% |
28 Properties |
| 2024 | £266,812 | -13% |
32 Properties |
| 2023 | £301,924 | 4% |
33 Properties |
| 2022 | £290,779 | 16% |
50 Properties |
| 2021 | £244,050 | 0,4% |
71 Properties |
| 2020 | £243,166 | 13% |
43 Properties |
| 2019 | £211,007 | -10% |
43 Properties |
| 2018 | £232,641 | 18% |
63 Properties |
| 2017 | £191,154 | 2% |
58 Properties |
| 2016 | £186,663 | -4% |
57 Properties |
| 2015 | £194,470 | 2% |
42 Properties |
| 2014 | £191,486 | 7% |
69 Properties |
| 2013 | £178,405 | 8% |
62 Properties |
| 2012 | £164,470 | - |
36 Properties |
| 2011 | £164,542 | -1% |
34 Properties |
| 2010 | £166,629 | 5% |
41 Properties |
| 2009 | £158,728 | -7% |
51 Properties |
| 2008 | £169,185 | -18% |
42 Properties |
| 2007 | £199,195 | 9% |
109 Properties |
| 2006 | £181,345 | 9% |
133 Properties |
| 2005 | £165,741 | 0,5% |
125 Properties |
| 2004 | £164,916 | 1% |
84 Properties |
| 2003 | £163,009 | 32% |
41 Properties |
| 2002 | £110,335 | 14% |
49 Properties |
| 2001 | £94,921 | 17% |
46 Properties |
| 2000 | £78,874 | 3% |
45 Properties |
| 1999 | £76,879 | -4% |
39 Properties |
| 1998 | £80,319 | 20% |
31 Properties |
| 1997 | £64,473 | 13% |
40 Properties |
| 1996 | £55,989 | -7% |
31 Properties |
| 1995 | £60,111 | - |
31 Properties |
Property Price per Property Type in Middle Rasen
Here you can find historic sold price data in order to help with your property search.
The average Property Paid Price for specific property types in the last three years are:
| Property Type | Average Sold Price | Sold Properties |
|---|---|---|
| Semi Detached House | £210,977.00 | 22 Semi Detached Houses |
| Detached House | £323,254.00 | 61 Detached Houses |
| Terraced House | £184,075.00 | 10 Terraced Houses |

