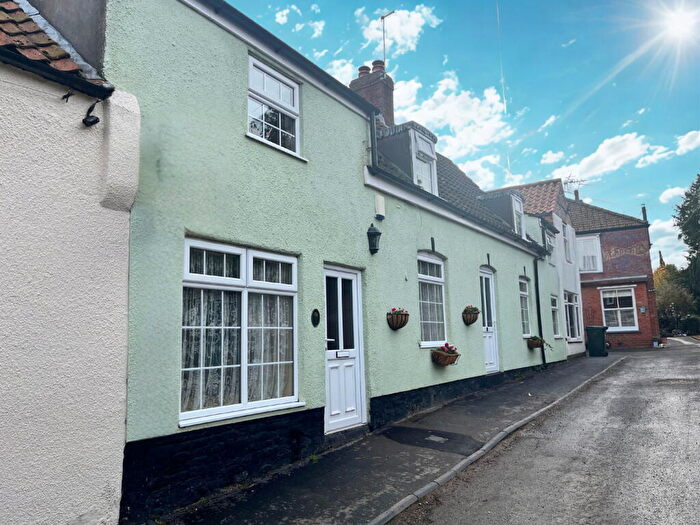
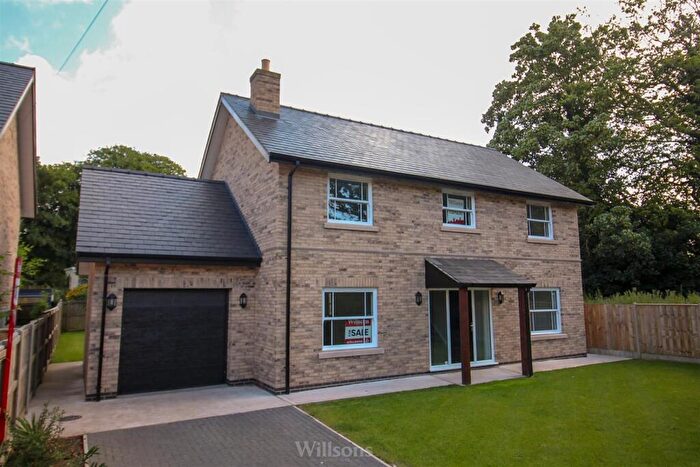
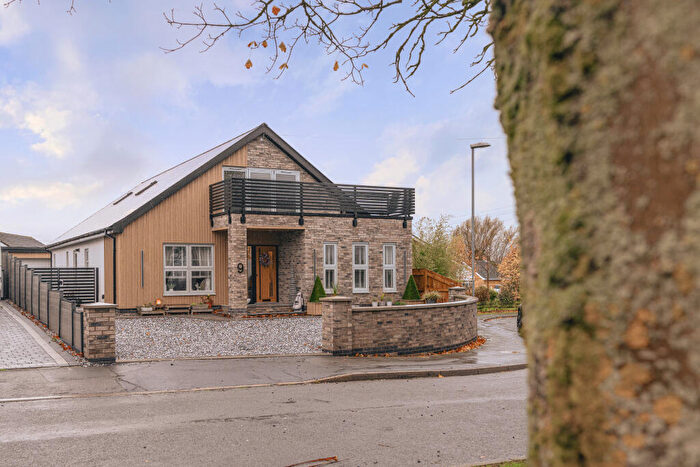
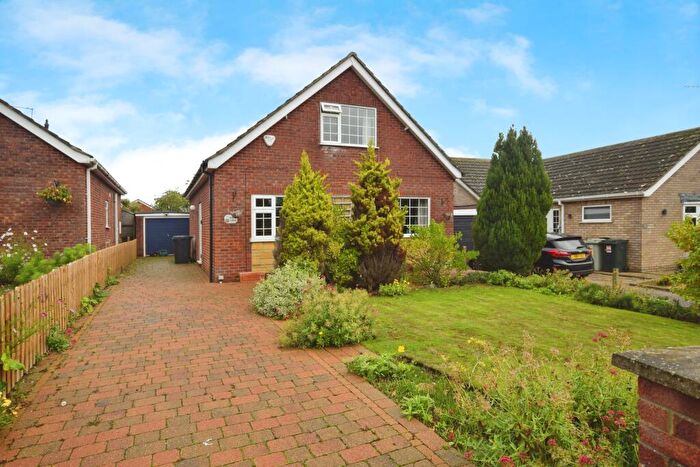
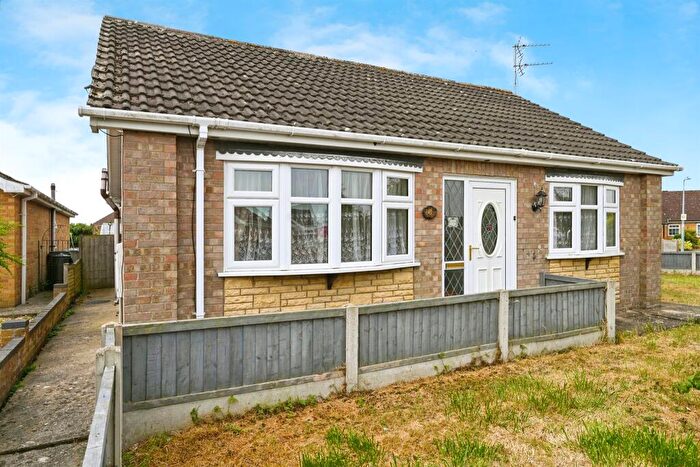
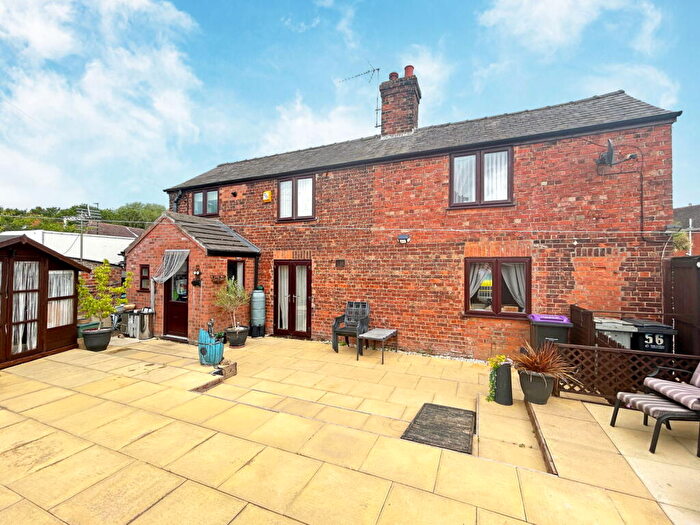
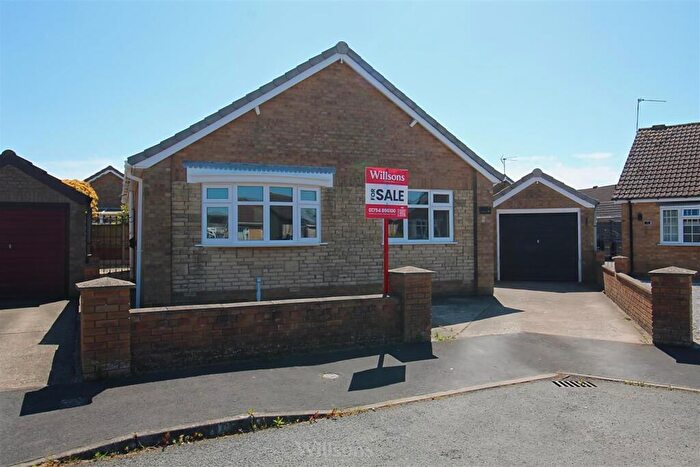
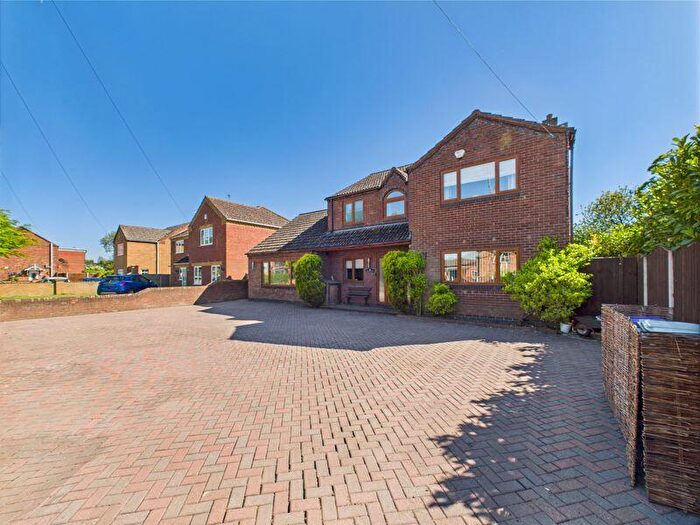
Houses for sale & to rent in Burgh Le Marsh, Skegness
House Prices in Burgh Le Marsh
Properties in Burgh Le Marsh have an average house price of £240,635.00 and had 95 Property Transactions within the last 3 years¹.
Burgh Le Marsh is an area in Skegness, Lincolnshire with 1,128 households², where the most expensive property was sold for £710,000.00.
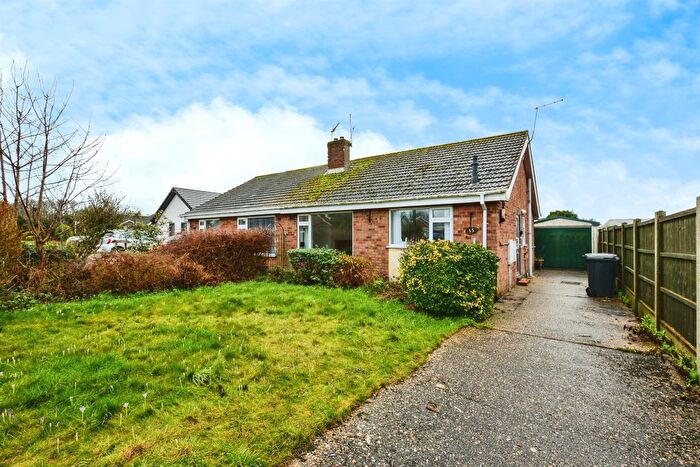
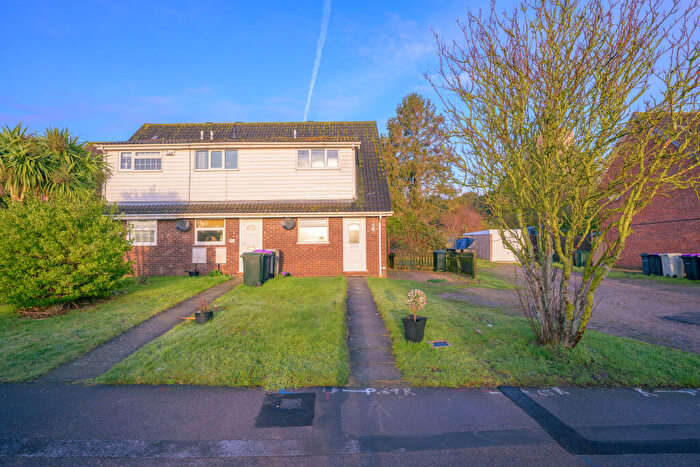
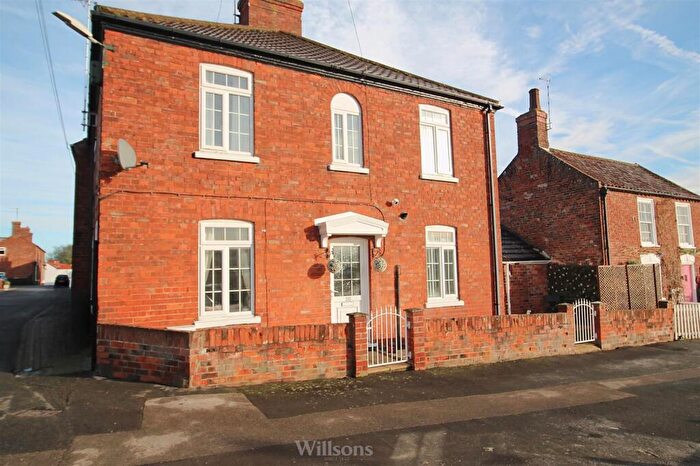
Properties for sale in Burgh Le Marsh
Roads and Postcodes in Burgh Le Marsh
Navigate through our locations to find the location of your next house in Burgh Le Marsh, Skegness for sale or to rent.
| Streets | Postcodes |
|---|---|
| Alexander Way | PE24 5JN |
| Ash Close | PE24 5BT |
| Ashington End | PE24 4TZ PE24 4UB PE24 4UD PE24 4UE |
| Barnack Estate | PE24 5LU |
| Beaumont Close | PE24 5DT |
| Billgate Lane | PE24 5AF |
| Bishop Tozer Close | PE24 5JF |
| Bratoft Lane | PE24 5ER |
| Brewery Street | PE24 5LG |
| Burgh Road West | PE24 4UF |
| Cervantes Court | PE24 5HB |
| Chalk Lane | PE24 5HN |
| Chapman Avenue | PE24 5LY |
| Church Hill | PE24 5LD |
| Church Street | PE24 5LB |
| Claremont Road | PE24 5HG |
| Cumberlidge Close | PE24 5BG |
| Dawson Drive | PE24 5NA |
| Dobsons Court | PE24 5JY |
| Doubledays Lane | PE24 5EN |
| Douglas Close | PE24 5BF |
| East End | PE24 5LW |
| Elm Crescent | PE24 5EG |
| Faulkers Lane | PE24 5HW |
| Foundry Mews | PE24 5HQ |
| Glebe Rise | PE24 5BL |
| Hall Lane | PE24 5AQ PE24 5LX |
| High Street | PE24 5DY PE24 5DZ PE24 5JR PE24 5JT PE24 5JZ PE24 5JL PE24 5JP PE24 5JS |
| Holden Drive | PE24 5LZ |
| Hunters Meadow | PE24 5FQ |
| Ingoldmells Road | PE24 5HD PE24 5HE PE24 5HF PE24 5HJ |
| Jacksons Lane | PE24 5LA |
| Jane Palmer Court | PE24 5LE |
| Johnson Way | PE24 5JE |
| Kenneth Avenue | PE24 5HA |
| Lime Close | PE24 5BS |
| Linden Drive | PE24 5BP |
| Market Close | PE24 5JX |
| Marsh Lane | PE24 5AG |
| Middlemarsh Road | PE24 5AD |
| Mill Lane | PE24 5BU |
| Old Chapel Lane | PE24 5LQ |
| Orby Road | PE24 5JH PE24 5JJ PE24 5JD |
| Parkers Close | PE24 5BJ |
| Skegness Road | PE24 5LL PE24 5AA PE24 5AB PE24 5EU PE24 5LJ PE24 5LN |
| Springfields Close | PE24 5FR |
| St Pauls Close | PE24 5EQ |
| St Peters Close | PE24 5EH |
| Station Road | PE24 5EL PE24 5EP PE24 5ES PE24 5EW |
| Storeys Lane | PE24 5LP PE24 5LR |
| Sykes Corner | PE24 5AE |
| The Causeway | PE24 5LF PE24 5LT |
| The Common | PE24 5HH PE24 5HL |
| The Paddocks | PE24 5DS |
| The Passage | PE24 5JW |
| Venables Close | PE24 5DU |
| Wainfleet Road | PE24 5AH PE24 5BN PE24 5ED PE24 5EE |
| Walls Avenue | PE24 5NG |
| West End | PE24 5EA PE24 5EF PE24 5EY |
| Wildshed Lane | PE24 5BW |
| Windmill Drive | PE24 5EJ |
| Youngers Lane | PE24 5JQ |
| PE24 5DW PE24 5DR |
Transport near Burgh Le Marsh
- FAQ
- Price Paid By Year
- Property Type Price
Frequently asked questions about Burgh Le Marsh
What is the average price for a property for sale in Burgh Le Marsh?
The average price for a property for sale in Burgh Le Marsh is £240,635. This amount is 22% higher than the average price in Skegness. There are 523 property listings for sale in Burgh Le Marsh.
What streets have the most expensive properties for sale in Burgh Le Marsh?
The streets with the most expensive properties for sale in Burgh Le Marsh are Ingoldmells Road at an average of £532,500, Wildshed Lane at an average of £422,500 and Station Road at an average of £337,075.
What streets have the most affordable properties for sale in Burgh Le Marsh?
The streets with the most affordable properties for sale in Burgh Le Marsh are The Causeway at an average of £105,833, Jane Palmer Court at an average of £145,000 and St Peters Close at an average of £155,500.
Which train stations are available in or near Burgh Le Marsh?
Some of the train stations available in or near Burgh Le Marsh are Thorpe Culvert, Havenhouse and Skegness.
Property Price Paid in Burgh Le Marsh by Year
The average sold property price by year was:
| Year | Average Sold Price | Price Change |
Sold Properties
|
|---|---|---|---|
| 2025 | £261,641 | 6% |
31 Properties |
| 2024 | £244,661 | 12% |
34 Properties |
| 2023 | £214,365 | -17% |
30 Properties |
| 2022 | £250,750 | 13% |
49 Properties |
| 2021 | £218,621 | 3% |
76 Properties |
| 2020 | £212,561 | 22% |
44 Properties |
| 2019 | £166,504 | -17% |
51 Properties |
| 2018 | £194,727 | 9% |
55 Properties |
| 2017 | £177,420 | 9% |
64 Properties |
| 2016 | £161,890 | -3% |
44 Properties |
| 2015 | £167,125 | 11% |
45 Properties |
| 2014 | £148,980 | 4% |
51 Properties |
| 2013 | £142,666 | -8% |
45 Properties |
| 2012 | £153,793 | 5% |
22 Properties |
| 2011 | £145,709 | -5% |
36 Properties |
| 2010 | £152,288 | 9% |
52 Properties |
| 2009 | £139,227 | -7% |
34 Properties |
| 2008 | £148,488 | -4% |
22 Properties |
| 2007 | £155,011 | 1% |
61 Properties |
| 2006 | £153,187 | 7% |
56 Properties |
| 2005 | £142,322 | -2% |
46 Properties |
| 2004 | £145,287 | 21% |
56 Properties |
| 2003 | £115,192 | 22% |
56 Properties |
| 2002 | £90,384 | 26% |
83 Properties |
| 2001 | £66,878 | 10% |
78 Properties |
| 2000 | £59,967 | 11% |
73 Properties |
| 1999 | £53,335 | 3% |
74 Properties |
| 1998 | £51,473 | 4% |
68 Properties |
| 1997 | £49,357 | 7% |
78 Properties |
| 1996 | £45,853 | 2% |
47 Properties |
| 1995 | £45,027 | - |
54 Properties |
Property Price per Property Type in Burgh Le Marsh
Here you can find historic sold price data in order to help with your property search.
The average Property Paid Price for specific property types in the last three years are:
| Property Type | Average Sold Price | Sold Properties |
|---|---|---|
| Semi Detached House | £175,643.00 | 24 Semi Detached Houses |
| Detached House | £281,015.00 | 62 Detached Houses |
| Terraced House | £162,250.00 | 6 Terraced Houses |
| Flat | £82,816.00 | 3 Flats |

