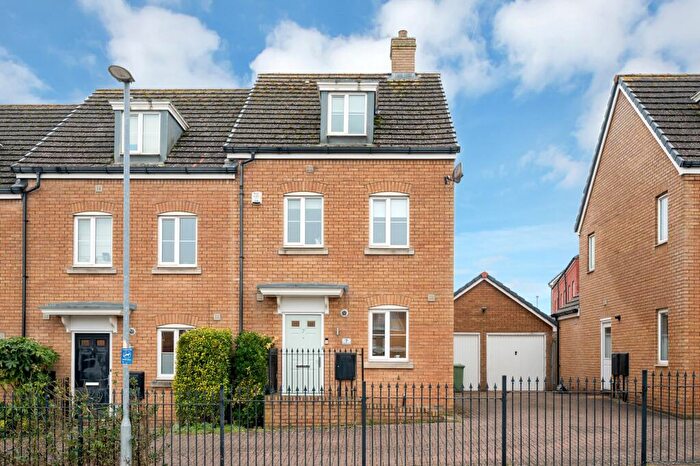
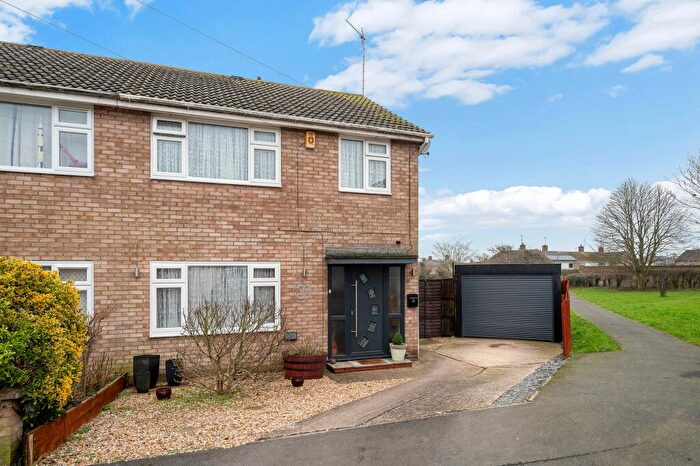
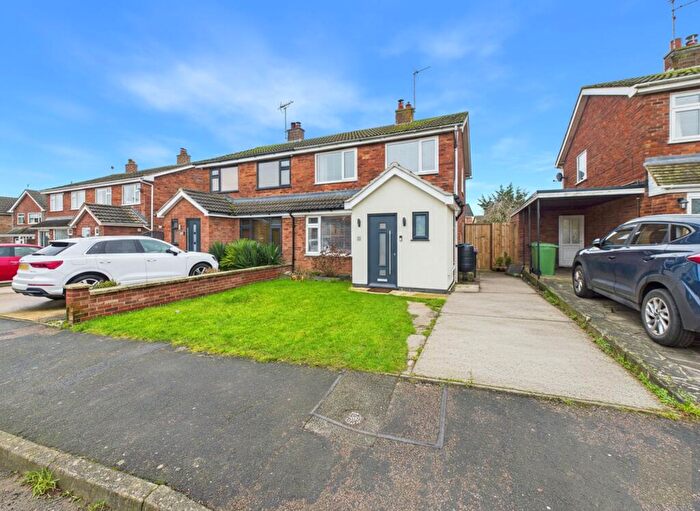
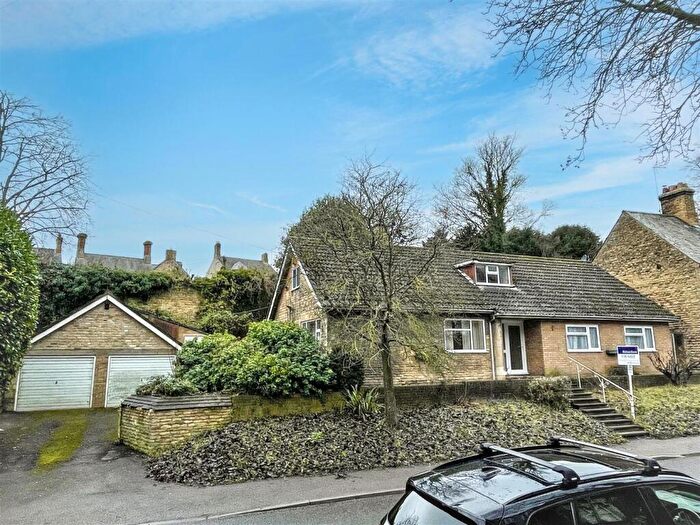
Houses for sale & to rent in All Saints, Stamford
House Prices in All Saints
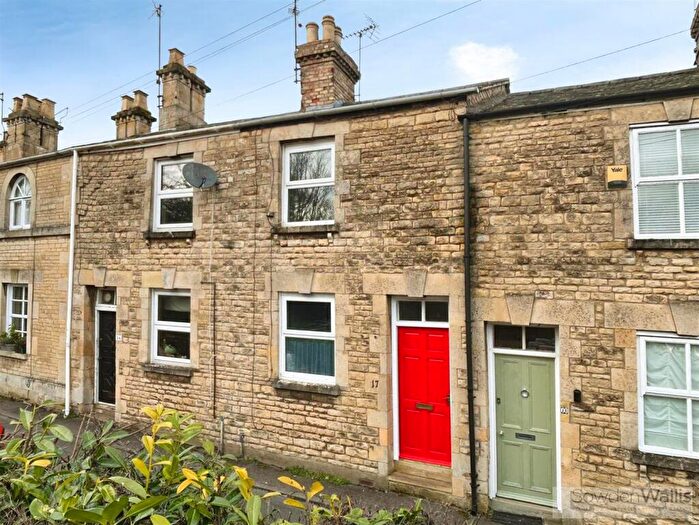
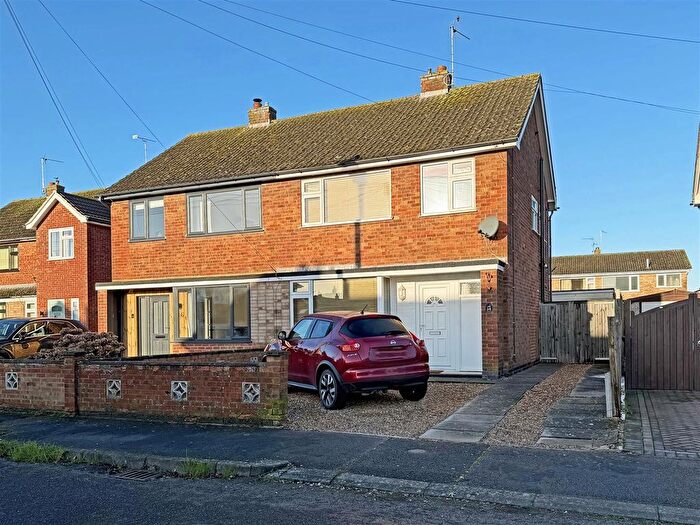
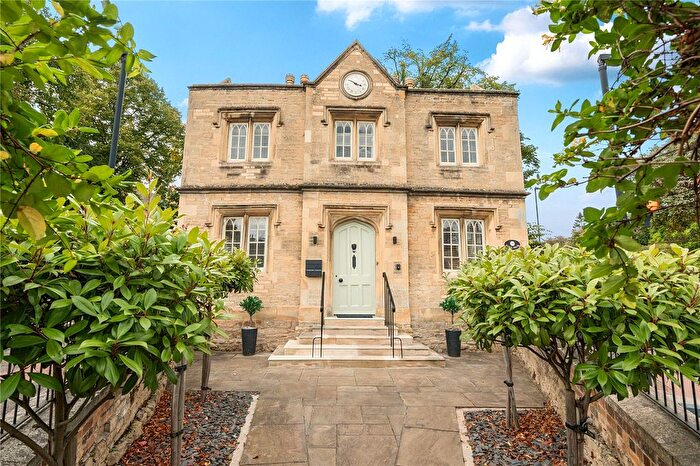
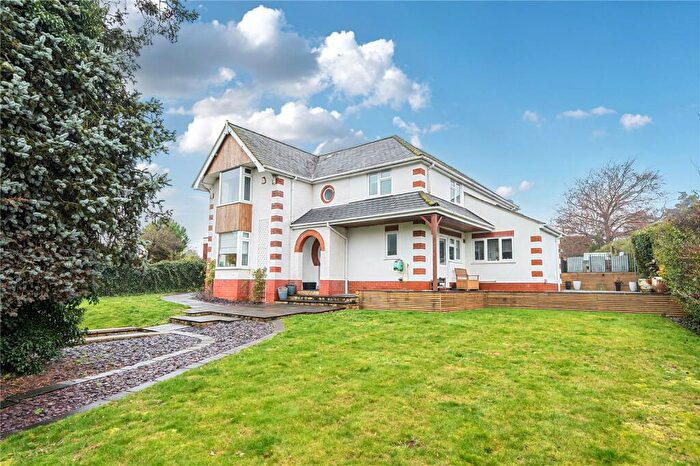
Properties in All Saints have an average house price of £305,224.00 and had 188 Property Transactions within the last 3 years¹.
All Saints is an area in Stamford, Lincolnshire with 2,213 households², where the most expensive property was sold for £1,250,000.00.
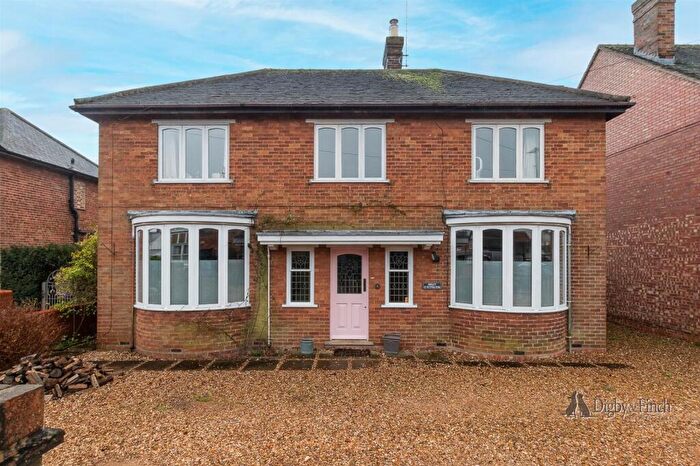
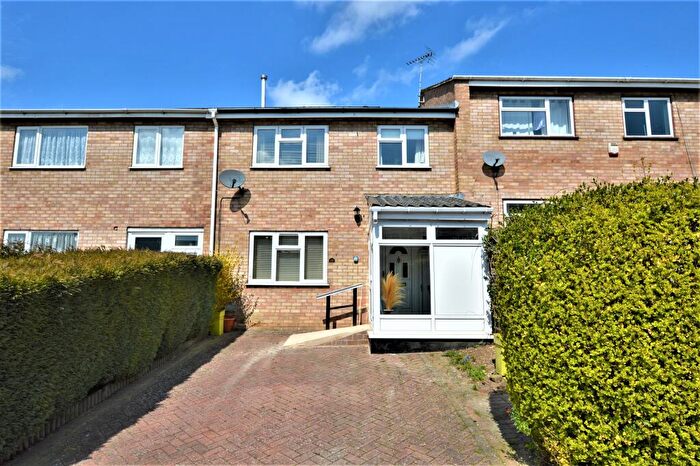
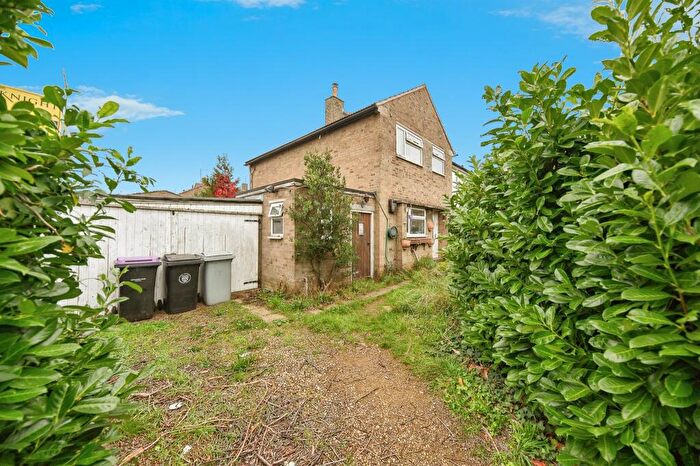
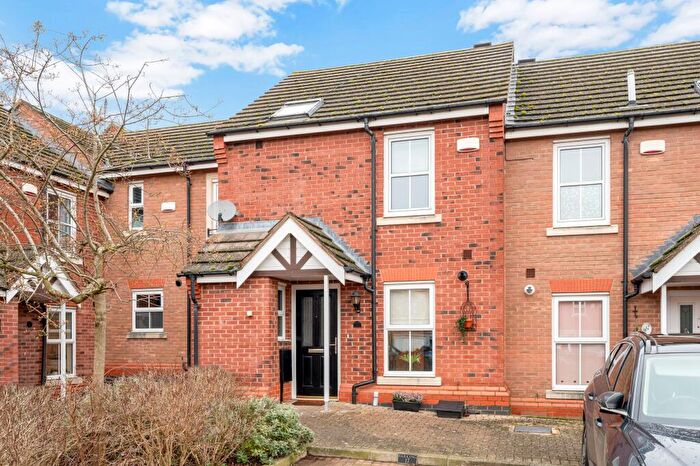
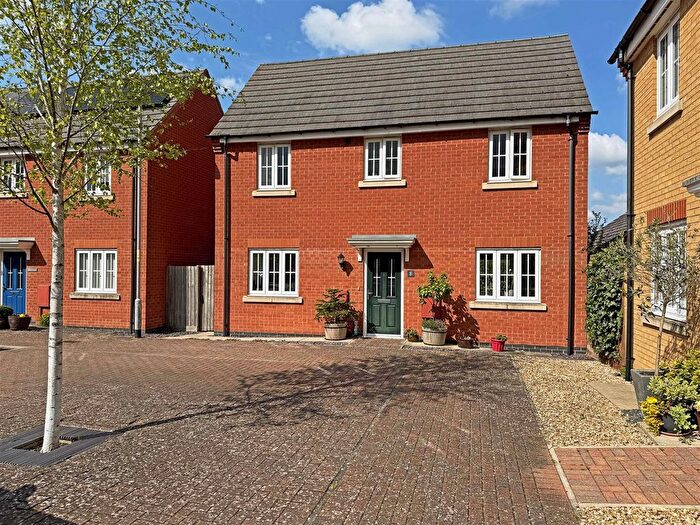
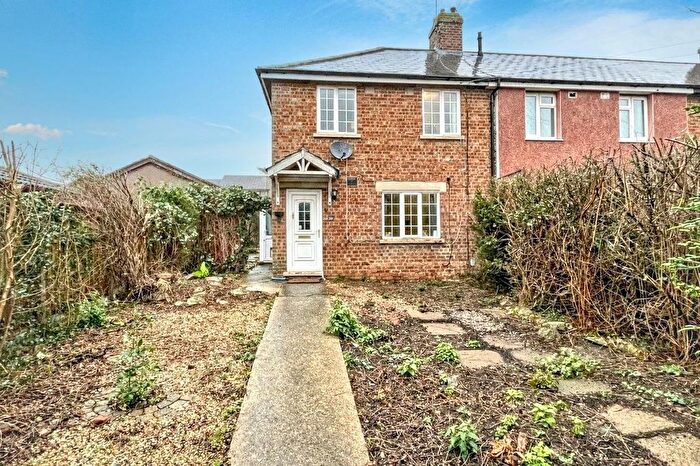
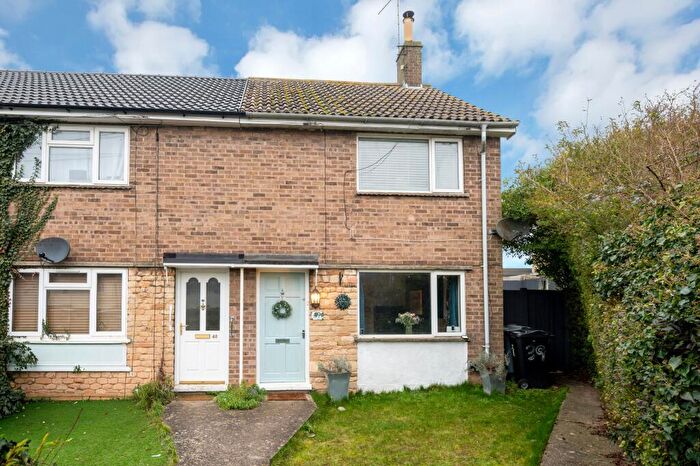
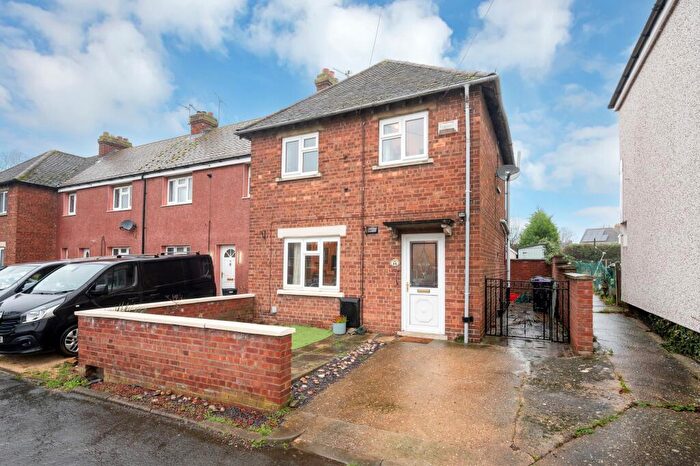
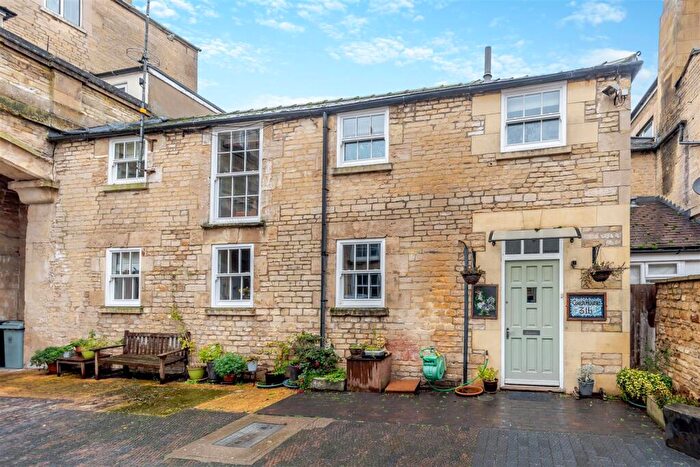
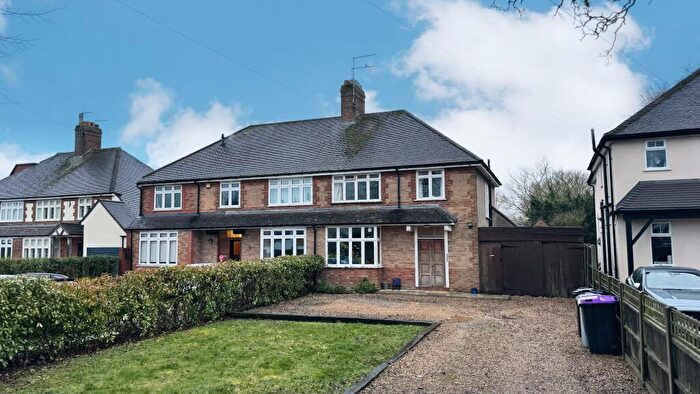
Properties for sale in All Saints
Roads and Postcodes in All Saints
Navigate through our locations to find the location of your next house in All Saints, Stamford for sale or to rent.
| Streets | Postcodes |
|---|---|
| Airedale Road | PE9 1DJ |
| Ancaster Road | PE9 1DG |
| Andrew Road | PE9 1HN |
| Anne Road | PE9 1HT |
| Audus Place | PE9 1GL |
| Banks Crescent | PE9 1FF PE9 1FJ |
| Barnwell Road | PE9 2UU |
| Belvoir Close | PE9 2XY |
| Beverley Gardens | PE9 2UD |
| Bradshaw Close | PE9 2NH |
| Burgess Road | PE9 1GD |
| Burghley Road | PE9 1DQ |
| Cambridge Road | PE9 1BN PE9 1BU PE9 1BY |
| Casterton Road | PE9 2UA PE9 2UB PE9 2UH PE9 2UQ PE9 2XX |
| Charles Road | PE9 1HR |
| Chatsworth Road | PE9 2UJ PE9 2UN PE9 2UR |
| Churchill Road | PE9 1JA PE9 1JF PE9 1JG PE9 1JQ |
| Collins Avenue | PE9 1FH |
| Cornwall Road | PE9 1LQ |
| Darwin Close | PE9 1JL |
| Downing Crescent | PE9 1JD |
| Edinburgh Road | PE9 1HH PE9 1HP |
| Edward Road | PE9 1HW |
| Elgar Way | PE9 1EY |
| Elizabeth Road | PE9 1HX PE9 1HY PE9 1HZ |
| Elton Close | PE9 2UL |
| Emmanuel Road | PE9 1JE |
| Essex Road | PE9 1LA PE9 1LG PE9 1LS PE9 1LT |
| Fitzwilliam Road | PE9 1DF |
| Gainsborough Road | PE9 1DH |
| Girton Way | PE9 1JJ |
| Gloucester Road | PE9 1LH |
| Green Lane | PE9 1HF PE9 1HQ |
| Haddon Road | PE9 2UP PE9 2UW |
| Jackson Way | PE9 1FG |
| Keble Close | PE9 1JN |
| Keble Court | PE9 1JP |
| Kings Road | PE9 1HA |
| Lambeth Walk | PE9 1BQ |
| Lancaster Road | PE9 1LJ |
| Laughton Drive | PE9 2JW |
| Little Casterton Road | PE9 1BE PE9 1BX |
| Mason Drive | PE9 1FD |
| Mountbatten Avenue | PE9 1HU |
| New Cross Road | PE9 1AJ PE9 1AL |
| Newham Road | PE9 1BZ |
| Norfolk Square | PE9 1LE |
| Oxford Road | PE9 1BT |
| Pembroke Road | PE9 1BS |
| Peterhouse Close | PE9 1JB |
| Ravel Close | PE9 1EZ |
| Redcot Gardens | PE9 1DE PE9 1DL |
| Rockingham Road | PE9 2UT |
| Roman Mill Gardens | PE9 1GB |
| Ross Drive | PE9 2JF |
| Sandringham Close | PE9 1HL |
| Sargents Court | PE9 1LW |
| Selwyn Road | PE9 1JW |
| Tolethorpe Square | PE9 1LD |
| Trinity Road | PE9 1BP |
| Victoria Road | PE9 1HB |
| Walcot Way | PE9 2XU |
| Waverley Gardens | PE9 1BH |
| Waverley Place | PE9 1BJ |
| Windsor Close | PE9 1HJ |
| Winterton Close | PE9 1FE |
| Worcester Crescent | PE9 1LF |
| York Road | PE9 1LL |
Transport near All Saints
- FAQ
- Price Paid By Year
- Property Type Price
Frequently asked questions about All Saints
What is the average price for a property for sale in All Saints?
The average price for a property for sale in All Saints is £305,224. This amount is 20% lower than the average price in Stamford. There are 1,023 property listings for sale in All Saints.
What streets have the most expensive properties for sale in All Saints?
The streets with the most expensive properties for sale in All Saints are Roman Mill Gardens at an average of £660,000, Little Casterton Road at an average of £594,750 and Casterton Road at an average of £568,332.
What streets have the most affordable properties for sale in All Saints?
The streets with the most affordable properties for sale in All Saints are Sargents Court at an average of £101,625, Girton Way at an average of £132,000 and Gloucester Road at an average of £155,000.
Which train stations are available in or near All Saints?
Some of the train stations available in or near All Saints are Stamford, Oakham and Peterborough.
Property Price Paid in All Saints by Year
The average sold property price by year was:
| Year | Average Sold Price | Price Change |
Sold Properties
|
|---|---|---|---|
| 2025 | £304,435 | 7% |
64 Properties |
| 2024 | £283,570 | -16% |
64 Properties |
| 2023 | £329,165 | 9% |
60 Properties |
| 2022 | £298,402 | 8% |
92 Properties |
| 2021 | £274,414 | 12% |
101 Properties |
| 2020 | £242,345 | -10% |
76 Properties |
| 2019 | £266,180 | 11% |
80 Properties |
| 2018 | £236,485 | 0,4% |
104 Properties |
| 2017 | £235,452 | -8% |
89 Properties |
| 2016 | £254,826 | 11% |
93 Properties |
| 2015 | £226,007 | 18% |
96 Properties |
| 2014 | £186,425 | -4% |
95 Properties |
| 2013 | £194,708 | 10% |
115 Properties |
| 2012 | £175,527 | -10% |
121 Properties |
| 2011 | £193,644 | 8% |
111 Properties |
| 2010 | £178,588 | 1% |
91 Properties |
| 2009 | £176,085 | -5% |
113 Properties |
| 2008 | £184,922 | 3% |
105 Properties |
| 2007 | £179,164 | 18% |
87 Properties |
| 2006 | £146,074 | -4% |
131 Properties |
| 2005 | £151,948 | 2% |
94 Properties |
| 2004 | £148,435 | 23% |
102 Properties |
| 2003 | £113,667 | 26% |
133 Properties |
| 2002 | £83,572 | 14% |
103 Properties |
| 2001 | £71,500 | 15% |
88 Properties |
| 2000 | £61,116 | 6% |
85 Properties |
| 1999 | £57,385 | -9% |
94 Properties |
| 1998 | £62,709 | 16% |
84 Properties |
| 1997 | £52,464 | 7% |
83 Properties |
| 1996 | £48,841 | 1% |
92 Properties |
| 1995 | £48,142 | - |
78 Properties |
Property Price per Property Type in All Saints
Here you can find historic sold price data in order to help with your property search.
The average Property Paid Price for specific property types in the last three years are:
| Property Type | Average Sold Price | Sold Properties |
|---|---|---|
| Semi Detached House | £301,343.00 | 80 Semi Detached Houses |
| Detached House | £450,252.00 | 37 Detached Houses |
| Terraced House | £256,083.00 | 60 Terraced Houses |
| Flat | £113,681.00 | 11 Flats |

