
Houses for sale & to rent in Brooklands, Sale
House Prices in Brooklands
Properties in Brooklands have an average house price of £317k and had 55 Property Transactions within the last 3 years¹.
Brooklands is an area in Sale, Manchester with 399 households², where the most expensive property was sold for £925k.
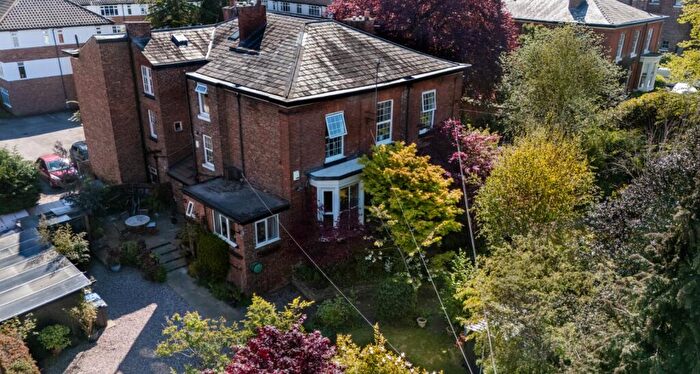
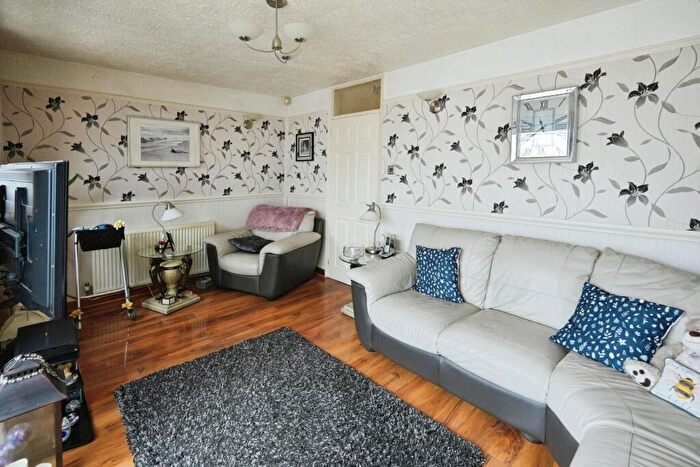
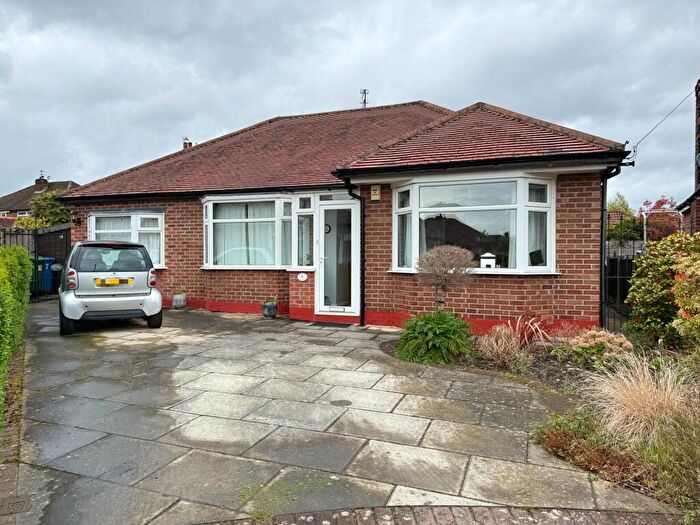
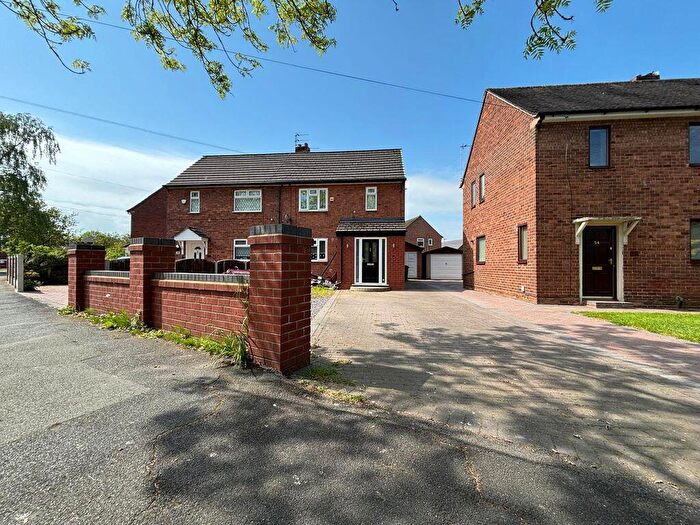
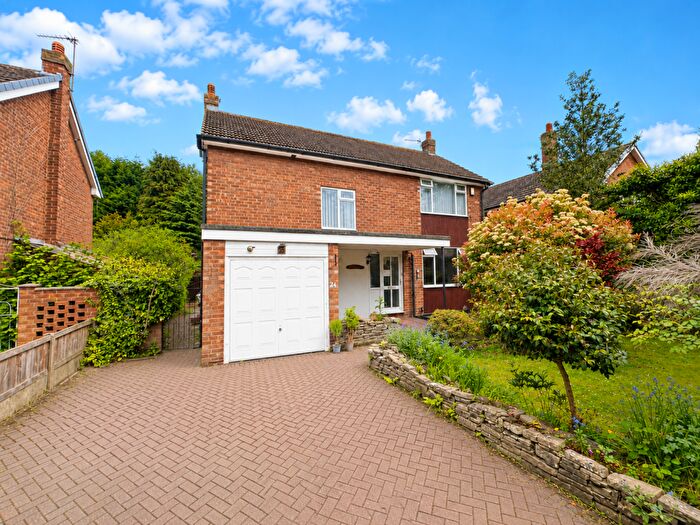
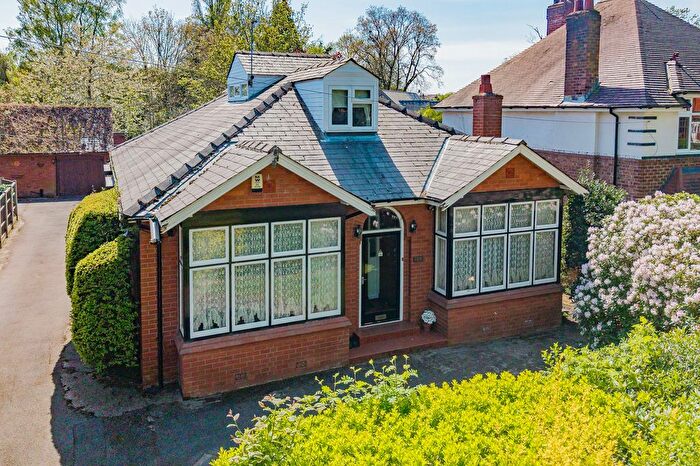
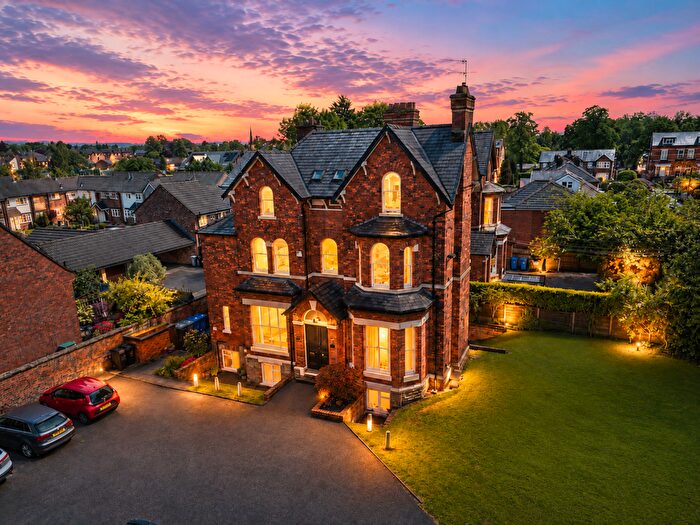
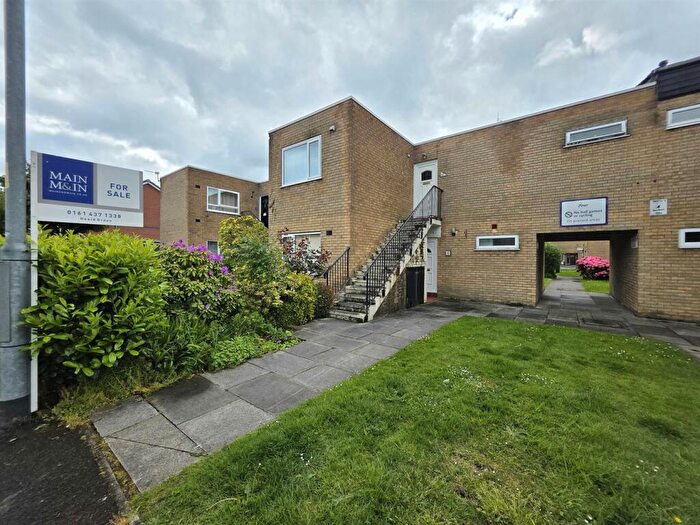
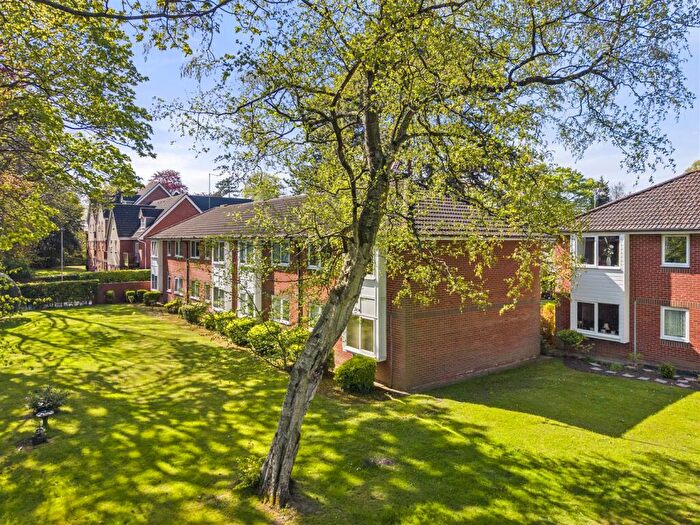
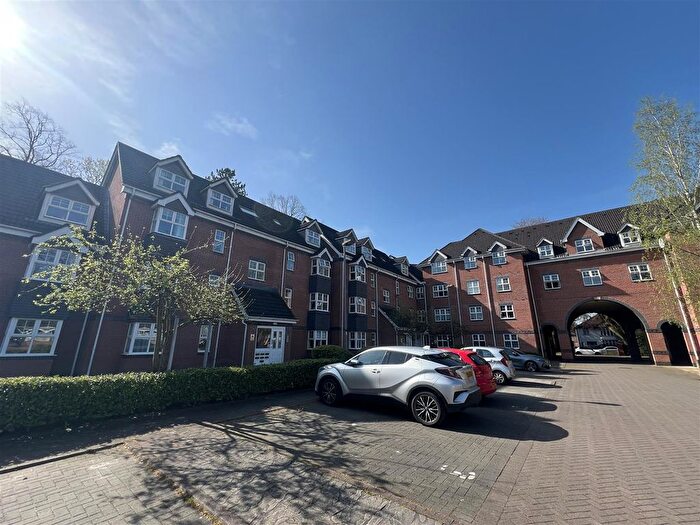
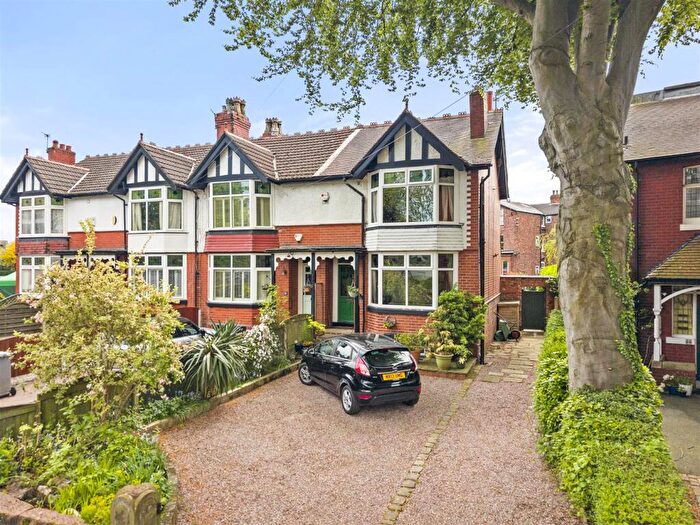
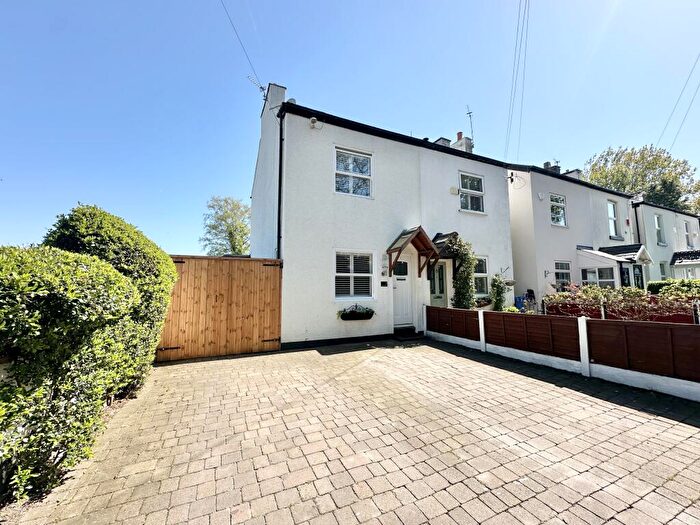
Properties for sale in Brooklands
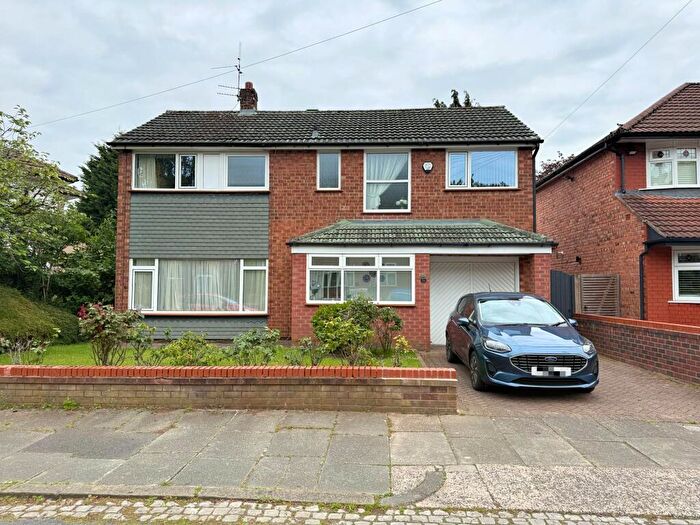
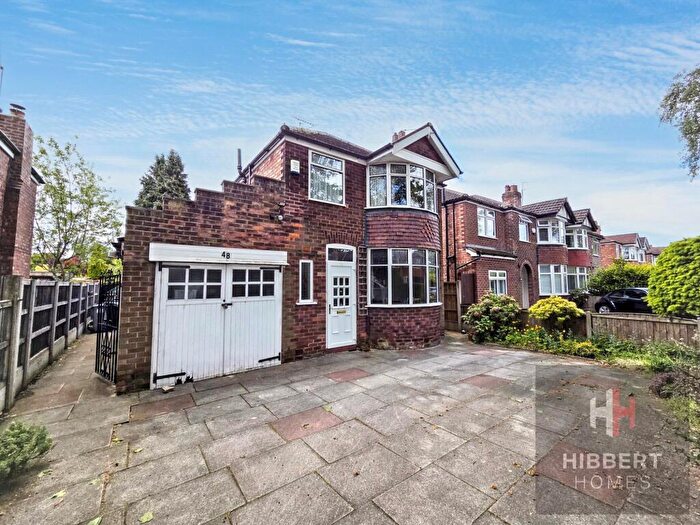
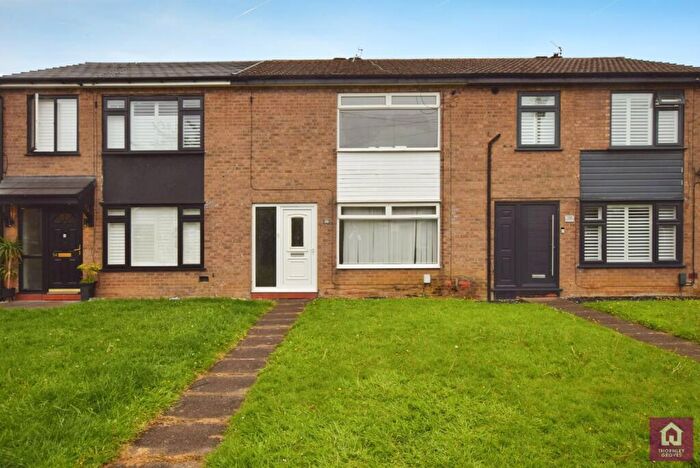
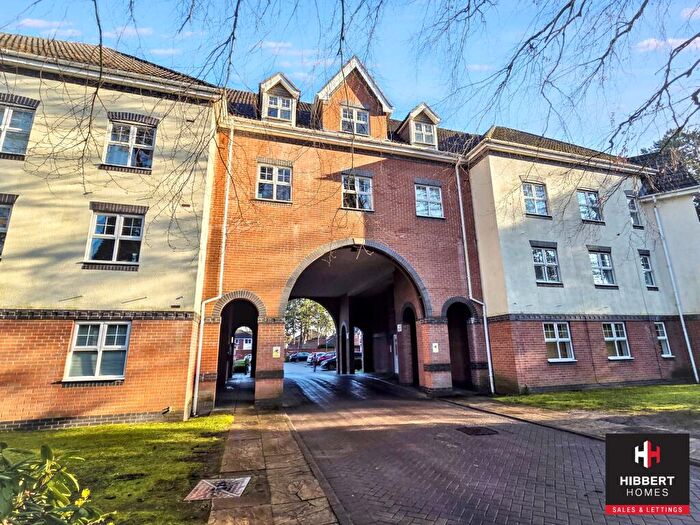
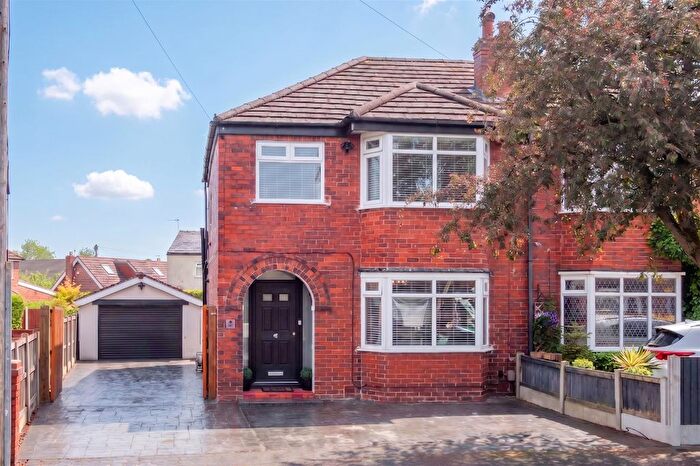
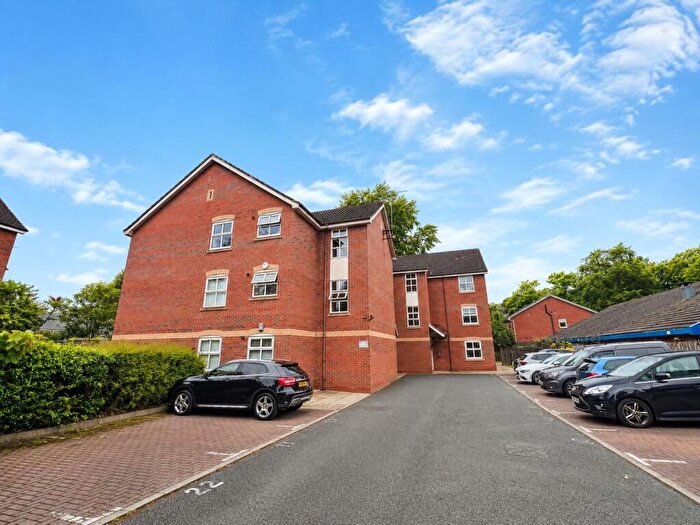
![]()
If you are looking to sell your house, let it out, or receive a property valuation, an expert can help you.
Click the button below to get started.
Roads and Postcodes in Brooklands
Navigate through our locations to find the location of your next house in Brooklands, Sale for sale or to rent.
| Streets | Postcodes |
|---|---|
| Alvanley Close | M33 3RD |
| Ashstead Road | M33 3NY M33 3PX M33 3SB |
| Brooklands Road | M33 3PD M33 3PJ M33 3PY |
| Brownwood Close | M33 3RE |
| Clover Croft | M33 3PU |
| Cranleigh Drive | M33 3PL M33 3PN M33 3PS M33 3PT M33 3PW |
| Dunelm Drive | M33 3RF |
| Emsworth Drive | M33 3PR |
| Greenoak Drive | M33 3QA |
| Penryn Avenue | M33 3PG |
| Verdure Avenue | M33 3PP |
| Woodlands Drive | M33 3PQ |
Transport near Brooklands

- FAQ
- Price Paid By Year
- Property Type Price
Frequently asked questions about Brooklands
What is the average price for a property for sale in Brooklands?
The average price for a property for sale in Brooklands is £316,536. There are 1,485 property listings for sale in Brooklands.
What streets have the most expensive properties for sale in Brooklands?
The streets with the most expensive properties for sale in Brooklands are Verdure Avenue at an average of £547,500, Cranleigh Drive at an average of £497,500 and Greenoak Drive at an average of £423,666.
What streets have the most affordable properties for sale in Brooklands?
The streets with the most affordable properties for sale in Brooklands are Brooklands Road at an average of £178,064, Alvanley Close at an average of £241,663 and Ashstead Road at an average of £325,000.
Which train stations are available in or near Brooklands?
Some of the train stations available in or near Brooklands are Navigation Road, Altrincham and Hale.
Property Price Paid in Brooklands by Year
The average sold property price by year was:
| Year | Average Sold Price | Price Change |
Sold Properties
|
|---|---|---|---|
| 2026 | £925,000 | 65% |
1 Property |
| 2025 | £325,750 | 7% |
16 Properties |
| 2024 | £304,311 | 6% |
21 Properties |
| 2023 | £287,175 | -0,1% |
17 Properties |
| 2022 | £287,587 | -19% |
19 Properties |
| 2021 | £341,068 | 9% |
30 Properties |
| 2020 | £309,090 | 24% |
16 Properties |
| 2019 | £235,064 | 20% |
14 Properties |
| 2018 | £187,190 | -38% |
50 Properties |
| 2017 | £257,634 | 22% |
19 Properties |
| 2016 | £201,210 | -5% |
24 Properties |
| 2015 | £211,566 | 11% |
37 Properties |
| 2014 | £189,227 | -17% |
38 Properties |
| 2013 | £221,277 | -18% |
18 Properties |
| 2012 | £260,076 | 30% |
13 Properties |
| 2011 | £181,388 | -44% |
9 Properties |
| 2010 | £260,666 | 30% |
12 Properties |
| 2009 | £181,764 | -9% |
17 Properties |
| 2008 | £197,347 | 14% |
14 Properties |
| 2007 | £169,039 | -12% |
24 Properties |
| 2006 | £188,907 | -43% |
31 Properties |
| 2005 | £269,954 | 31% |
11 Properties |
| 2004 | £185,996 | 20% |
28 Properties |
| 2003 | £148,830 | 27% |
60 Properties |
| 2002 | £109,301 | 6% |
27 Properties |
| 2001 | £102,219 | 11% |
33 Properties |
| 2000 | £90,741 | 8% |
28 Properties |
| 1999 | £83,674 | 12% |
38 Properties |
| 1998 | £73,843 | -2% |
16 Properties |
| 1997 | £75,453 | 9% |
31 Properties |
| 1996 | £68,615 | 10% |
20 Properties |
| 1995 | £62,020 | - |
20 Properties |
Property Price per Property Type in Brooklands
Here you can find historic sold price data in order to help with your property search.
The average Property Paid Price for specific property types in the last three years are:
| Property Type | Average Sold Price | Sold Properties |
|---|---|---|
| Semi Detached House | £401,642.00 | 14 Semi Detached Houses |
| Terraced House | £305,211.00 | 7 Terraced Houses |
| Flat | £183,886.00 | 26 Flats |
| Detached House | £608,625.00 | 8 Detached Houses |