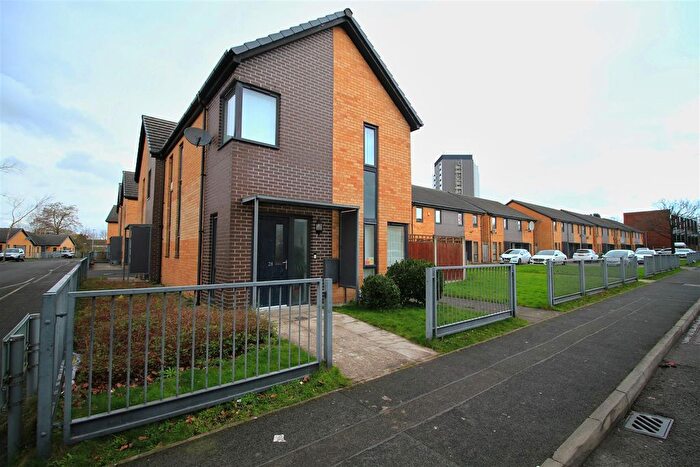
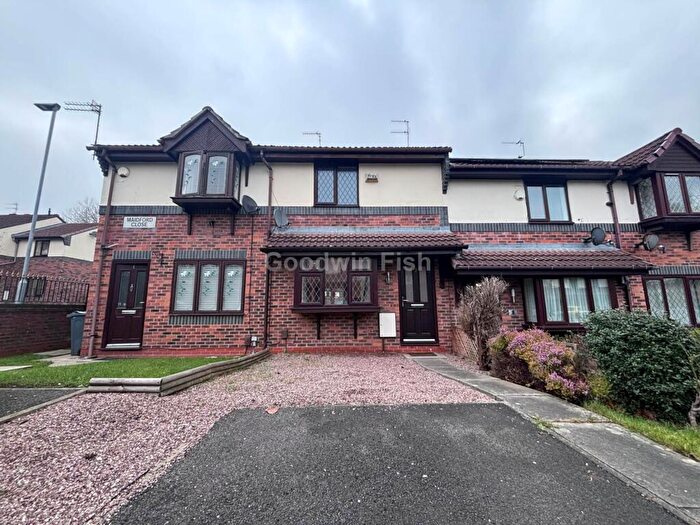
Houses for sale & to rent in Manchester, England
House Prices in Manchester
Properties in Manchester have
an average house price of
£260,127.00
and had 14,832 Property Transactions
within the last 3 years.¹
Manchester is a location in
England with
204,224 households², where the most expensive property was sold for £3,185,000.00.
Properties for sale in Manchester
Towns in Manchester
Navigate through our locations to find the location of your next house in Manchester, England for sale or to rent.
Transport in Manchester
Please see below transportation links in this area:
-
Ardwick Station
-
Manchester Oxford Road Station
-
Manchester Piccadilly Station
-
Deansgate Station
-
Ashburys Station
-
Levenshulme Station
-
Mauldeth Road Station
-
Belle Vue Station
-
Salford Central Station
-
Manchester Victoria Station
- FAQ
- Price Paid By Year
- Property Type Price
Frequently asked questions about Manchester
What is the average price for a property for sale in Manchester?
The average price for a property for sale in Manchester is £260,127. This amount is 27% lower than the average price in England. There are more than 10,000 property listings for sale in Manchester.
What locations have the most expensive properties for sale in Manchester?
The locations with the most expensive properties for sale in Manchester are Altrincham at an average of £393,950, Sale at an average of £300,557 and Oldham at an average of £268,000.
What locations have the most affordable properties for sale in Manchester?
The locations with the most affordable properties for sale in Manchester are Salford at an average of £240,932 and Manchester at an average of £259,923.
Which train stations are available in or near Manchester?
Some of the train stations available in or near Manchester are Ardwick, Manchester Oxford Road and Manchester Piccadilly.
Property Price Paid in Manchester by Year
The average sold property price by year was:
| Year | Average Sold Price | Price Change |
Sold Properties
|
|---|---|---|---|
| 2025 | £271,675 | 5% |
4,425 Properties |
| 2024 | £257,339 | 2% |
5,410 Properties |
| 2023 | £252,918 | 2% |
4,997 Properties |
| 2022 | £248,200 | 6% |
6,349 Properties |
| 2021 | £234,487 | 3% |
7,470 Properties |
| 2020 | £226,576 | 10% |
6,515 Properties |
| 2019 | £204,138 | 3% |
7,062 Properties |
| 2018 | £198,373 | 5% |
7,584 Properties |
| 2017 | £187,563 | 9% |
8,028 Properties |
| 2016 | £171,153 | 7% |
8,628 Properties |
| 2015 | £158,629 | -1% |
8,009 Properties |
| 2014 | £160,988 | 8% |
7,182 Properties |
| 2013 | £148,239 | 0,2% |
5,384 Properties |
| 2012 | £147,897 | 2% |
4,440 Properties |
| 2011 | £144,880 | -1% |
4,568 Properties |
| 2010 | £146,488 | 3% |
5,090 Properties |
| 2009 | £142,696 | -3% |
4,604 Properties |
| 2008 | £146,603 | -6% |
5,804 Properties |
| 2007 | £156,103 | 6% |
12,368 Properties |
| 2006 | £146,107 | 11% |
13,462 Properties |
| 2005 | £129,438 | 12% |
11,278 Properties |
| 2004 | £114,251 | 15% |
12,626 Properties |
| 2003 | £97,531 | 12% |
12,066 Properties |
| 2002 | £86,162 | 18% |
11,747 Properties |
| 2001 | £70,703 | 11% |
9,055 Properties |
| 2000 | £62,987 | 15% |
8,437 Properties |
| 1999 | £53,608 | 3% |
7,761 Properties |
| 1998 | £51,862 | 13% |
5,957 Properties |
| 1997 | £45,121 | 8% |
6,204 Properties |
| 1996 | £41,704 | 2% |
5,205 Properties |
| 1995 | £41,042 | - |
4,706 Properties |
Property Price per Property Type in Manchester
Here you can find historic sold price data in order to help with your property search.
The average Property Paid Price for specific property types in the last three years are:
| Property Type | Average Sold Price | Sold Properties |
|---|---|---|
| Semi Detached House | £317,726.00 | 4,148 Semi Detached Houses |
| Terraced House | £239,165.00 | 5,484 Terraced Houses |
| Detached House | £472,167.00 | 564 Detached Houses |
| Flat | £207,590.00 | 4,636 Flats |

