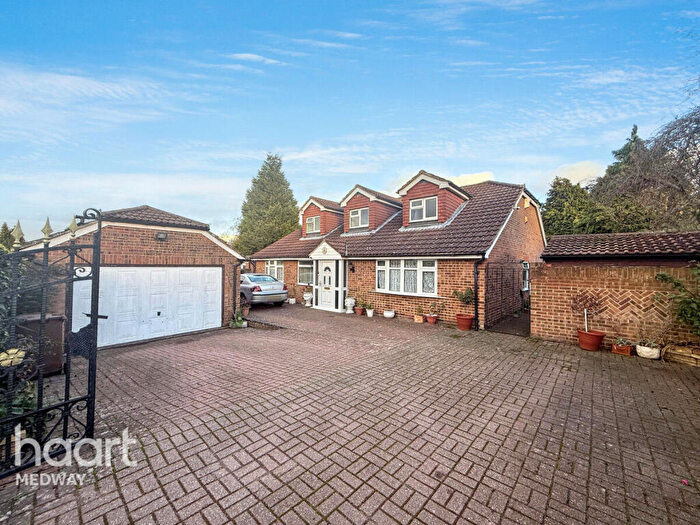
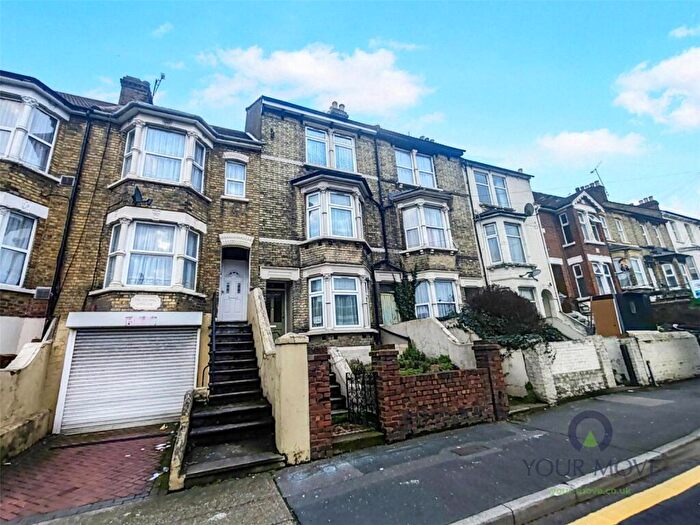
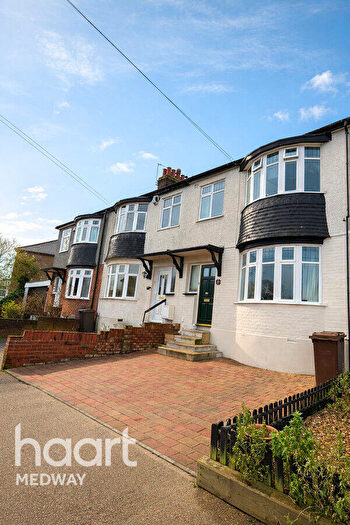
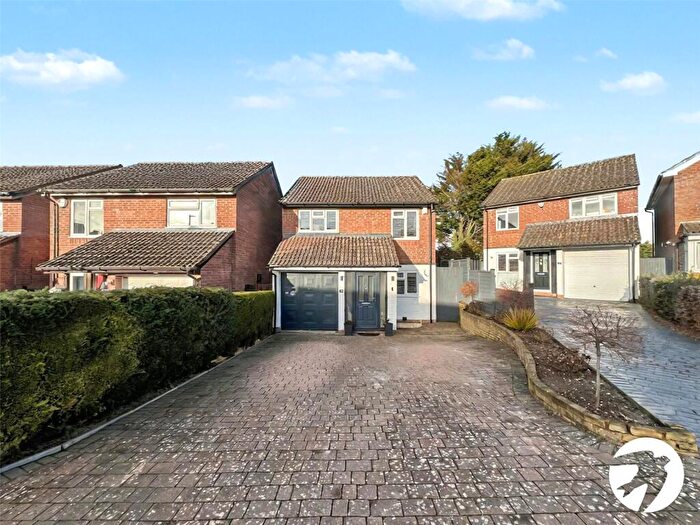
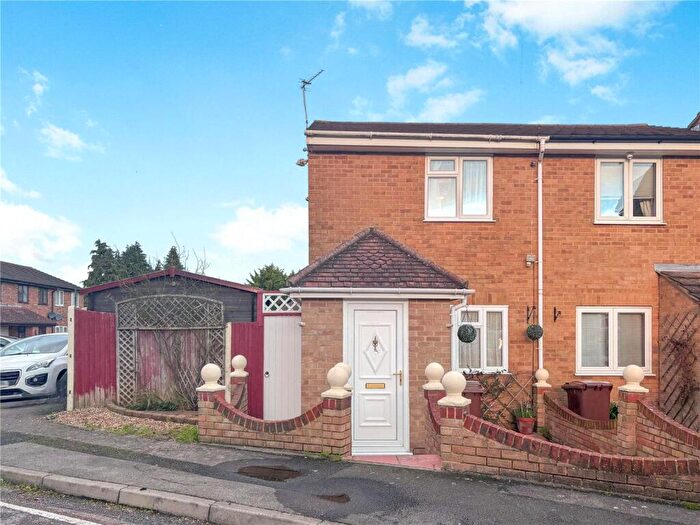
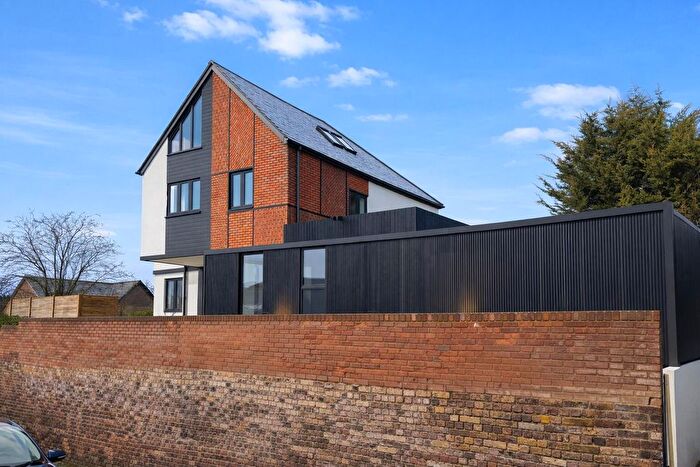
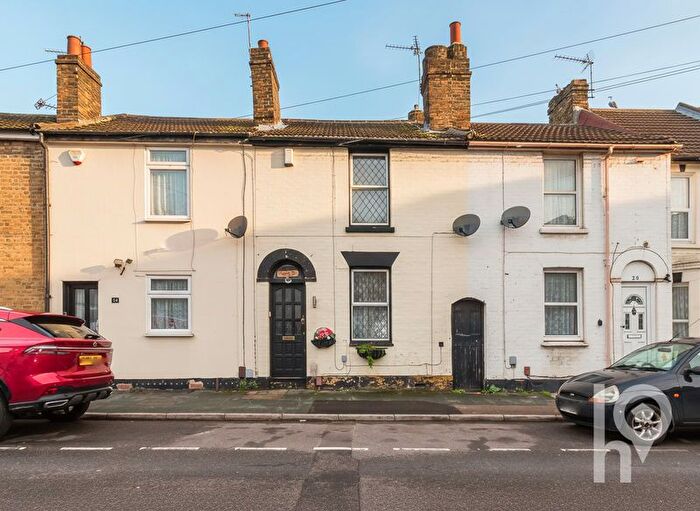
Houses for sale & to rent in Chatham, Medway
House Prices in Chatham
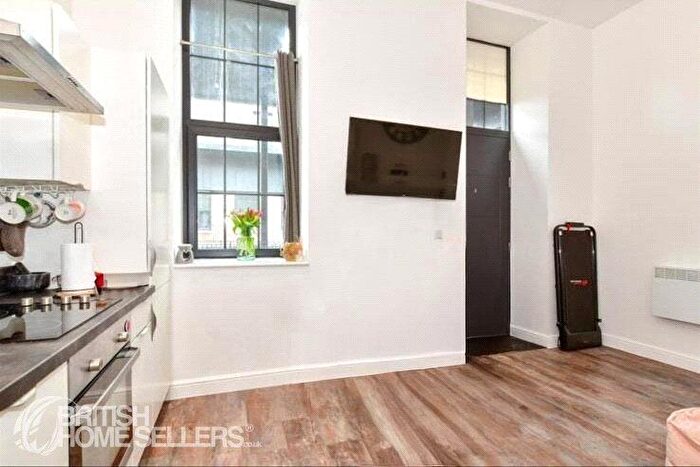
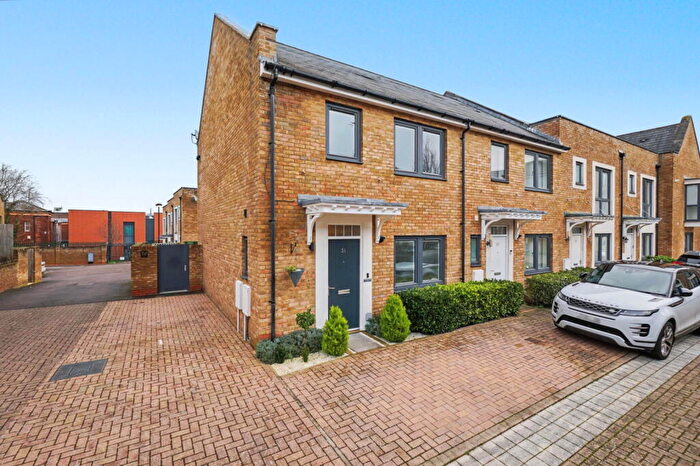
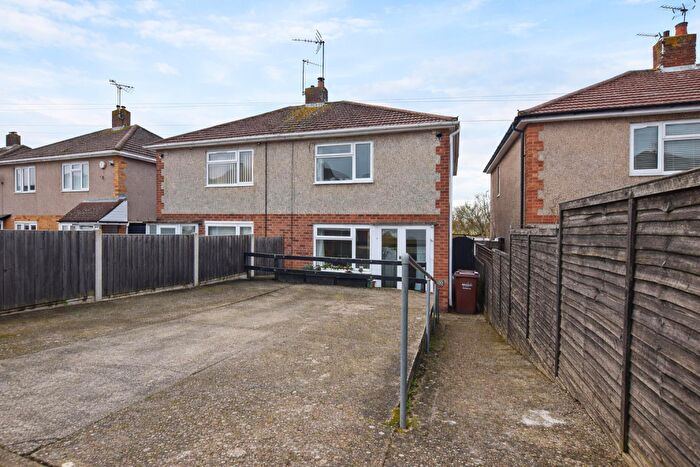
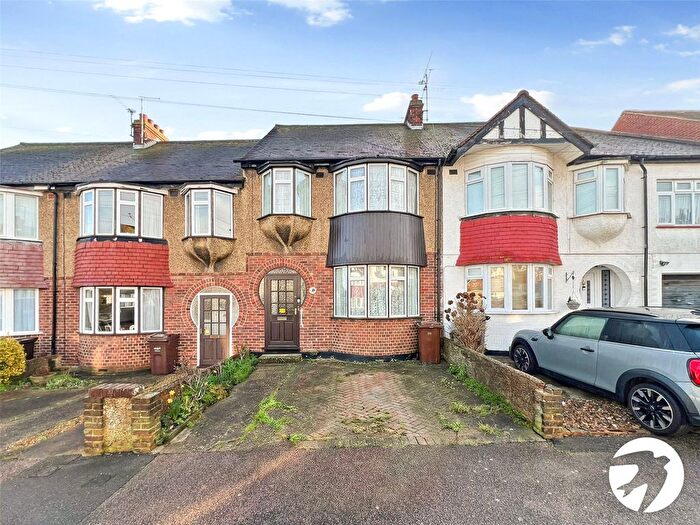
Properties in Chatham have an average house price of £283,380.00 and had 2,963 Property Transactions within the last 3 years.¹
Chatham is an area in Medway with 29,796 households², where the most expensive property was sold for £1,650,000.00.
Properties for sale in Chatham
Neighbourhoods in Chatham
Navigate through our locations to find the location of your next house in Chatham, Medway for sale or to rent.
Transport in Chatham
Please see below transportation links in this area:
- FAQ
- Price Paid By Year
- Property Type Price
Frequently asked questions about Chatham
What is the average price for a property for sale in Chatham?
The average price for a property for sale in Chatham is £283,380. This amount is 8% lower than the average price in Medway. There are more than 10,000 property listings for sale in Chatham.
What locations have the most expensive properties for sale in Chatham?
The locations with the most expensive properties for sale in Chatham are Watling at an average of £389,375, Walderslade at an average of £329,915 and Rochester South And Horsted at an average of £313,579.
What locations have the most affordable properties for sale in Chatham?
The locations with the most affordable properties for sale in Chatham are Gillingham South at an average of £169,125, Chatham Central at an average of £239,181 and Luton And Wayfield at an average of £246,101.
Which train stations are available in or near Chatham?
Some of the train stations available in or near Chatham are Chatham, Gillingham (Kent) and Rochester.
Property Price Paid in Chatham by Year
The average sold property price by year was:
| Year | Average Sold Price | Price Change |
Sold Properties
|
|---|---|---|---|
| 2025 | £285,914 | 3% |
859 Properties |
| 2024 | £277,716 | -3% |
1,080 Properties |
| 2023 | £287,227 | 2% |
1,024 Properties |
| 2022 | £282,131 | 3% |
1,250 Properties |
| 2021 | £274,025 | 9% |
1,476 Properties |
| 2020 | £250,556 | 4% |
1,073 Properties |
| 2019 | £239,405 | 1% |
1,251 Properties |
| 2018 | £236,369 | 1% |
1,281 Properties |
| 2017 | £234,142 | 9% |
1,450 Properties |
| 2016 | £213,132 | 12% |
1,446 Properties |
| 2015 | £186,582 | 9% |
1,471 Properties |
| 2014 | £169,835 | 4% |
1,280 Properties |
| 2013 | £163,333 | 3% |
1,084 Properties |
| 2012 | £157,633 | 4% |
889 Properties |
| 2011 | £151,300 | -4% |
884 Properties |
| 2010 | £156,969 | 7% |
736 Properties |
| 2009 | £146,005 | -9% |
758 Properties |
| 2008 | £158,675 | -1% |
909 Properties |
| 2007 | £160,281 | 5% |
2,015 Properties |
| 2006 | £151,684 | 4% |
1,945 Properties |
| 2005 | £145,118 | 4% |
1,506 Properties |
| 2004 | £139,278 | 10% |
2,007 Properties |
| 2003 | £125,036 | 18% |
2,104 Properties |
| 2002 | £102,255 | 13% |
2,149 Properties |
| 2001 | £88,857 | 17% |
2,267 Properties |
| 2000 | £73,853 | 10% |
2,043 Properties |
| 1999 | £66,116 | 11% |
1,821 Properties |
| 1998 | £58,651 | 9% |
1,542 Properties |
| 1997 | £53,134 | 7% |
1,479 Properties |
| 1996 | £49,471 | 4% |
1,102 Properties |
| 1995 | £47,694 | - |
997 Properties |
Property Price per Property Type in Chatham
Here you can find historic sold price data in order to help with your property search.
The average Property Paid Price for specific property types in the last three years are:
| Property Type | Average Sold Price | Sold Properties |
|---|---|---|
| Semi Detached House | £321,772.00 | 702 Semi Detached Houses |
| Terraced House | £263,262.00 | 1,520 Terraced Houses |
| Detached House | £462,112.00 | 280 Detached Houses |
| Flat | £182,691.00 | 461 Flats |

