
Houses for sale & to rent in Medway, England
House Prices in Medway
Properties in Medway have
an average house price of
£310k
and had 10,667 Property Transactions
within the last 3 years.¹
Medway is a location in
England with
106,177 households², where the most expensive property was sold for £2.03M.
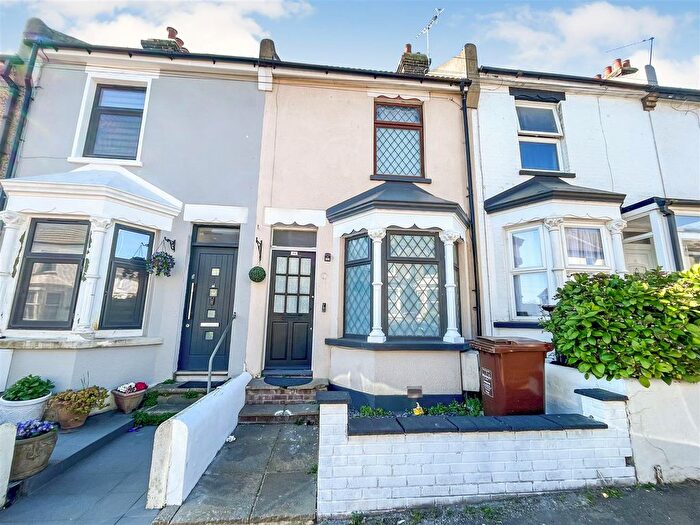
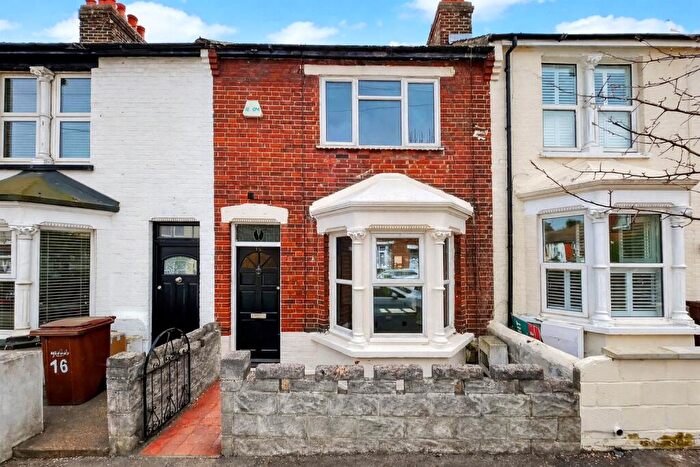
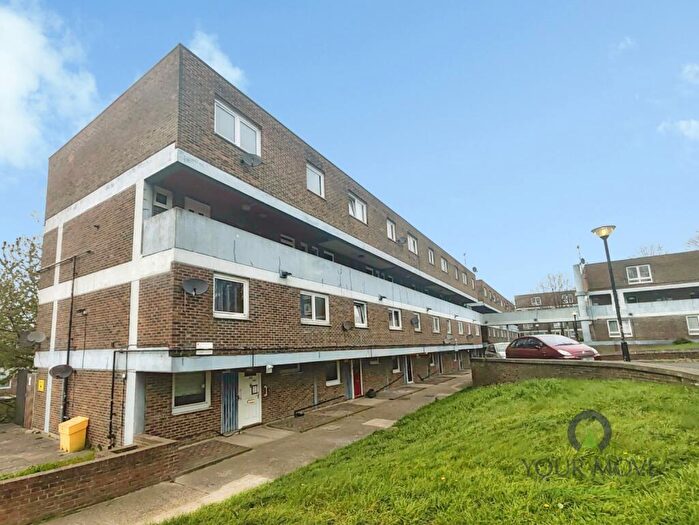
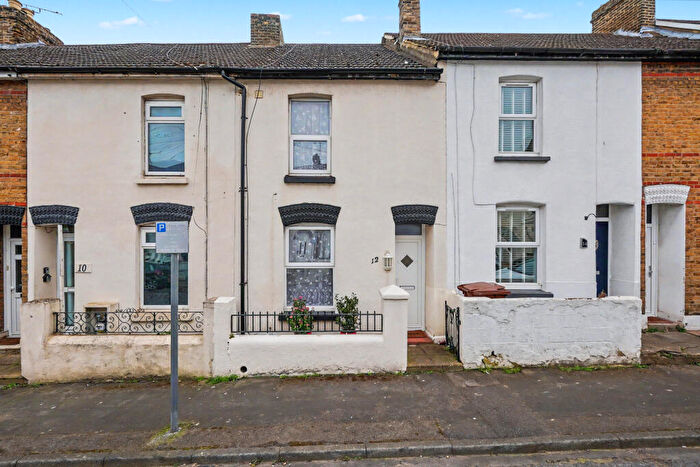
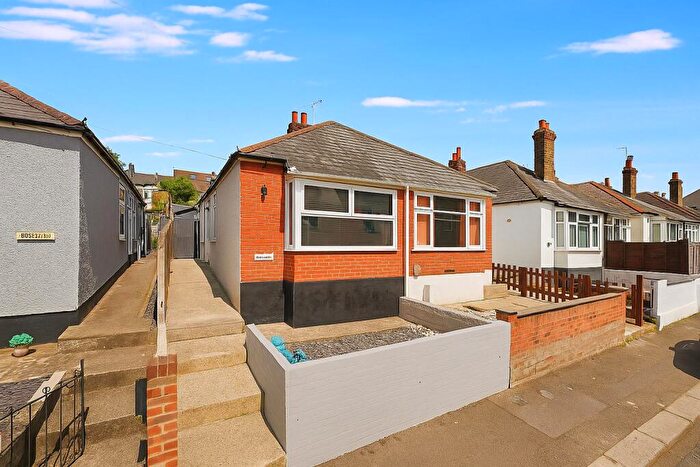
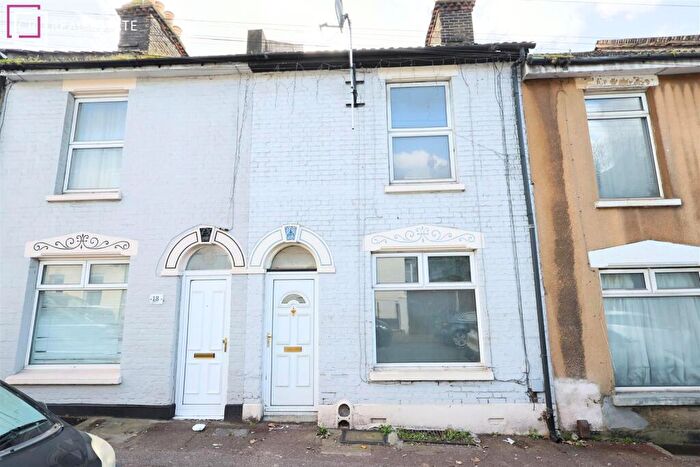
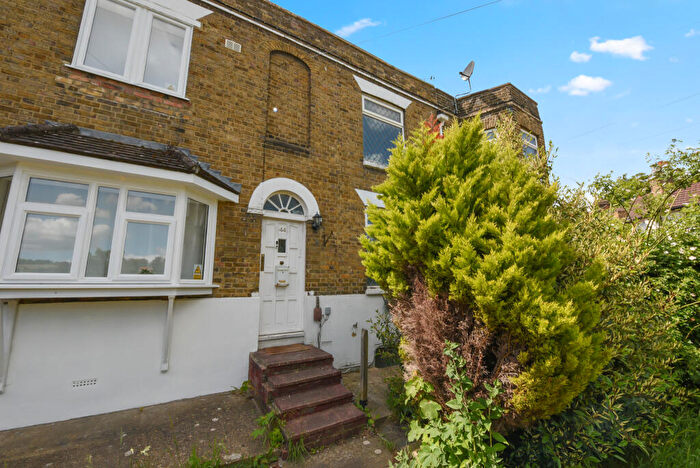
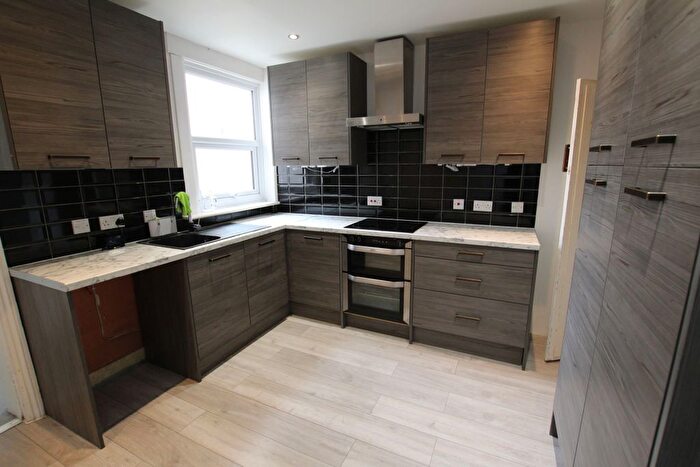
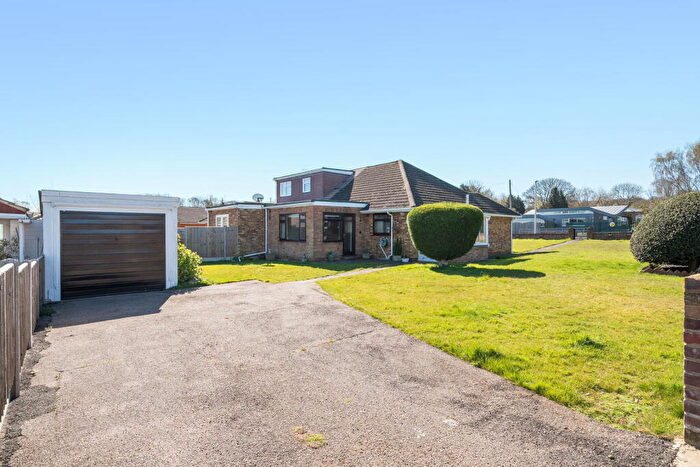
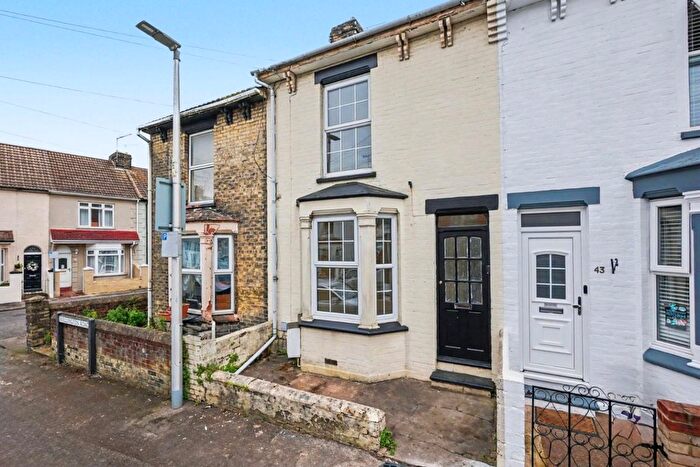
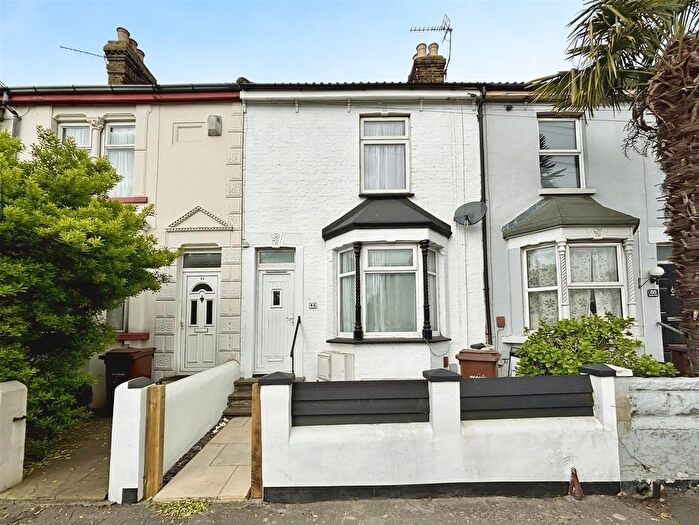
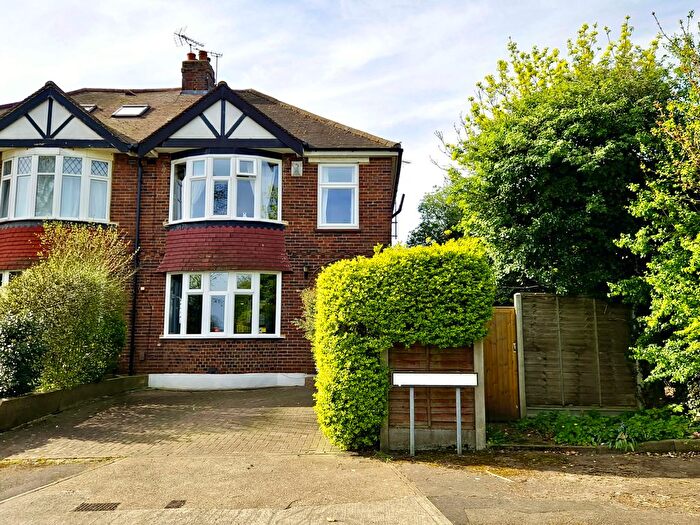
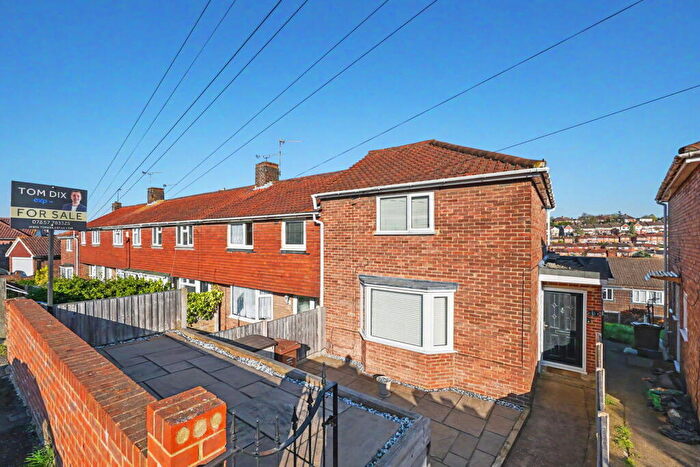
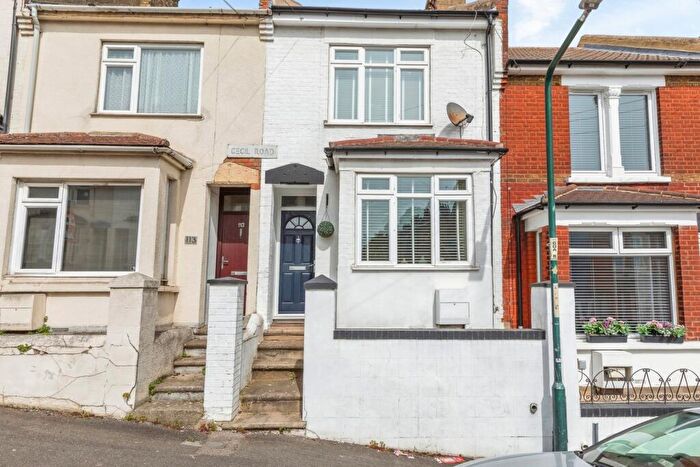
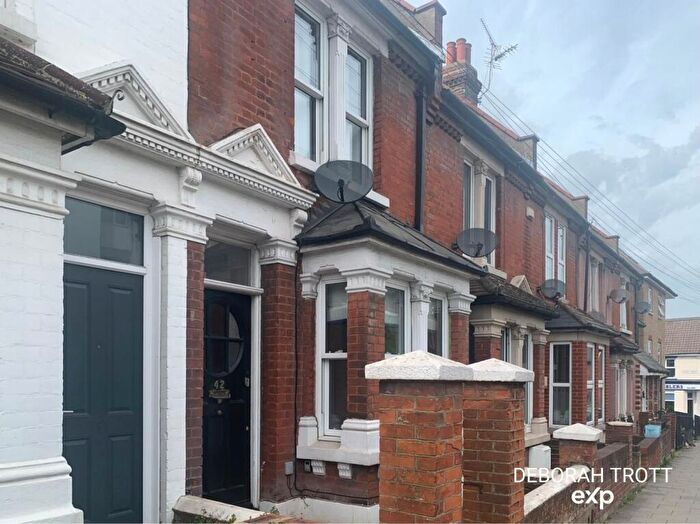
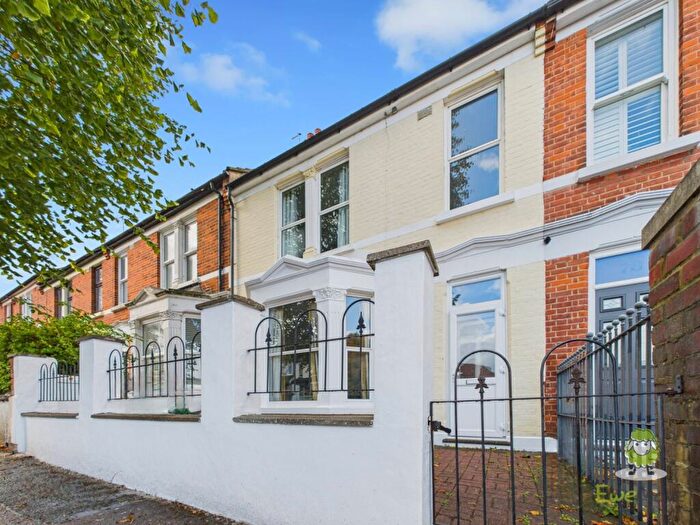
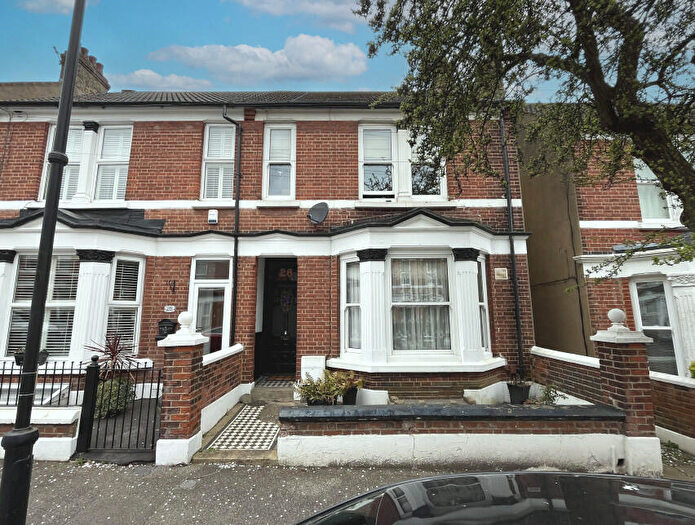
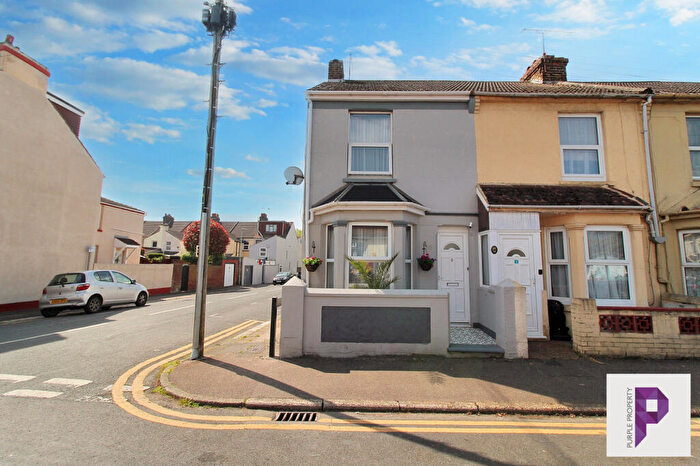
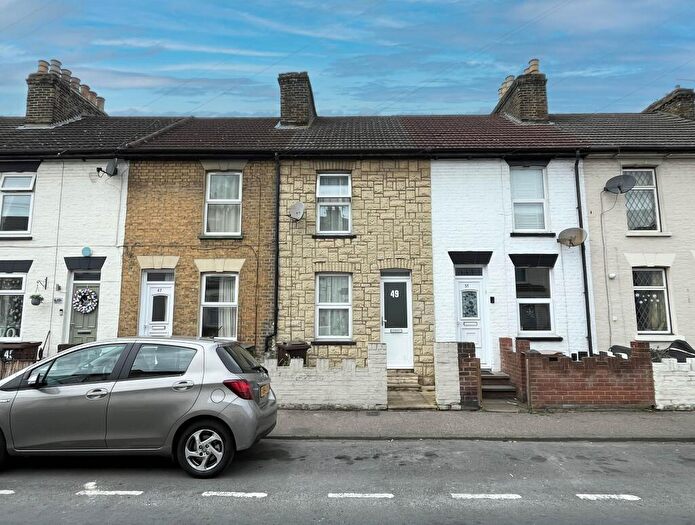
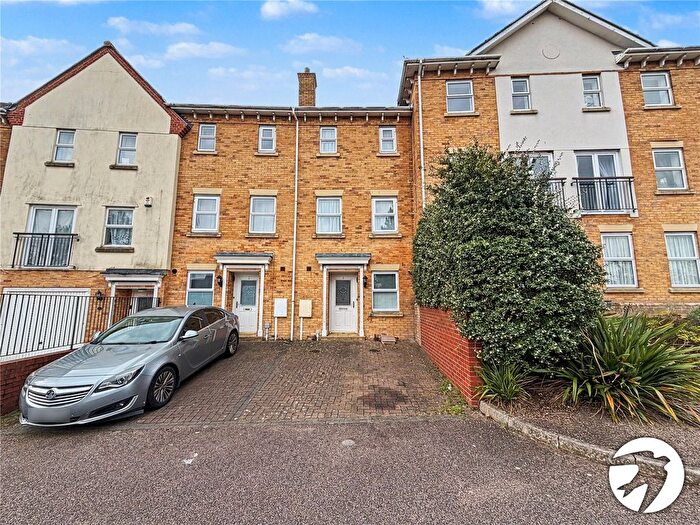
Properties for sale in Medway


![]()
If you are looking to sell your house, let it out, or receive a property valuation, an expert can help you.
Click the button below to get started.

Towns in Medway
Navigate through our locations to find the location of your next house in Medway, England for sale or to rent.
Transport in Medway
Please see below transportation links in this area:

- FAQ
- Price Paid By Year
- Property Type Price
Frequently asked questions about Medway
What is the average price for a property for sale in Medway?
The average price for a property for sale in Medway is £309,889. This amount is 14% lower than the average price in England. There are more than 10,000 property listings for sale in Medway.
What locations have the most expensive properties for sale in Medway?
The locations with the most expensive properties for sale in Medway are Sittingbourne at an average of £927,500 and Rochester at an average of £330,893.
What locations have the most affordable properties for sale in Medway?
The locations with the most affordable properties for sale in Medway are Chatham at an average of £285,036 and Gillingham at an average of £309,946.
Which train stations are available in or near Medway?
Some of the train stations available in or near Medway are Gillingham (Kent), Chatham and Rochester.
Property Price Paid in Medway by Year
The average sold property price by year was:
| Year | Average Sold Price | Price Change |
Sold Properties
|
|---|---|---|---|
| 2026 | £314,496 | -1% |
81 Properties |
| 2025 | £316,489 | 4% |
3,417 Properties |
| 2024 | £304,422 | -2% |
3,749 Properties |
| 2023 | £309,178 | 0,4% |
3,420 Properties |
| 2022 | £308,006 | 4% |
4,171 Properties |
| 2021 | £296,446 | 5% |
5,440 Properties |
| 2020 | £280,572 | 5% |
3,756 Properties |
| 2019 | £265,904 | 2% |
4,513 Properties |
| 2018 | £260,875 | 3% |
4,360 Properties |
| 2017 | £254,164 | 8% |
4,836 Properties |
| 2016 | £233,790 | 11% |
4,894 Properties |
| 2015 | £208,037 | 9% |
5,062 Properties |
| 2014 | £189,262 | 6% |
4,661 Properties |
| 2013 | £177,672 | 2% |
3,825 Properties |
| 2012 | £173,806 | 4% |
3,307 Properties |
| 2011 | £166,660 | -5% |
3,177 Properties |
| 2010 | £174,271 | 10% |
2,886 Properties |
| 2009 | £157,228 | -9% |
2,850 Properties |
| 2008 | £171,420 | -2% |
3,250 Properties |
| 2007 | £175,676 | 8% |
6,599 Properties |
| 2006 | £162,159 | 5% |
6,369 Properties |
| 2005 | £154,851 | 3% |
4,804 Properties |
| 2004 | £150,169 | 11% |
5,795 Properties |
| 2003 | £134,013 | 16% |
6,152 Properties |
| 2002 | £112,781 | 16% |
6,644 Properties |
| 2001 | £94,917 | 13% |
6,958 Properties |
| 2000 | £82,769 | 14% |
6,332 Properties |
| 1999 | £71,064 | 9% |
5,939 Properties |
| 1998 | £64,994 | 8% |
5,320 Properties |
| 1997 | £59,668 | 7% |
5,213 Properties |
| 1996 | £55,542 | 5% |
4,379 Properties |
| 1995 | £52,641 | - |
3,719 Properties |
Property Price per Property Type in Medway
Here you can find historic sold price data in order to help with your property search.
The average Property Paid Price for specific property types in the last three years are:
| Property Type | Average Sold Price | Sold Properties |
|---|---|---|
| Semi Detached House | £343,997.00 | 2,976 Semi Detached Houses |
| Terraced House | £274,896.00 | 5,106 Terraced Houses |
| Detached House | £498,801.00 | 1,286 Detached Houses |
| Flat | £182,270.00 | 1,299 Flats |