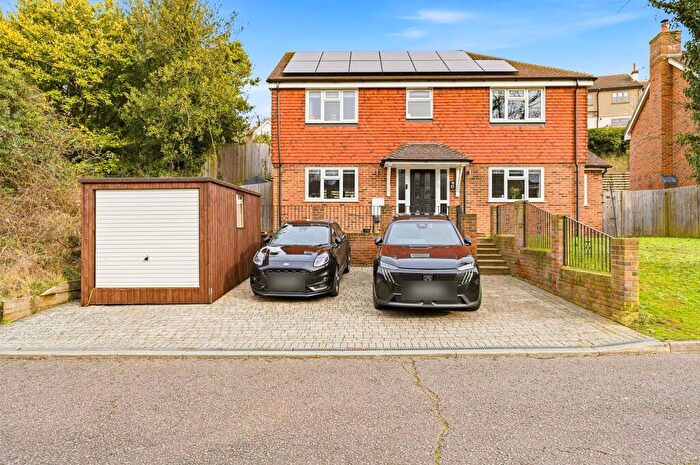
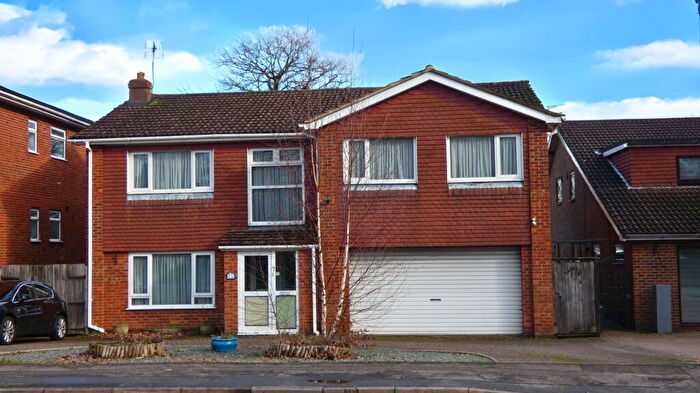
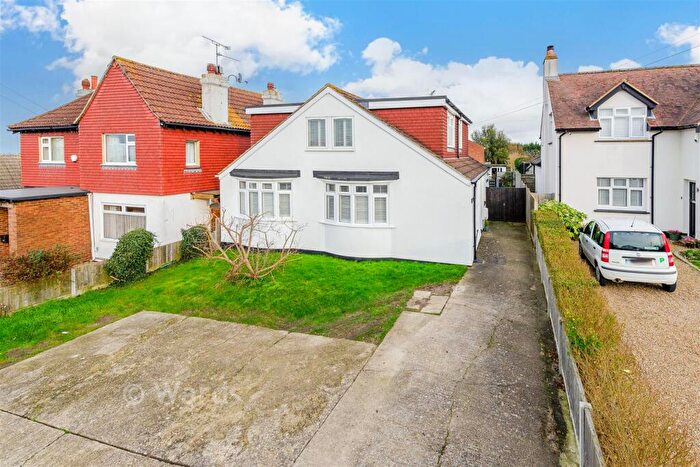
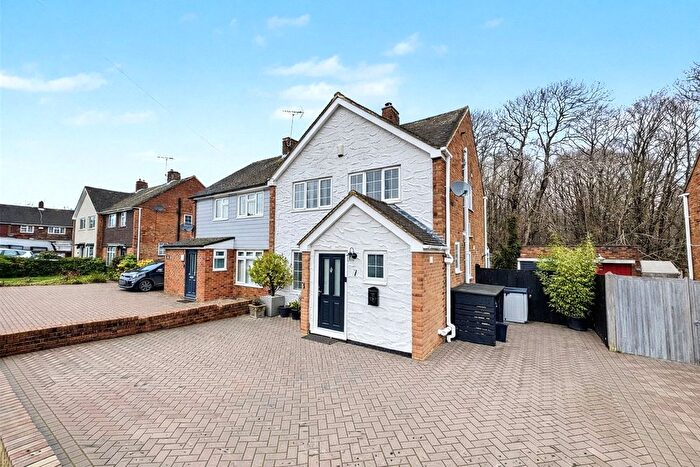
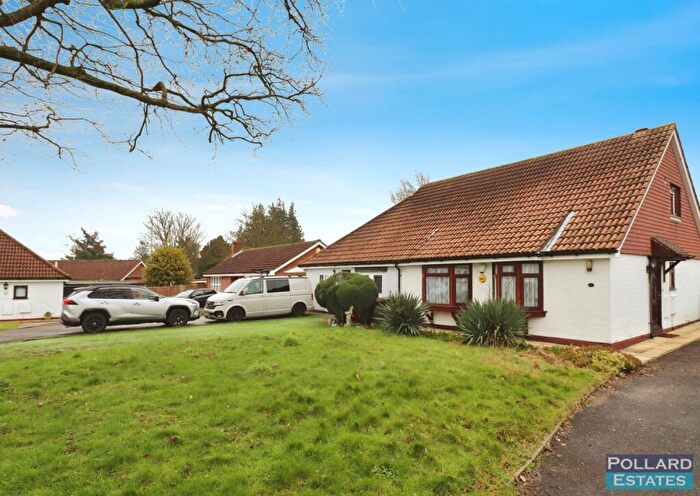
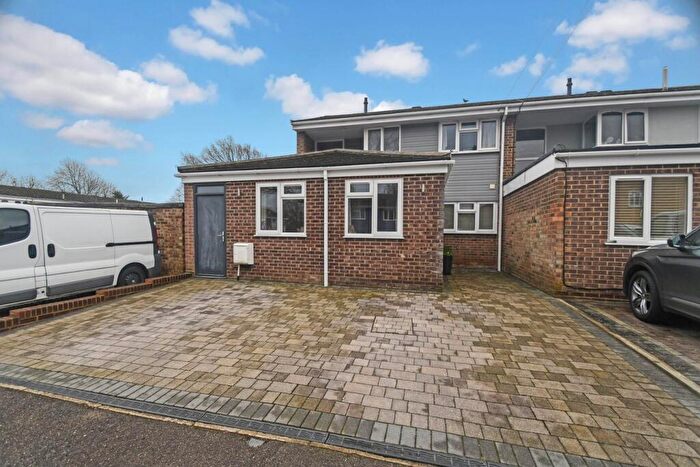
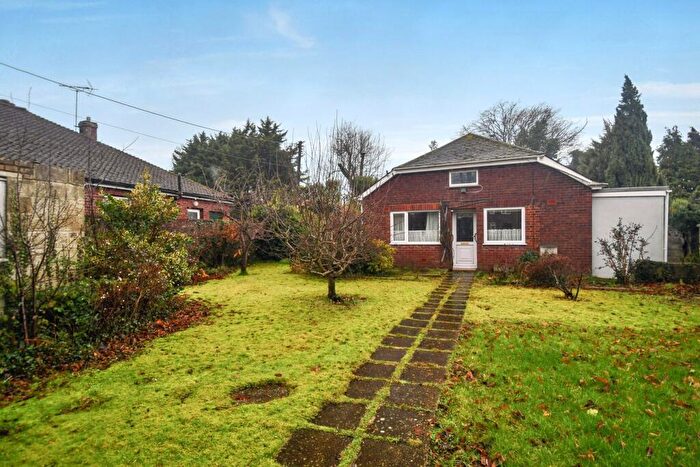
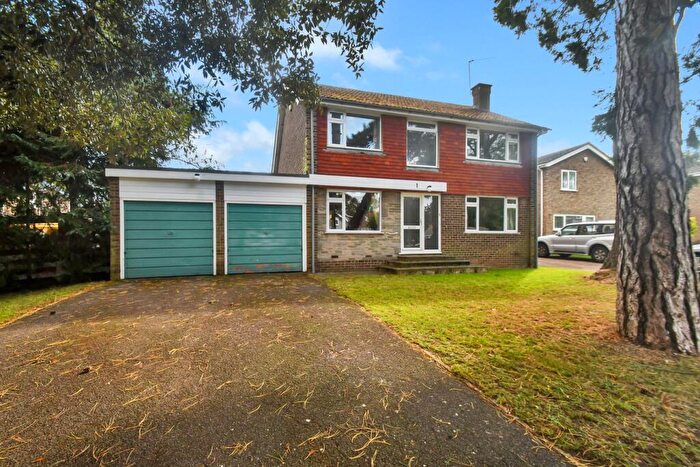
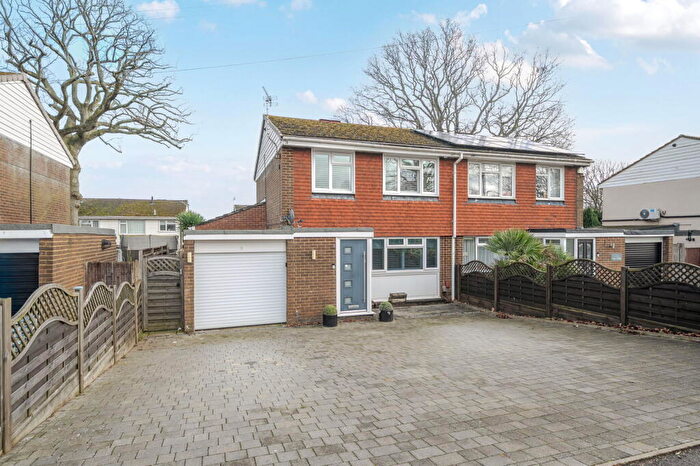
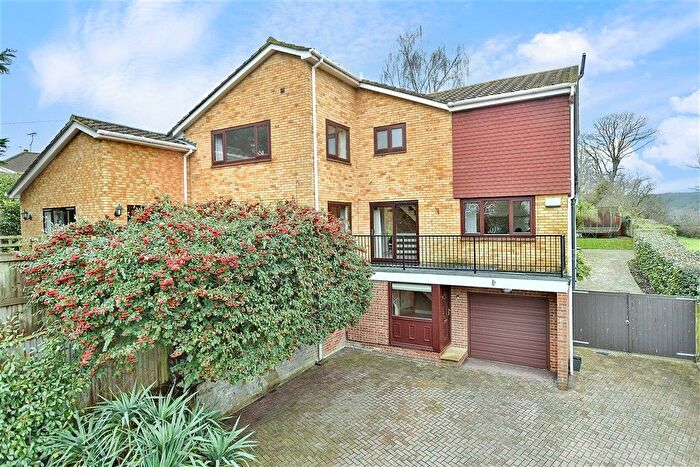
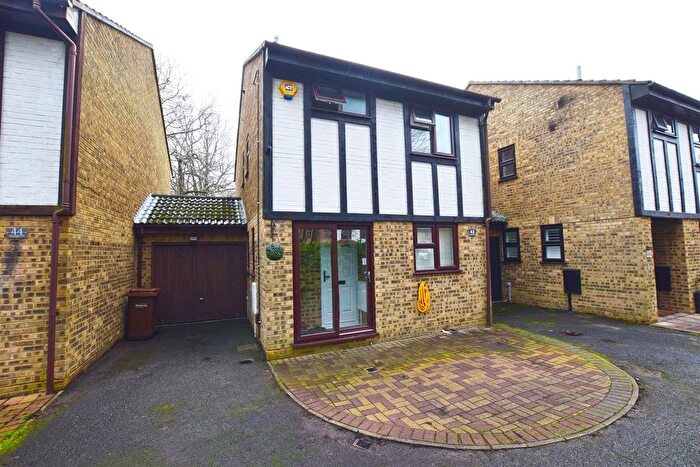
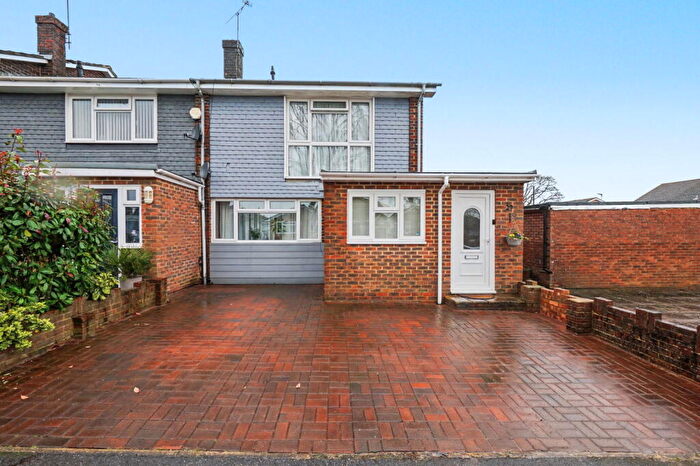
Houses for sale & to rent in Hempstead And Wigmore, Gillingham
House Prices in Hempstead And Wigmore
Properties in Hempstead And Wigmore have an average house price of £433,499.00 and had 259 Property Transactions within the last 3 years¹.
Hempstead And Wigmore is an area in Gillingham, Medway with 3,139 households², where the most expensive property was sold for £1,060,000.00.
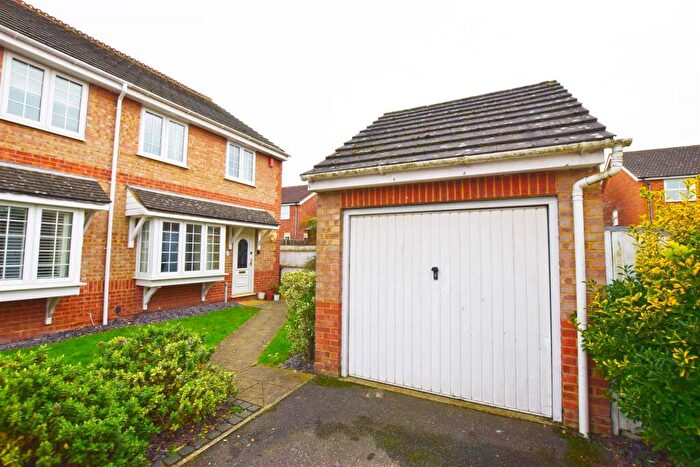
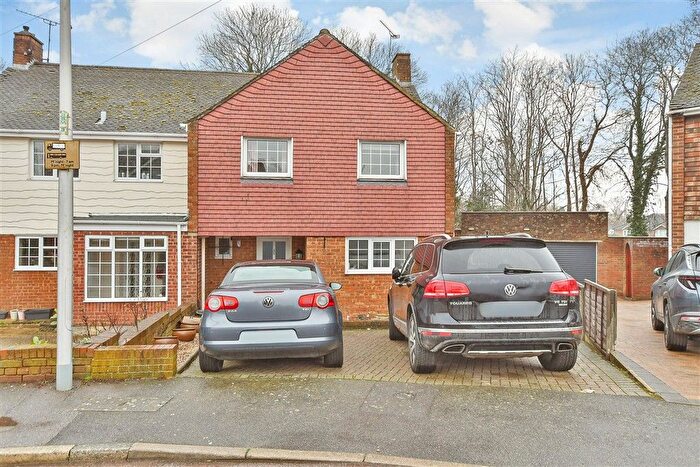
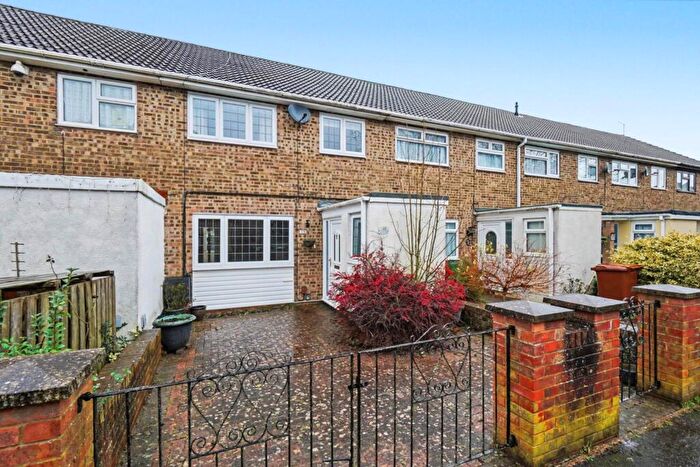
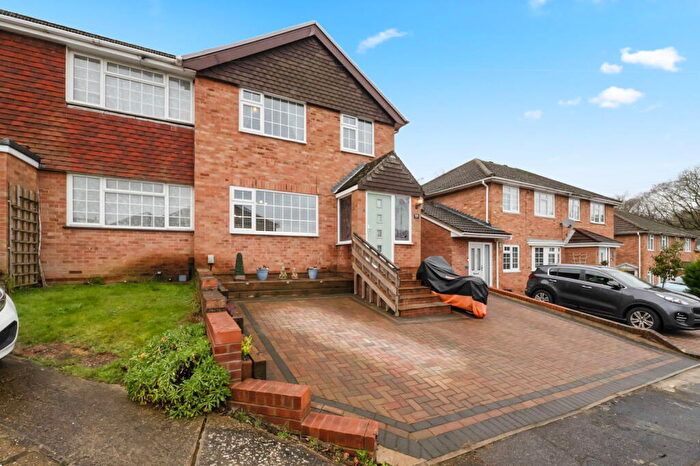
Properties for sale in Hempstead And Wigmore
Roads and Postcodes in Hempstead And Wigmore
Navigate through our locations to find the location of your next house in Hempstead And Wigmore, Gillingham for sale or to rent.
| Streets | Postcodes |
|---|---|
| Almond Grove | ME7 3RZ ME7 3SE |
| Banksview Drive | ME7 3AZ |
| Barncroft Drive | ME7 3TJ |
| Birch Grove | ME7 3RA ME7 3RB ME7 3RE ME7 3RG ME7 3HJ |
| Black Rock Gardens | ME7 3TH |
| Blowers Wood Grove | ME7 3RD |
| Bredhurst Road | ME8 0QT ME8 0QU ME8 0QX ME8 0RD ME8 0RG ME8 0RH |
| Brickmakers Way | ME7 3BF |
| Capstone Ridge | ME7 3AQ |
| Capstone Road | ME7 3JF ME7 3QW |
| Cedar Grove | ME7 3QT ME7 3QZ |
| Chapel Lane | ME7 3TD |
| Claridge Court | ME7 3NE |
| Clematis Avenue | ME8 0TB |
| Clermont Close | ME7 3TQ |
| Cobblestones | ME7 3NS ME7 3NT |
| Coppergate | ME7 3QN |
| Copperpenny Drive | ME7 3DT |
| Coppice Court | ME7 3TE |
| Drewery Drive | ME8 0NX |
| Dukes Meadow Drive | ME7 3DW |
| Eleanor Court | ME8 0GW |
| Evergreen Close | ME7 3QY |
| Fairview Avenue | ME8 0PX ME8 0QD ME8 0QE ME8 0QJ ME8 0QL ME8 0QP |
| Ferndown Close | ME7 3SN |
| Foulds Close | ME8 0QF |
| Fowler Close | ME8 0LX |
| Georgian Way | ME8 0QY ME8 0QZ ME8 0RA |
| Gilbert Close | ME7 3QQ |
| Glenwood Close | ME7 3RP |
| Grain Road | ME8 0NB ME8 0ND |
| Grassy Glade | ME7 3RR |
| Greenbank Close | ME7 3SG |
| Greenfinches | ME7 3PN ME7 3PW |
| Hadleigh Court | ME7 3SW |
| Hanover Drive | ME8 0RE ME8 0RF |
| Harrow Road | ME7 3QA ME7 3QB |
| Harty Avenue | ME8 0NA |
| Hempstead Road | ME7 3QE ME7 3QG ME7 3QH ME7 3QJ ME7 3QL ME7 3RF ME7 3RH ME7 3SA |
| Hempstead Valley | ME7 3PQ |
| Hempstead Valley Drive | ME7 3PE |
| Hempstead Valley Shopping Centre | ME7 3PB ME7 3PD |
| Hickory Dell | ME7 3SL |
| Hinton Crescent | ME7 3RL ME7 3RN |
| Hoath Close | ME8 0SH |
| Honey Close | ME7 3PF |
| Honeysuckle Close | ME7 3NF |
| Horseshoe Close | ME7 3QU |
| Houghton Avenue | ME7 3RY |
| Kenyon Walk | ME8 0RQ |
| Kingsdown Close | ME7 3PX |
| Lambsfrith Grove | ME7 3RU ME7 3SB |
| Lamplighters Close | ME7 3DX ME7 3NZ |
| Landor Court | ME7 3SP |
| Lavenda Close | ME7 3TB |
| Lime Court | ME8 0LP |
| Lombardy Close | ME7 3SQ |
| Lullingstone Close | ME7 3TS |
| Magdalen Close | ME7 3TA |
| Magnolia Avenue | ME8 0TR |
| Maidstone Road | ME8 0JX ME8 0JY ME8 0LR ME8 0NW |
| Marquis Drive | ME7 3DR |
| Martin Court | ME7 3SD |
| Meadowdown Close | ME7 3SU |
| Medlar Grove | ME7 3RQ |
| Melody Close | ME8 0NH |
| Mulberry Close | ME7 3SJ |
| Norman Close | ME8 0TG ME8 0TQ |
| Old Barn Close | ME7 3PJ |
| Pear Tree Lane | ME7 3PP ME7 3PR ME7 3PS ME7 3PT ME7 3PU ME7 3RJ |
| Pine Grove | ME7 3QP ME7 3QR ME7 3QS |
| Pippin Croft | ME7 3SH |
| Plumtree Grove | ME7 3RW |
| Primrose Avenue | ME8 0TD |
| Prinys Drive | ME8 0RB |
| Rutland Place | ME8 0LG |
| Sandy Dell | ME7 3SZ |
| Shepherds Gate | ME7 3TG |
| Spekes Road | ME7 3RS ME7 3RT |
| Stalham Court | ME7 3TF |
| Star Lane | ME7 3NN ME7 3NW |
| Tamarind Close | ME7 3ST |
| Thanet Road | ME8 0JZ |
| The Everglades | ME7 3PY ME7 3PZ |
| The Old Carriageway | ME7 3TN |
| The Paddocks | ME7 3NG |
| The Rise | ME7 3SF ME7 3SR ME7 3SS |
| Thistledown Close | ME7 3SY |
| Water Meadow Close | ME7 3QF |
| Waters Place | ME7 3PG |
| Wigmore Glade | ME8 0TY |
| Wigmore Road | ME8 0LU ME8 0LY ME8 0LZ ME8 0TA ME8 0TH ME8 0TJ ME8 0TL ME8 0TN ME8 0TW |
| Wildwood Glade | ME7 3SX |
Transport near Hempstead And Wigmore
-
Rainham (Kent) Station
-
Gillingham (Kent) Station
-
Chatham Station
-
Rochester Station
-
Newington Station
-
Strood Station
-
Bearsted Station
- FAQ
- Price Paid By Year
- Property Type Price
Frequently asked questions about Hempstead And Wigmore
What is the average price for a property for sale in Hempstead And Wigmore?
The average price for a property for sale in Hempstead And Wigmore is £433,499. This amount is 40% higher than the average price in Gillingham. There are 2,292 property listings for sale in Hempstead And Wigmore.
What streets have the most expensive properties for sale in Hempstead And Wigmore?
The streets with the most expensive properties for sale in Hempstead And Wigmore are Marquis Drive at an average of £850,000, Copperpenny Drive at an average of £799,400 and Cobblestones at an average of £727,333.
What streets have the most affordable properties for sale in Hempstead And Wigmore?
The streets with the most affordable properties for sale in Hempstead And Wigmore are Coppice Court at an average of £197,999, Thistledown Close at an average of £224,666 and Meadowdown Close at an average of £273,474.
Which train stations are available in or near Hempstead And Wigmore?
Some of the train stations available in or near Hempstead And Wigmore are Rainham (Kent), Gillingham (Kent) and Chatham.
Property Price Paid in Hempstead And Wigmore by Year
The average sold property price by year was:
| Year | Average Sold Price | Price Change |
Sold Properties
|
|---|---|---|---|
| 2025 | £453,381 | 9% |
82 Properties |
| 2024 | £411,786 | -6% |
88 Properties |
| 2023 | £436,649 | -6% |
89 Properties |
| 2022 | £464,076 | 4% |
104 Properties |
| 2021 | £443,468 | -4% |
158 Properties |
| 2020 | £460,573 | 17% |
112 Properties |
| 2019 | £381,765 | -2% |
111 Properties |
| 2018 | £388,120 | 4% |
86 Properties |
| 2017 | £373,082 | 8% |
115 Properties |
| 2016 | £343,465 | 7% |
121 Properties |
| 2015 | £318,479 | 18% |
133 Properties |
| 2014 | £261,411 | - |
114 Properties |
| 2013 | £261,358 | 3% |
115 Properties |
| 2012 | £254,273 | 2% |
107 Properties |
| 2011 | £248,790 | -7% |
79 Properties |
| 2010 | £267,209 | 14% |
98 Properties |
| 2009 | £229,768 | -13% |
95 Properties |
| 2008 | £258,658 | 3% |
80 Properties |
| 2007 | £250,225 | 1% |
184 Properties |
| 2006 | £248,045 | 5% |
163 Properties |
| 2005 | £236,619 | 2% |
109 Properties |
| 2004 | £231,410 | 11% |
140 Properties |
| 2003 | £206,451 | 16% |
142 Properties |
| 2002 | £172,853 | 13% |
176 Properties |
| 2001 | £150,766 | 9% |
193 Properties |
| 2000 | £137,446 | 14% |
180 Properties |
| 1999 | £117,860 | 11% |
161 Properties |
| 1998 | £104,379 | 5% |
148 Properties |
| 1997 | £99,567 | 11% |
198 Properties |
| 1996 | £88,250 | 5% |
179 Properties |
| 1995 | £83,462 | - |
134 Properties |
Property Price per Property Type in Hempstead And Wigmore
Here you can find historic sold price data in order to help with your property search.
The average Property Paid Price for specific property types in the last three years are:
| Property Type | Average Sold Price | Sold Properties |
|---|---|---|
| Semi Detached House | £384,463.00 | 98 Semi Detached Houses |
| Detached House | £577,298.00 | 100 Detached Houses |
| Terraced House | £295,433.00 | 52 Terraced Houses |
| Flat | £167,388.00 | 9 Flats |

